Báo cáo nghiên cứu khoa học: " AIR QUALITY MESO-SCALE MODELING IN HO CHI MINH CITY EVALUATION OF SOME STRATEGIES’ EFFICIENCY TO REDUCE POLLUTION" pot
Bạn đang xem bản rút gọn của tài liệu. Xem và tải ngay bản đầy đủ của tài liệu tại đây (578.96 KB, 9 trang )
TẠP CHÍ PHÁT TRIỂN KH&CN, TẬP 9, SỐ 5 -2006
Trang 65
AIR QUALITY MESO-SCALE MODELING IN HO CHI MINH CITY
EVALUATION OF SOME STRATEGIES’ EFFICIENCY TO
REDUCE POLLUTION
Quoc Bang Ho
(1)
, Alain Clappier
(2)
, Erika Zarate
(2)
, Hubert van den Bergh
(2)
(1) Institute for Environment and Resources (IER), VNU-HCM
(2) Air and Soil Pollution Laboratory, Swiss Federal Institute of Technology, Switzerland
(Manuscript Received on November 29
th
, 2005, Manuscript Revised May 12
th
, 2006)
ABSTRACT : Ho Chi Minh City (HCMC), the largest city of Vietnam and the seventh
city with the highest density of inhabitants in the world (3,300 persons by kilometer square)
(HCMC Urban Drainage Company, 1998), is one of the cities in the world which are seriously
influenced by pollution. The main sources of atmospheric pollution are vehicles (motorbikes),
the industry and population. Numerical models are the only existing tools able to predict air
quality concentrations and to determine the strategies of reduction of air pollution in HCMC,
different scenarios were tested.
The results obtained show that the wind direction is more influenced by global scale than
local phenomena. The results of the simulations show that the ozone plume is 90km in length
and 30 km in width at 12h00 LT. During the selected episode (8/1/2003), the zone in the South-
West of HCMC is the most polluted one (180ppb at midday).
1. INTRODUCTION
The economic growth and urbanization in (Ho Chi Minh City) HCMC of Viet Nam have
caused air pollution episodes of high ozone (O
3
). The main sources of atmospheric pollution
are vehicles (motorbikes), the industry and population. In the busy streets of HCMC, 2,305,415
motorcycles and 332,622 cars were counted at the end of 2003, for a population of 5,625
million people in an area of 2,093.7 kilometer square.
According to the HCMC’s General Statistics Office, there are about 28,500 factories in the
city, distributed in ten industrial zones and two exports processing zones, producing a total of
60,128 tons per year of SO
2
, 15,295 tons per year of NO
2
and 1,539 tons per year of CO. In
comparison with other regional cities that also experienced rapid economic growth in recent
decades, the air pollution problem in HCM City is not as bad but rapidly becoming a serious
problem unless some measures are taken. In HCMC, air quality is an increasing problem and it
becomes important to design abatement strategies to reduce the pollution levels. Air quality
studies are necessary to test the efficiency of the different strategies. For such studies, we need
measurement as well as numerical model. In many countries as in Viet Nam, it is difficult to
access all the data needed for the air quality simulation. In this article, we propose a
methodology to simulate the air quality in a minimum of time with a minimum of input data.
2. THE AIMS OF OUR PROJECT ARE:
•
To simulate air pollution to understand the atmospheric phenomena taking place at Ho
Chi Minh City.
•
To determine the strategies to reduce air pollution in HCMC
3. METHODS AND CONTENTS OF RESEARCH
The first methodology, based on the numerical Eulerien model FVM, was selected to
simulate meso-scale wind fields, on January 8, 2003. The method "Nesting-one way" was used
to obtain boundary and initial conditions.
Science & Technology Development, Vol 9, No.5 - 2006
Trang 66
The second methodology, based on the “Bottom–up” - COPERT III, was used to generate a
traffic emission inventory, whereas the "Top-down" methodology was used for the rest of the
sources.
The third methodology, based on the numerical Eulerien model TAPOM (transport and air
pollution model) was used to simulate air pollution in HCMC. Lastly, to determine the
strategies of reduction of air pollution in HCMC, different scenarios were tested
4. DESCRIPTION OF THE DATA AND MODEL USED FOR THE STUDY
4.1 Description of the data
4.1.1.Data used for the emission
To make an emission inventory, a very large data of many different origins and with
different organizations are necessary. In a developing country, like Viet Nam, the main
problems are:
- “Access” the data (data does not exist)
- Economic activities responsible of the emissions are changing very rapidly.
So that, it is necessary to use methodologies simple and easily implemented. To perform the
emission calculations, we will estimate from available existing data. For industries, residence
and biogenic sources, we use data of total emissions in Viet Nam, distribution of the sources of
emissions for each pollutant (Projet Mics-Asia, Austrian 2000), the land use of domain
calculated, the population and the area of Viet Nam, the population and the area of domain
calculated. For the road traffic, we used the emission factors from China (Doste, report N°1.
2001) for calculations because the situation of the traffic in China is similar to Viet Nam.
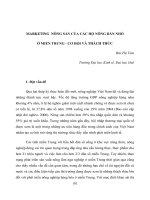
4.1.2. Measurement data
The air quality network (fig.1) in HCMC (by DOSTE: Department of Science, Technology
and Environment of Ho Chi Minh City): At the end of 1992, The network includes four
ambient air-monitoring stations and three stations for roadside monitoring. In June 2000, the
automatically air quality monitoring system supported by UNDP & ANIDA, including two
urban background stations (monitor PM10, SO
2
, NOx, CO, O
3
), two roadside stations, were
installed. In Nov 2002, more new five automatically air quality monitoring stations were
installed by NORAD support, including three urban background stations, two roadside stations.
Meteorological data was acquired from the DOST, meteorological parameters such as wind
speed and direction, humidity, temperature, solar radiations and air pressure.
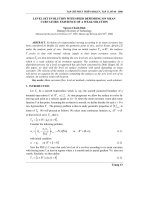
Fig.1. Localization of monitoring stations in domain simulated. Note: D: District, PN: Phu Nhuan. QT
station is located at Hoc Mon district, TD at Thu Duc district, BC at Binh Chanh district, ZO at D.1
district, DO at D3 district, TN at Tan Binh district, TS at Phu Nhuan and D2 at district 2
4.2. Model description
0
3
TẠP CHÍ PHÁT TRIỂN KH&CN, TẬP 9, SỐ 5 -2006
Trang 67
The LPAS (Clappier et al., 1996) has developed models for air quality simulation: meteo
model FVM and chemical transport model TAPOM.
4.2.1. Metrological model FVM (Finite Volume Model)
A meso scale FVM model is non-hydrostatic (Schayes et al., 1996; Thunis, 1995) and
anelastic. It solves the momentum equation for the wind component, the energy equation for
the potential temperature, the air humidity equation for mean absolute humidity and the Poisson
equation for the pressure. The turbulence is parameterized using turbulent coefficients. In the
transition layer these coefficients are derived from turbulent kinetic energy (TKE, computed
prognostically), and a length scale, following the formulation of Bougeault and Lacarrere
(1989). In the surface layer, in rural areas, the formulation of Louis (1979) is used. The ground
temperature and moisture, in rural areas, are estimated with the soil module of Tremback and
Kessler (1985). In the urban area, the effect of the buildings are simulated using the
parameterization developed by Martilli et al. (2002)
4.2.2. Air quality model (TAPOM)
The TAPOM model simulates the evolution of the pollutants in the atmosphere. It takes
into account different atmospheric processes: The transport by the mean wind, the diffusion by
turbulence, the transformation by several chemical reactions and the dry deposition. The
chemical transformations are simulated using the RACM (Stockwell et al., 1997) which
considers 76 chemical species linked via 236 reactions. The transport is solved using the
algorithms developed by Collella and Woodward (1984) and Clappier ( 1998).
The photolysis rate constants used for chemical reactions are calculated using the
radiation module TUV (Madronich, 1998)
4.3 Model setup
4.3.1. Choice of the period of simulation
The choice of the period of simulation must be representative of an episode of pollution.
We chose one of the worst cases of pollution in all of one year in HCMC. The climate in
HCMC is divided into 2 principal seasons: the wet season (from May to November) and the dry
season (from December to March of year next) (Hien et al ,2001). April is the hottest period of
the year and the coldest December.
On 8 and 9 January 2003 was selected for the period of
modeling because
: This period is in dry season (because the model does not contain the rain,
the cloud and pollution is stronger during this season), have the high temperatures and solar
radiation. After analysis we finds that solar radiation of January are highest (solar radiation is
moreover 1000W/m
2
and the temperature of 38 Celsius degrees).
This period have the strongest ozone concentration, it is found that the ozone
concentration passed the limiting standard during this period. At BC station (sub-urban), the
highest 1h average zone concentration of 125 ppb was observed (while the 1h Viet Nam Air
Quality Objective for ozone is of 102 ppb)
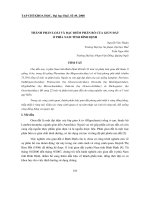
4.3.2. Choice of the domain of simulation
In horizontal, the simulated domain consists of 34 points in the east–west by 30 grid
points in the north-south direction with a resolution of 1km x 1km covering the HCMC (D2
Fig. 2).
Science & Technology Development, Vol 9, No.5 - 2006
Trang 68
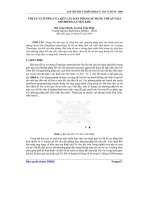
Fig.2. Topography and geographical description of simulated by FVM (DA, DB, D1, D2) domains on
the HCMC peninsula
Lateral boundary conditions were externally forced from the output of larger–scale
simulations performed; four additional grid cells with spacing ranging from 1 to 75km are
added in order to reduce the impact of the uncertainties in the boundary conditions on the
domain of interest. The vertical resolution is 40m for the first level, and then it is stretched up
to the top of the domain at 1500m (Martilli et al., 2002).
4.3.3. Initial and boundary conditions
Meteorological parameters: For the largest domain, the initial and the boundary conditions
are interpolated from the results of NCEP climate forecast model which are available at the
NCEP. For the smaller domain, the initial and boundary conditions are obtained using the
“nesting-one-way” technique.
To interpolate of a larger domain to a smaller domain, it is necessary to use a program of
interpolation, "PREPROCYA".The program uses the data micro-weather of the larger domain
to calculate the smaller domain like boundary conditions. Boundary conditions for
photochemical simulations are based on the results of measurements of CEFINEA and DOSTE.
Those show 30ppb of ozone and very low values of NO and NO
2
(0.19ppb)
4.4. Emission inventory
The calculated emissions include (CO, NOx, VOC) regularly and irregularly of pollutants
(N
2
O, NH
3
, SO
2
, NMVOC speciation ) and the fuel consumption is also calculated. In other to
get high spatial, temporal resolution (respectively 1 x 1 km
2
and 1 hour) and the availability of
the data, a bottom-up approach has been chosen for traffic source. COPERT III software is
used to make the emission inventory for traffic source. For this domain, the data for industries,
residential and biogenic sources is unavailability to make emission inventory by bottom-up
approach so that a top-down approach has been chosen for these others sources.
From data of total emissions in Viet Nam and distribution of the sources of emissions for
each pollutant
(Projet Mics-Asia, Austria 2000), we can calculate the emission for one certain
hour within by year by using formula:
E
h
= E
a
* f
a
* f
w
* f
d
/8760. With: E
h
, E
a
are the
emission for a certain hour and the annual total emissions. f
a
, f
w
and f
d
are the emission quota
for annual cycle, for weekly cycle and for diurnal cycle. 8760 is a number of hours per year
(Friedrich et Reis.2004). The results obtained are divided into three types of emissions: “Hot
emission", "cold start" and "evaporation" (only for COV). Hot emission is the most important
emission (more than 95% of the total of the emissions)
TẠP CHÍ PHÁT TRIỂN KH&CN, TẬP 9, SỐ 5 -2006
Trang 69
5. MODEL RESULTS COMPARED WITH MEASUREMENTS
5.1 Meteorology results
The results of wind speed of the model and measurement are similar, the wind speed is
low (0.6-1.7m/s) of the morning and becomes high (1.8-2.5 m/s) at the beginning of after
midday, during the evening the wind speed is similar the morning. The result of simulations
shows that the wind direction was influenced very weakly by the local phenomena, which are
the phenomena of slopes wind and sea breeze. At 7h00, the wind direction was influenced by
the phenomenon “slopes wind” on the mountain in North-east of domain because at 7h00 of the
morning on the mountain the weather is still cold, so that the wind direction is Northern- east
on the zone near the mountain. In addition, at this hour the sea is still hot, so that wind direction
is Northern-West on the zone near the sea “sea breeze”. At 16h00, the wind direction on the
mountain already changed towards the mountain (Southern-West), because at 16h00, the air on
the mountain is already heated.The results of this simulation show that the passage of the wind
on a large scale (forcing) with a small grid gives very similar results with measurements and in
HCMC, the wind direction is more influenced by global scale than local phenomena
5.2 Air quality results: Distribution of O
3
along the plume trajectory
Ozone is a strong oxidant likely to react with almost all the biological tissues. At high
concentrations (>60 ppb), ozone exposure irritates the mucous membranes of the respiratory
tract and causes a feeling a pressure on the chest and pain when breathing deeply. Short-term
effects of ozone are documented in numerous studies (Ponce de Leon et al, 1996, Jones et al.,
1995) showing a correlation between hospital admissions due to asthma or pneumonia during
photochemical smog episodes. Long-term exposure to ozone, exerts adverse effects on human
heath. In this case, measured diminution of pulmonary function goes along with chronic
infections and structural modifications of the tissues in the bronchi-pulmonary tissues and
promotes premature ageing of the respiratory organs.
a)
b)
Q
T
B
C
T
D
D
2
Z
O
D
O
H
B
T
N
T
S
QT
BC
TD
D2
ZO
DO
HB
TN
TS
Science & Technology Development, Vol 9, No.5 - 2006
Trang 70
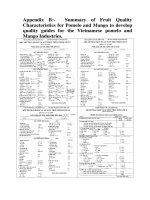
c)
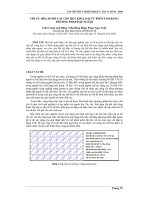
Fig. 3. Simulated O
3
values within the first
vertical layer (30m) at
(a) 0400LT, (b) 1200LT, and (c) 1600LT on
January 8, 2003.
The contour is the zone in center of HCMC
and localization of monitoring stations in
domain simulated.
Figure 3 shows the development of the ozone plume during the day of January 8, 2003.
We are observed that: during the day, the ozone plume goes down to the South-West of the
city. The maximum ozone concentration is 180ppb (at midday). The plume leaves the basin of
HCMC by the South-West at the beginning of evening (18h00). The ozone concentrations
remain low in center HCMC (80ppb of O
3
at 17h00).
We can see that the ozone plume is influenced much by the strong wind of North-East. At
midday, the concentration of ozone in the Binh Chanh district attains 180ppb, district 8
(160ppb), district 6 (140ppb), Districts 1, 3, 5, 10, 11 (100ppb), at the Tan Binh, 4, 7 (80ppb)
and the other districts are lower than 60ppb. Hence, the concentration of ozone of 3 districts at
HCMC exceeds the limit of the standard (102ppb). The Binh Chanh, 8 and 6 districts (figure
1.1) are seriously influenced by pollution, while the emissions are higher at districts 1, 3 and 5
(figure 1). For this reason, to reduce the ozone concentration in the Binh Chanh, 8 and 6
districts, it is necessary to find strategies of reduction of the emissions in Districts 1, 3 and 5.
After 17h00, the plume leaves almost the city in the South-West direction.
The maximum ozone concentration at 17h00 is 100ppb at the Binh Chanh district. And we
can see that this is the most favorable case for the population in the center of HCMC and
unfavorable for the population in the South-West of HCMC. Once the models were shown able
to reproduce and understand the principal characteristics of pollution in HCMC, it can be
interesting to go deeper in the explanations by testing different scenarios to reduce pollution.
5.3. Abatement strategies: emission reduction scenarios
One of the most important functions of the air quality models of the meso-scale 3D is their
capacity to simulate strategies to reduce pollution. To study the best manner of reducing these
emissions of pollutants, many simulations must be carried out with various scenarios of the
reductions of the emissions. With these models 3D, we can realize not only scenarios of
reduction by sources, but also of the scenarios of reduction in the various zones of the city.
Q
T
B
C
T
D
D
2
Z
O
HB
TN
T
S
D
O
TẠP CHÍ PHÁT TRIỂN KH&CN, TẬP 9, SỐ 5 -2006
Trang 71
a) b)
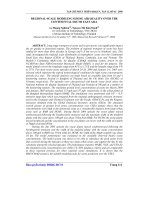
c)
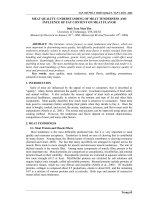
Fig.4. ffect of two scenarios on O
3
concentration fields for the 8
th
January, 2003 at 1200LT. The figure
a) represents the concentration fields for the base case, the figure b) represents the concentration fields
for the scenarios of traffic and the figure c) represents the concentration fields for the scenarios of
population
.
We present here the impacts of two scenarios on the ozone troposphere levels. Two
scenarios, the first case increases 100% the total emissions (scenarios of population) and the
second case reduces in 50% the total emission from motorbikes and the total emission from
buses was increased in 100% (scenarios of traffic), were evaluated on the domain of 1020km
2
.
For the first case, suppose that if the population of HCMC increases in 100%, the emissions
also will increase 2 times and the second case means that we replace the motor bicycles by
buses.
The results show that, in the first case (fig.4c), ozone concentration increases 27.76% in
the centre of HCMC (maximum 200 ppb at midday), and 56.18% (maximum 300ppb at
midday) in the South–West part of the city. In the second case (fig. 4b), the results show that
the ozone concentration is reduced until 60ppb (12h00) in the center of the city, and until
140ppb (12h00) in the South-West of the city. In general, the ozone concentration reduces 21%
and the surface influenced by the pollution of the ozone, will be reduced from 100km
2
to
28km
2
.
6. CONCLUSION
The results obtained show that the meso-scale meteorological fields depend
simultaneously on the local and global scale conditions; the wind direction is more influenced
by global scale than local phenomena. It is necessary to use the method "Nesting-one way" to
obtain more precise boundary and initial conditions
.
The emissions coming from traffic are very important among them; the motorbikes
produce serious emissions of pollutants in HCMC. The results of the simulations show that the
ozone plume is 90km in length and 30 km in width at 12h00 LT. During the selected episode,
the zone in the South - West of HCMC is the most polluted one (180ppb at midday).
Two scenarios (the first case increases 100% the total emissions, the second case reduces
in 50% the total emission from motorbikes and the total emission from buses was increased in
100%) were evaluated. In the first case, ozone concentration increases 27.76% in the centre of
HCMC (maximum 200 ppb at midday), and 56.18% (maximum 300ppb at midday) in the
South – West part of the city. In the second case, the results show that the surface influenced
by the pollution of the ozone, will be reduced from 100km
2
to 28km
2
.
Science & Technology Development, Vol 9, No.5 - 2006
Trang 72
MÔ HÌNH HÓA CHẤT LƯỢNG KHÔNG KHÍ KHU VỰC TP.HỒ CHÍ MINH -
NGHIÊN CỨU NHỮNG CHIẾN LƯỢC GIẢM THIỂU
Hồ Quốc Bằng
(1)
, , Alain Clappier
(2)
, Erika Zarate
(2)
, Hubert van den Bergh
(2)
(1) Viện MT&TN, ĐHQG-HCM
(2)
Viện Công nghệ Thụy Sĩ
TÓM TẮT: Hồ Chí Minh (HCM) là một thành phố lớn nhất của Việt Nam, là thành phố
có mật độ dân số cao đứng thứ 7 trên thế giới, bị ảnh hưởng nghiêm trọng bởi sự ô nhiễm. Các
nguồn ô nhiễm không khí chính ở Tp.HCM là giao thông, công nghiệp và sinh hoạt. Mô hình
tóan học là công cụ duy nhất có khả năng dự báo chất lượng không khí và nhờ những mô hình
này mà chúng ta tìm ra các chiến lược giảm thiểu ô nhiễm không khí cho Tp.HCM, nhiều kịch
bản khác nhau đã được nghiên cứ
u.
Kết quả nhận được chỉ ra rằng khí tượng tại Tp.HCM phụ thuộc vào khí tượng của thang
đo toàn cầu hôn thang đo địa phương. Kết quả mô phỏng chỉ rằng chùm khói ozon có kích
thước 90km chiều dài và 30 km chiều rộng. Suốt thời kỳ được chọn mô hình hoá (8/1/2003),
nồng độ ozon trung bình ở trung tâm Tp.HCM lúc 12h00 là 100ppb và nồng độ ozon cao nhất
ở phía Tây-Nam của Tp.HCM là 180ppb vào lúc 12h00.
REFERENCE
[1]. Bougeault, P., Lacarrere, P., Parameterization of orography-induced turbulence in a
mesobeta-scale model,
Monthly Weather Review 117, 1872–1890, 1989.
[2].
Clappier, A, A correction method for use in multidimensional time-splitting advection
algorithms: application to two- and three-dimensional transport
, Monthly Weather
Review 126, 232–242, 1998.
[3].
Climat Diagnostics Center (NOAA). NCEP,
/>
[4].
Couach, O., F. Kirchner, R. Jiménez, I. Balin, S. Perego, and H. Van den Bergh, A
development of ozone abatement strategies for the Grenoble area using modeling and
indicators,
Atmos. Env., 38, 1425-1436
[5].
Department of Science, Technology and Environment of HO Chi Minh city, Urban
transport energy demand and emission analysis
, Case study of HCM city. N
0
1 (phase
II), 2001.
[6].
Eggleston S., D. Gaudioso, N. Gorißen, R. Joumard, R.C. Rijkeboer, Z. Samaras and
K H. Zierock, CORINAIR Working Group on Emissions Factors for Calculating 1990
Emissions from Road Traffic. Volume 1: Methodology and Emission Factors, Final
Report, Document of the European Commission ISBN 92-826- 5571-X, 1993.
[7].
EMEP/CORINAIR, Atmospheric Emission Inventory Guidebook, Second Edition,
European Environment Agency, Technical report N° 30, Copenhagen, Denmark,
Internet reference at
[8].
Gong, W., Cho, H, A numerical scheme for the integration of the gas phase chemical
rate equations in three-dimensional atmospheric models
, Atmospheric Environment
27A, 2147–2160, 1993.
[9].
Junier, M., Kirchner, F., Clappier A. and van den Bergh, H, The chemical mechanism
generation program CHEMATA, part II: Comparison of four chemical mechanisms in a
three-dimensional meso scale simulation,
Atmos. Environ. 39, 1161-1171,2004.
TẠP CHÍ PHÁT TRIỂN KH&CN, TẬP 9, SỐ 5 -2006
Trang 73
[10]. Kuebler, J.: 2001, Integrated assessment of photochemical air pollution control
strategies: methode development and application to the Swiss plateau
, EPFL thesis No
2412.
[11].
Louis, J.F, A parametric model of vertical eddies fluxes in the atmosphere, Boundary-
Layer Meteorology 17, 187–202., 1979.
[12].
Madronich, S, TUV tropospheric ultraviolet and visible radiation model, from the
Website: , 1998.
[13].
Martilli, A., Clappier, A., Rotach, M.W., An urban surface exchange parameterization
for mesoscale models.
Boundary-Layer Meteorology 104, 261–304, 2002.
[14].
Nguyen,H.Duc, Air quality in Ho Chi Minh city, Viet Nam, New South Wales
Environment Protection Authority, from the WebSite:
/>, 2000.
[15].
Nguyen,V.Khoa;Vo,V.Dam., ().Agency Protects Environmental of
HCM.
,2003 .
[16].
Projet Mics-Asia International Institute for Applied Systems Analysis, Laxenburg,
Austria,2000.
[17].
RAINER, Friedrich., STEFAN, Reis. Emissions of Air Pollutants, Springer 333p,
2004.
[18].
Stockwell, W.R., Kirchner, F., Kuhn, M., Seefeld, S., A new mechanism for regional
atmospheric chemistry modeling,
Journal of Geophysical Research 102, 25847–25879,
1997.