Lack of tumorigenesis and protumorigenic activity of human umbilical cord mesenchymal stem cells in nod scid mice
Bạn đang xem bản rút gọn của tài liệu. Xem và tải ngay bản đầy đủ của tài liệu tại đây (1.53 MB, 7 trang )
(2022) 22:307
He et al. BMC Cancer
/>
Open Access
RESEARCH
Lack of tumorigenesis and protumorigenic
activity of human umbilical cord mesenchymal
stem cells in NOD SCID mice
Jie He1, Xiang Yao2,3, Ping Mo2,3, Kai Wang1, Zai‑ling Yang2,3, Ni‑ni Tian2,3, Xiang‑qing Zhu2,3, Jing Zhao2,3,
Rong‑qing Pang2,3, Guang‑ping Ruan2,3* and Xing‑hua Pan2,3*
Abstract
Background: The tumorigenesis of infused umbilical cord mesenchymal stem cells (UC-MSCs) is being preclinically
evaluated.
Methods: We observed tumor formation in NOD SCID mice after a single subcutaneous injection of hUC-MSCs and
the effect of these cells on tumor growth in tumor-bearing mice. Three generations (P5, P7, and P10) of hUC-MSCs
(1 × 10⁷) from two donors (hUC-MSC1 and hUC-MSC2) were inoculated subcutaneously into NOD SCID mice. Sub‑
cutaneous transplantation models were established in NOD SCID mice with human cervical cancer HeLa cells (solid
tumor) and human B cell lymphoma Raji cells (hematological tumor). Then, the animals were euthanized, gross dis‑
section was performed, and tissues were collected. Various organs were observed microscopically to identify patho‑
logical changes and tumor metastasis.
Results: In the tumorigenesis experiment, no general anatomical abnormalities were observed. In the tumor promo‑
tion experiment, some animals in the HeLa groups experienced tumor rupture, and one animal died in each of the
low- and medium-dose hUC-MSC groups. The results may have occurred due to the longer feeding time, and the
tumor may have caused spontaneous infection and death. Pathological examination revealed no metastasis to distant
organs in any group. In the Raji tumor model, some animals in each group experienced tumor rupture, and one
animal in the medium-dose hUC-MSC group died, perhaps due to increased tumor malignancy. Thus, hUC-MSCs nei‑
ther promoted nor inhibited tumor growth. No cancer cell metastasis was observed in the heart, liver, spleen, lungs,
kidneys or other important organs, except that pulmonary venule metastasis was observed in 1 animal in the model
group.
Conclusions: Injected hUC-MSCs were not tumorigenic and did not significantly promote or inhibit solid or hemato‑
logical tumor growth or metastasis in NOD SCID mice.
Keywords: Tumorigenicity and promotion, Human umbilical cord mesenchymal stem cells, Injection, Tumor growth
and metastasis
*Correspondence: ;
2
Basic Medical Laboratory, 920th Hospital of Joint Logistics Support
Force, PLA, Kunming 650032, Yunnan Province, China
Full list of author information is available at the end of the article
Background
Umbilical cord mesenchymal stem cells (UC-MSCs)
perform immunoregulatory functions and inhibit T
cell proliferation and immune responses through cell–
cell interactions and cytokine production. hUC-MSCs
can inhibit the proliferation of mitogen-stimulated
© The Author(s) 2022. Open Access This article is licensed under a Creative Commons Attribution 4.0 International License, which
permits use, sharing, adaptation, distribution and reproduction in any medium or format, as long as you give appropriate credit to the
original author(s) and the source, provide a link to the Creative Commons licence, and indicate if changes were made. The images or
other third party material in this article are included in the article’s Creative Commons licence, unless indicated otherwise in a credit line
to the material. If material is not included in the article’s Creative Commons licence and your intended use is not permitted by statutory
regulation or exceeds the permitted use, you will need to obtain permission directly from the copyright holder. To view a copy of this
licence, visit http://creativecommons.org/licenses/by/4.0/. The Creative Commons Public Domain Dedication waiver (http://creativeco
mmons.org/publicdomain/zero/1.0/) applies to the data made available in this article, unless otherwise stated in a credit line to the data.
He et al. BMC Cancer
(2022) 22:307
T lymphocytes, modulate T cell subsets to affect
cytokine secretion, and participate in other mechanisms to exert immunomodulatory effects [1]. Studies have found that long-term in vitro-cultured bone
marrow-derived mesenchymal stem cells (MSCs)
can spontaneously transform and generate tumors
[2]. Moreover, MSCs transfected with the telomerase
reverse transcriptase gene (TERT) undergo transformation. Therefore, the tumorigenicity of UC-MSCs
infused into patients has been a focus of preclinical
evaluations.
Related studies have shown that the stability of MSCs
in the tumor microenvironment is insufficient, and
tumor growth may occur partly through the recruitment of peripheral stem cells and not only through the
proliferation of the original tumor cells. Furthermore,
MSCs have multidirectional differentiation potential
and can differentiate into matrix components. In addition, chemokines and cytokines in the tumor microenvironment can induce the migration of MSCs to such
microenvironments. This MSC migration promotes
tumor stroma formation, which can lead to mutations
in tumor cells and cancerous growth in the body [3,
4]. These reports all indicate that MSCs can promote
tumor cell growth both in vivo and in vitro.
The hUC-MSCs used for injection are biological
products developed by the National and Local Joint
Engineering Laboratory of Stem Cell and Immune Cell
Biomedicine Technology. These products are intended
to be delivered via intravenous drip for the treatment of senile degenerative diseases. To evaluate the
safety of this clinical intervention, tumor incidence in
NOD SCID mice was monitored after the subcutaneous injection of hUC-MSCs to evaluate tumorigenicity, and the protumorigenic activity of hUC-MSCs was
evaluated in subcutaneous models of a solid tumor
(human cervical cancer HeLa cells) and hematological cancer (human B cell lymphoma Raji cells) in NOD
SCID mice.
In this study, the tumorigenic and tumor-promoting
effects of mesenchymal stem cells were studied from
the perspective of a preclinical safety evaluation of a
biological product. Research involving mesenchymal stem cells of different cell sources, different passages and different doses is relatively systematic and
comprehensive, basically covering all possibilities of
clinical use. This study is the most comprehensive
evaluation of the safety of mesenchymal stem cell therapy reported to date. The results can be referenced,
and the tumorigenic and tumor-promoting results in
animals are more reliable than in vitro test results.
Page 2 of 13
Methods
Materials
The hUC-MSCs used for injection were provided by
the Stem Cells and Immune Cells Biomedical Techniques Integrated Engineering Laboratory of State and
Regions at the 920th Hospital of Joint Logistics Support
Force, PLA; human embryonic lung fibroblasts (MRC5), human cervical cancer cells (HeLa), and human
B cell lymphoma cells (Raji) were purchased from the
Cell Center of the Institute of Basic Research, Chinese
Academy of Sciences. We obtained these cell lines from
the Cell Bank within 6 months. Reauthentication (STR
analysis) of cell lines (hUC-MSC1, hUC-MSC2, MRC5, HeLa, and Raji cells) is required for serially passaged cells used for more than 6 months after receipt
from an internationally recognized cell bank. All the
experiments were performed with mycoplasma-free
cells; mycoplasma screening was performed by PCR,
and these results are included in the responses to the
reviewers.
SPF-grade NOD SCID mice were purchased from
Beijing Weitong Lihua Laboratory Animal Technology Co., Ltd. under certificate numbers 0310377,
0,301,028, and 0,308,898. The animals were purchased
at 4–6 weeks of age with a weight range of 18–23 g, and
they were housed in an SPF animal room.
Methods
Identification of Surface Markers Expressed by UC‑MSCs
and Preparation for Injection
UC-MSCs were collected in the logarithmic growth
phase, washed 3 times with physiological saline,
divided into tubes (1 × 10⁶ cells per tube), and incubated with 10 μl CD105-PE, CD73-FITC, CD90-PerCPCy5.5, CD34-PE, CD45-FITC or isotype control at 4 °C
in the dark for 30 min. After washing with phosphate
buffer to remove the unbound antibodies, the expression level of the surface markers was detected with a
flow cytometer.
In the tumorigenesis experiments, UC-MSCs were
collected, centrifuged, counted, and then adjusted to
5 × 10⁷ cells/ml with serum-free DMEM/F12 culture
medium for later use.
In the tumor promotion experiment, UC-MSC suspensions of various concentrations were prepared
so that the suspension contained 1% human albumin, 1050 IU/4
× 107 cells low-molecular-weight
heparin calcium, and 2% DMSO. At cell viabilities of
80% ~ 100%, the cell concentration was 80% ~ 120% of
the labeled cell concentration. The prepared cell suspension was stored or transported in an ice box.
He et al. BMC Cancer
(2022) 22:307
Tumorigenesis experiment
NOD SCID mice were randomized into 8 groups with
10 mice each, and each group included equal numbers
of male and female mice. For the experimental groups,
the cells were derived from three generations (P5, P7,
and P10) or two batches of cells (hUC-MSC1 and hUCMSC2); HeLa cells served as the positive control, and
MRC-5 cells served as the negative control. The positive
control group was injected with 1 × 10⁶ cells/mouse,
and the other groups received 1 × 10⁷ cells/mouse. The
mice underwent 16 weeks of continuous observation
after subcutaneous inoculation into the right forelimb
axillary. Mouse body weight was measured twice a
week before and after cell inoculation, and the nodule
volume was continuously observed and measured after
cell inoculation. During the experiment, the nodules
had a tendency to diminish, so half of the animals with
nodules were euthanized before the nodules completely
disappeared, and the other half were subjected to continued observation until the nodules disappeared completely and then until the end of the 16th week of the
experiment, at which point the remaining animals were
euthanized. For animals that did not develop nodules,
half were euthanized at day 21 (D21) after inoculation,
and the other half underwent continued observation
until the end of the 16th week. All the euthanized animals were subjected to gross dissection, and the nodules or tissues at the inoculation site were harvested for
histopathological examination.
Thirty-two animals were selected and randomly
divided into 4 groups with 8 animals each: the negative
control group, low-dose hUC-MSC group (1 × 10⁷ cells/
kg), medium-dose hUC-MSC group (2 × 10⁷ cells/kg),
and high-dose hUC-MSC group (4 × 10⁷ cells/kg). hUCMSCs were injected via tail vein. The cells were administered by tail vein injection once each in weeks 1, 3, and
5, for a total of 3 injections. At the end of the experiment,
gross dissection of all animals was carried out; the main
organs, including the heart, liver, spleen, lungs, kidneys,
and brain, were examined for whether there is tumor formation. The tumorigenesis potential of MSCs administered via tail vein injection was evaluated.
Tumor promotion experiment
HeLa and Raji cells (0.2 ml, 5
× 107 cells/ml) were
injected subcutaneously into NOD SCID mice to establish a xenograft tumor model, and tumor-bearing animals that exhibited vigorous growth, no ulceration, and
good health were selected. Tumors were collected under
aseptic conditions, and tumor masses of 1.5–3 mm3 were
subcutaneously inoculated into the right axillary region
of NOD SCID mice. After inoculation, tumor growth was
Page 3 of 13
monitored. When the average tumor volume reached
50–100 mm3, the tumor size was monitored. Animals
with tumor volumes that were too large and those without tumors were not selected for further experiments.
Thirty-two model animals with each tumor cell line
were selected and randomly divided into 4 groups with
8 animals each: the model group, low-dose hUC-MSC
group (1 × 10⁷ cells/kg), medium-dose hUC-MSC group
(2 × 10⁷ cells/kg), and high-dose hUC-MSC group
(4 × 10⁷ cells/kg). The cells were administered by tail
vein injection once each in weeks 1, 3, and 5, for a total
of 3 injections. The HeLa cell groups were observed for
56 days after the first injection, and the Raji cell groups
were observed for 37 days. General physiological indicators, including the animal’s mental state, behavior, and
food intake, were observed every day. The long diameter,
short diameter and weight of the tumor were measured
and recorded twice a week, the tumor volume was calculated, and the tumor growth curves were compared
between the groups. The relative tumor volume (RTV)
was calculated as RTV = Vt/V0, where Vt is the current tumor volume, and VO is the initial tumor volume.
The relative tumor proliferation rate (T/C%) was calculated as T/C% = average RTV of the treatment group/
average RTV of the control group × 100%. T/C% ≤ 40%
with P
<
0.05 indicated statistically significant tumor
growth inhibition, T/C%
≥
140% indicated increased
tumor growth, and 40% < T/C% < 140% indicated neither
promoted nor inhibited tumor growth. After observation, the animals were anaesthetized with pentobarbital
sodium, blood was collected, and the animals were euthanized. The tumor nodules were dissected and weighed.
The tumor weight of each group was measured to calculate the tumor inhibition rate IRTW (%) = (W model
group-W treatment group)/W model group × 100%. At
the end of the experiment, gross dissection of all animals was carried out; the main organs, including the
heart, liver, spleen, lungs, kidneys, and brain, were examined for metastasis, and histopathological examination
of the abovementioned tissues and tumor nodules was
conducted.
Statistical analysis
SPSS 26.0 statistical software was used to perform statistical analysis on the weight, nodule volume, organ weight,
and organ coefficient of different groups of animals. The
data are expressed as the mean ± standard deviation
(x ± s) For nodule volume, only the average of each group
is presented, and no statistical analysis was required. Specific analysis was carried out according to the following
procedure: Levene’s test was used to test the homogeneity of variance. If there was no statistical significance
(P > 0.05), one-way analysis of variance (ANOVA) was
He et al. BMC Cancer
(2022) 22:307
Page 4 of 13
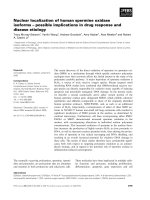
Fig. 1 Histopathological examination of the inoculation site of NOD SCID mice injected with hUC-MSCs (HE staining, 10 ×). A Animals in Group
1 were euthanized, and no obvious abnormalities were seen at the inoculation site. B Animals in Group 2 were euthanized, and tumor nodules
with central necrosis were observed at the inoculation site. C–H Animals in Groups 3, 4, 5, 6, 7, and 8 were euthanized. The stem cell mass at the
inoculation site was necrotic, and the surrounding tissues exhibited fibroblastic proliferation accompanied by lymphocyte infiltration
used for statistical analysis. If ANOVA suggested statistical significance (P ≤ 0.05), Dunnett’s test (parametric
method) was used for comparative analysis. If the variance was not uniform (P ≤ 0.05), the Kruskal–Wallis test
was used. If the Kruskal–Wallis test suggested statistical
significance (P ≤ 0.05), then the Mann–Whitney method
was used for pairwise comparisons between means.
Results
Identification of surface markers of UC‑MSCs
Antibody-labeled cells were shown to have high expression of CD105, CD73, and CD90 and low or no expression of CD45 and CD34 by flow cytometry. These results
met the criteria for identifying mesenchymal stem cells
by surface marker expression (see Supplementary Figure
S1).
Results of the tumorigenicity experiment
General clinical observation
During the observation period, all the mice were in a
good mental health and exhibited normal behaviors. The
animal weights showed continuous growth. There was
no significant difference in the animal weight between
the groups (P > 0.05). On D55, tumors began to appear
in 6 animals in the positive control group. Ulceration
gradually worsened, and all the animals in this group
were euthanized on D61. The animal weight data are
shown in Table S1 of the Supplementary Materials.
Clinical and histological observations of subcutaneously
injected nodules
Negative control group (group 1): After cell inoculation,
no obvious nodules were seen at the injection site. Half
of the animals were euthanized 21 days after inoculation,
and no abnormalities in various organs or tissues were
observed during the gross autopsy. Microscopic examination revealed that injected cells remained in one animal; there were 2 lymphocyte nodules at the injection
site, accompanied by fibroblast proliferation nodules. The
remaining half of the animals were observed until the end
of the 16th week, at which point they were euthanized.
There was no nodule growth at the inoculation site or
in the surrounding tissues of these animals. The nodule
volume data are shown in Table S2 of the Supplementary Materials. The microscopic examination showed no
abnormalities (Fig. 1A).
Positive control group (group 2): Starting on D8 after
cell inoculation, nodules gradually appeared at the inoculation site and increased in size. By D61, most animals
(7/10) had nodules over 20 mm in diameter, which were
He et al. BMC Cancer
(2022) 22:307
Page 5 of 13
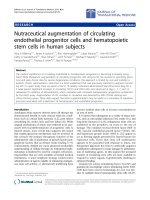
Fig. 2 Changes in nodule growth after hUC-MSC inoculation. A Graph of nodule growth in the hUC-MSC1 group after treatment. Compared with
the negative control group, the hUC-MSC1-P5, hUC-MSC1-P7, and hUC-MSC1-P10 groups showed no significant difference in nodule growth. B
Graph of nodule growth in the hUC-MSC2 group after treatment. Compared with the negative control group, the hUC-MSC2-P5, hUC-MSC2-P7, and
hUC-MSC2-P10 groups showed no significant difference in nodule growth
classified as tumors. All the animals in this group developed tumors and ulceration. Considering animal welfare,
all the animals in this group were euthanized. The gross
autopsy showed nodules on the right side of the armpit
in all 10 animals, but no abnormalities in organ structure
were observed. The microscopic examination of axillary
nodules revealed these to all be tumor nodules. For the
statistical analysis of the nodules, see Table S2 of the Supplementary Materials. No abnormalities were detected in
the microscopic examination (Fig. 1B).
hUC-MSC1 groups (group 3: P5, group 4: P7, and
group 5: P10): No obvious nodules were observed at the
injection site after cell inoculation. At D5, all 10 animals in each group had nodules at the inoculation site.
These nodules gradually decreased in size, and half of
the animals (5/10) were euthanized before the nodules
disappeared on D11. Gross examination revealed no
abnormalities in various organs or tissues. Microscopic
examination of the hUC-MSC1-P7 group revealed 1 animal with local fibrous tissue proliferation accompanied
by lymphocyte infiltration, but the animals showed no
abnormalities. The remaining half of the animals continued to be observed; all the nodules disappeared by D17,
and observation continued until the end of 16 weeks,
when the animals were euthanized. During this period,
no nodules were seen at the inoculation site or the surrounding area. The statistical analysis of nodules is
shown in Supplementary Material Table S2. The nodule
growth trends in the hUC-MSC1 groups and the positive
control group are shown in Fig. 2A. Gross anatomical
observation showed no nodules at the inoculation site
and no abnormalities in various organs or tissues; moreover, microscopic evaluations revealed no local abnormalities at the inoculation site (Fig. 1C, D, E).
hUC-MSC2 groups (group 6: P5, group 7: P7, and
group 8: P10): No obvious nodules were seen at the injection site after cell inoculation. At D5, all 10 animals in
each group had nodules at the inoculation site; these
nodules gradually decreased in size, and on D11, half of
the animals (5/10) were euthanized before the nodules
disappeared. There were no gross anatomical abnormalities in organs or tissues, and local stem cell clusters were
observed by microscopy in only 2/5 animals. These 2
mice also showed mass necrosis and the proliferation of
surrounding fibrous tissue, which was accompanied by
lymphocyte infiltration; however, no abnormalities were
observed in the remaining animals. Observation continued for the remaining animals in each group. By D17, all
the nodules disappeared. Observation continued until
the end of the 16th week, at which point the animals were
euthanized. During this period, no nodules were seen
at the inoculation site or elsewhere. The nodule volume
data are shown in Table S2 of the Supplementary Materials. Nodule growth in the hUC-MSC2 groups and the
positive control group is shown in Fig. 2B. Gross anatomical observation showed no nodules at the inoculation
site and no abnormalities in various organs or tissues,
and microscopic analysis revealed no local abnormalities
at the inoculation site (Fig. 1F, G, H).
He et al. BMC Cancer
(2022) 22:307
Page 6 of 13
Intravenous injection tumorigenic test results
The anatomical and pathological examination results
of the whole body of 32 animals are shown in Table 1.
There was no tumor formation in the heart, liver, spleen,
lungs, kidneys, and brain and other major organs. Conclusion: hUC-MSCs were transplanted intravenously had
no tumor formation in the low, medium and high dose
groups. It indicated that hUC-MSCs are safe by intravenous infusion.
Results of the tumor promotion experiment
Effect on HeLa cell tumor growth
Most of the animals were in good mental condition,
with little changes in body weight. There were no significant differences in body weight between each
experimental group and the model group (P > 0.05). No
animals died in the model group, but tumor rupture
occurred in 4 animals on D39.
Low-dose hUC-MSC group (1 × 10⁷ cells/kg): One
animal died suddenly on D44, and no obvious gross
anatomical abnormalities were observed. On D29, 4
animals successively developed tumor ulceration.
Medium-dose hUC-MSC group (2
× 107 cells/kg):
Medium-dose hUC-MSC group (2 × 10⁷ cells/kg): The
tumor nodules grew steadily, and the average tumor volume at D57 was 2316.22 m
m3, which was 31.44 times
larger than the initial tumor volume (RTV: 31.44 ± 7.47).
Compared with the model group, this group showed no
significant difference (P > 0.05).
High-dose hUC-MSC group (4 × 10⁷ cells/kg): The
tumor nodules grew steadily, and the average tumor
volume on D57 was 2625.85 mm3, which was 43.17
times larger than the initial tumor volume (RTV:
35.99 ± 9.38). The difference between this group and
the model group was not significant (P > 0.05). There
was no significant difference in average tumor volume
at each time point between the high-dose and lowdose groups (P > 0.05), indicating no significant dosedependent effects in these experiments.
The tumor volume data are shown in Table S4 of
the Supplementary Materials, and the growth trend is
shown in Fig. 3.
The relative tumor proliferation rate (T/C%) was
determined by comparing the average RTV of each
group with that of the model group. Tumor growth
inhibition was indicated by T/C% ≤ 40% and P < 0.05,
Table 1 Intravenous injection tumorigenic test results
Dose
heart
liver
spleen
lungs
kidneys
brain
1 × 10⁷ cells/kg
No tumor seen
No tumor seen
No tumor seen
No tumor seen
No tumor seen
No tumor seen
2 × 10⁷ cells/kg
No tumor seen
No tumor seen
No tumor seen
No tumor seen
No tumor seen
No tumor seen
4 × 10⁷ cells/kg
No tumor seen
No tumor seen
No tumor seen
No tumor seen
No tumor seen
No tumor seen
One animal died suddenly on D29 with no obvious
gross abnormalities. On D18, 3 animals successively
developed tumor ulceration.
High-dose hUC-MSC group (4 × 10⁷ cells/kg): No
animals in this group died, but tumors ruptured in 2
animals on D43.
For weight data, see Table S3 of the Supplementary
Materials.
After the first experimental cell injection, the long and
short tumor diameters were measured twice a week, and
the tumor volume (V) and RTV (Vt/V0) were calculated.
The following results were recorded.
Model group: The tumor nodules grew steadily. The
average tumor volume at D57 (euthanasia) was 3028.58
mm3, yielding an RTV of 40.26 ± 7.01.
Low-dose hUC-MSC group (1 × 10⁷ cells/kg): Tumor
nodules grew steadily, and the average tumor volume on
D57 was 2839.68 mm3, yielding an RTV of 43.17 ± 15.82.
This group showed no significant difference compared
with the model group (P > 0.05).
whereas T/C% ≥ 140% indicated tumor growth promotion; results of 40% < T/C% < 140% indicated neither an
oncogenic nor inhibitory effect.
The results were as follows:
Low-dose hUC-MSC group (1 × 10⁷ cells/kg): T/C%
reached the maximum value of 110.69% on D4 and the
minimum value of 91.12% on D11; the value on D57
was 107.23%.
Medium-dose hUC-MSC group (2
× 107 cells/kg):
T/C% reached the maximum value of 97.99% on D4 and
the minimum value of 74.69% on D11; the value on D57
was 78.11%.
High-dose hUC-MSC group (4 × 10⁷ cells/kg): T/C%
reached the maximum value of 120.30% on D8 and the
minimum value of 89.39% on D57.
The results showed that the T/C5 values for the hUCMSC treatment groups were 40% < T/C% < 140% during the entire experiment, indicating that hUC-MSCs
were not oncogenic or tumor suppressive in animals
injected with 1 × 10⁷, 2 × 10⁷, or 4 × 10⁷ HeLa cells/kg.
He et al. BMC Cancer
(2022) 22:307
Page 7 of 13
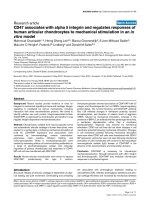
Fig. 3 Changes in tumor volume in each HeLa group. There were no significant differences between the low-, medium- and high-dose hUC-MSC
groups and the model group. This result indicated that low, medium and high doses of hUC-MSCs did not significantly promote or inhibit the
growth and metastasis of HeLa cell-derived tumors
Tumor-bearing mice showed neither an increase nor a
decrease in tumor growth.
The RTV and T/C% data are shown in Tables S5 and
S6 of the Supplementary Materials.
At the end of the experiment (D57), the animals were
euthanized, the tumors were dissected and weighed,
and the average tumor weight in each group was calculated and compared.
The average tumor weights in the model, low-dose
hUC-MSC (1 × 10⁷ cells/kg), medium-dose hUC-MSC
(2 × 10⁷ cells/kg), and high-dose hUC-MSC groups
(4 × 10⁷ cells/kg) were 2.455 g, 2.349 g, 2.082 g, and
2.491 g, respectively; there were no significant differences
in average tumor weight between the model group and
the hUC-MSC groups (P > 0.05).
The IRTW was calculated based on the average tumor
weight in each group; the values were 4.30%, 15.19%,
and -1.45% in the low-dose (1 × 10⁷ cells/kg), mediumdose (2 × 10⁷ cells/kg), and high-dose hUC-MSC groups
(4 × 10⁷ cells/kg), respectively.
The tumor weight data are shown in Table S7 of the
Supplementary Materials.
Gross anatomical observations revealed no abnormalities in the animals that experienced sudden death (one in
the low-dose group and one in the middle-dose group).
Inoculated tumor nodules with a diameter of approximately 2 cm were observed in the armpits of animals
scheduled for euthanization, and no obvious abnormalities were observed in the remaining animals.
Among the animals that died in the low-dose group,
there was moderate (+ +) neutrophil and monocyte
infiltration in the epicardium, moderate liver congestion,
extensive (+ + + +) mononucleosis in the spleen, extensive necrosis of renal tubules, and tumor nodules in the
axilla. Most of the tissue sections were necrotic.
In the dead animals in the middle-dose group, necrosis was primarily observed in the center of axillary tumor
nodules.
The histopathological changes in the organ tissues of
the animals that died in the low-dose group suggested
severe systemic infection, acute inflammation of the
epicardium, enhanced spleen function, and increased
mononuclear cell numbers; liver congestion was caused
by the death of animals without bleeding, and due to the
severe infection, bacterial toxins caused extensive renal
tubule necrosis, resulting in kidney failure and death.
The central area of the axillary tumor was necrotic due
to ischemia and hypoxic due to rapid growth. Additionally, the dead animal in the medium-dose group exhibited
no abnormal changes in organs, and the cause of death
was unknown. The general anatomical and pathological
results are shown in Figs. 4 and 5.