coal gasification and its applications
Bạn đang xem bản rút gọn của tài liệu. Xem và tải ngay bản đầy đủ của tài liệu tại đây (11.84 MB, 411 trang )
COAL GASIFICATION
AND ITS
APPLICATIONS
DAVID A BELL
BRIAN F TOWLER
MAOHONG FAN
Amsterdam • Boston • Heidelberg • London • New York • Oxford
Paris • San Diego • San Francisco • Singapore • Sydney • Tokyo
William Andrew is an imprint of Elsevier
William Andrew is an imprint of Elsevier
The Boulevard, Langford Lane, Kidlington, Oxford OX5 1GB, UK
30 Corporate Drive, Suite 400, Burlington, MA 01803, USA
First edition 2011
Copyright Ó 2011 Elsevier Inc. All rights reserved.
No part of this publication may be reproduced, stored in a retrieval system or transmitted in any form
or by any means electronic, mechanical, photocopying, recording or otherwise without the prior
written permission of the publisher
Permissions may be sought directly from Elsevier’s Science & Technology Rights Department in
Oxford, UK: phone (+44) (0) 1865 843830; fax (+44) (0) 1865 853333; email: permissions@elsevier.
com. Alternatively you can submit your request online by visiting the Elsevier web site at http://
elsevier.com/locate/permissions, and selecting Obtaining permission to use Elsevier material
Notice
No responsibility is assumed by the publisher for any injury and/or damage to persons or property as
a matter of products liability, negligence or otherwise, or from any use or operation of any methods,
products, instructions or ideas contained in the material herein. Because of rapid advances in the
medical sciences, in particular, independent verification of diagnoses and drug dosages should be made
British Library Cataloguing in Publication Data
A catalogue record for this book is available from the British Library
Library of Congress Cataloging-in-Publication Data
A catalog record for this book is available from the Library of Congress
ISBN: 978-0-8155-2049-8
For information on all William Andrew publications
visit our web site at books.elsevier.com
Printed and bound in Great Britain
111213141510987654321
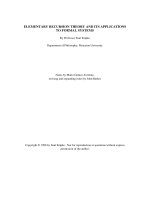
This is a book about coal gasification and its related technologies. The relationship
between these technologies is shown in Figure 0.1. The gasification process begins with
a viable feedstock. In this book, we focus on one of those feedstocks that must go
through the gasification process, coal. The nature of coal, including its properties and
availability, are described in Chapter 1. Petcoke, petroleum coke, a solid, high-carbon
byproduct of petroleum refining, can also be gasified. Gasifiers designed for coal,
especially high temperature, entrained flow gasifiers, are used for this application.
Biomass gasification has a great deal in common with coal gasification, but biomass
gasifiers are optimized for biomass feedstock.
The product of gasification is syngas, which is primarily a mixture of carbon
monoxide and hydrogen. Most syngas, however, is not currently made by gasification,
but rather by the steam reforming of natural gas. In this process, steam and natural gas are
fed to catalyst-packed tubes, which are held inside a furnace to provide the endothermic
heat of reaction. Figure 0.1 also shows other gases, which can be blended with syngas for
further processing. One such gas under consideration is hydrogen, which can be
produced by electrolyzing water using off-peak power from a nuclear power plant. In
a few cases, carbon dioxide from an external source may supplement the carbon
monoxide in syngas.
Just as coal is not the only feedstock for gasification, gasification is not the only use of
coal. Most coal is burned to produce electric power. Chapter 2 describes a few of the
non-gasification uses of coal.
Gasification is described in Chapters 3, 4, and 5. Chapter 3 describes gasification as
a chemical reaction system. Although this chapter may look complex, our knowledge of
the chemistry of gasification is far from complete. Chapter 4 covers several gasifier designs.
These designs were selected because they are now in commercial use or development, or
because they illustrate interesting concepts. One gasification approach is sufficiently
different that it deserves its own chapter, underground coal gasification, covered in
Chapter 5. Instead of mining coal and transporting it to a gasifier, the coal is left in place
underground, and the reactant gases are brought to the coal. Deeply buried coal seams,
which are uneconomic to mine, may be exploited by underground coal gasification.
Syngas leaving the gasifier contains numerous impurities. The inorganic fraction of
the feedstock leaves as solid ash or molten slag. Ash or slag removal is usually an integral
part of the gasifier design. If the gasification occurs at relatively low temperatures, then
tar will be produced. Tar removal is also an integral part of gasifier design. Higher-
temperature gasifiers do not produce significant tar. The syngas also contains sulfur in the
ix
form of H
2
S, with lesser quantities of COS. Sulfur must be removed from syngas either
to prevent emission of SO
2
when syngas is burned, or to prevent catalyst poisoning in
downstream reactors. Sulfur removal is described in Chapter 6.
Carbon dioxide removal can occur either as a part of impurity removal, or after water
gas shift, as shown in Figure 0.1. The traditional carbon dioxide removal techniques are
closely related to sulfur removal, and are described in Chapter 6. The ability to remove
carbon from syngas and sequester it in a geological formation is one of the major
attractions of coal gasification. This allows coal to be used while minimizing g reenhouse
gas emissions. A major objection to this approach is that carbon capture and sequestration
are expensive. This prompted a great deal of research into new carbon dioxide separation
technologies, and which is described in Chapter 10.
Syngas contains a number of minor impurities, and one of the more significant is
mercury, a neurotoxin. Removal of mercury is discussed in Chapter 9.
For some applications, a nearly pure hydrogen stream is desired. In others, such as
methanol synthesis, a specific ratio of carbon monoxide to hydrogen is required. In either
coal petcoke biomass
natural
gas
other
gas
Feedstocks
gasification
steam
reforming
Gasification
impurity
removal
water gas
shift
CO
2
removal
steam
sequestration
Syngas
processing
hydrogen,
electric
power
ammonia,
nitrogen
fertilizers
methanol,
dimethyl ether,
hydrocarbons
Products
substitute natural gas,
Fischer-Tropsch
hydrocarbons
Figure 0.1 Gasification and related technologies.
x
Introduction
case, the gasifier usually produces a higher ratio of carbon monoxide to hydrogen than
desired. This ratio needs to be shifted towards a greater hydrogen content. The usual way
to do this is through the water gas shift reaction in which carbon monoxide reacts with
steam to form hydrogen and carbon dioxide, as described in Chapter 7. Hydrogen can
then be burned in a turbine to generate electric power, an application known as inte-
grated gasification combined cycle. This is a means of producing electric power from
coal with minimal greenhouse gas emissions.
Hydrogen is also a potential transportation fuel. The usual approach is to produce
electric power from hydrogen in a fuel cell, and then use that power in an electric motor.
One of the main technical obstacles is a practical means of storing hydrogen in a vehicle.
Chapter 9 explores hydrogen storage for this application.
Nearly all synthetic nitrogen chemicals start as ammonia, synthesized from hydrogen
and nitrogen gas. Nitrogen fertilizers are, by far, the largest volume synthetic nitrogen
chemicals. Chapter 11 describes ammonia synthesis and some of the more common
nitrogen fertilizer compounds.
Methanol is a major commodity chemical made from syngas, as described in
Chapter 12. Methanol is an intermediate used to make a wide range of products. One of
these, dimethyl ether (DME), is especially interesting. DME can be used as a fuel or
converted to hydrocarbons, including gasoline and olefins for polymer production.
Chapter 13 describes the direct conversion of syngas to hydrocarbons, including
substitute natural gas (methane) and Fischer-Tropsch liquid, a synthetic crude oil. The
Fischer-Tropsch liquid is then refined to meet petroleum product specifications.
Coal is an inexpensive feedstock, but gasification-based plants tend to have very high
capital construction costs. In concept, one could build a single plant that would
incorporate all of the elements shown in Figure 0.1, but such a complex plant would be
extraordinarily expensive to build. Instead, gasification-based plants have a more limited
set of features dictated by economics and the regulatory environment.
There are two major trends that prompt current interest in coal gasification. The first
is the widely held belief that conventional petroleum supplies are declining, while
demand for transpor tation fuels continues to rise. This has led to heightened interest in
alternative energy supplies, including coal. The second major trend is concern about
global warming. Gasification offers a relatively cost-effective means of using coal while
minimizing greenhouse gas emissions.
Introduction xi
CHAPTER
1
1
The Nature of Coal
Contents
The Geologic Origin of Coal 1
Coal Analysis and Classification 2
Coal Rank 4
Ash Thermal Properties 5
Coal as a Porous Material 9
Spontaneous Combustion 10
Reserves, Resources, and Production 11
References 15
THE GEOLOGIC ORIGIN OF COAL
Coal is fossilized peat. A peat bog is a marsh with lush vegetation. Plant matter dies and
falls into the water, where partial decomposition occurs. Aerobic bacteria deplete the
water of oxygen, and bacterial metabolic products inhibit further decomposition by
anaerobic bacteria. Plant matter accumulates on the marsh bottom faster than it
decomposes, and, over a period of many years, a layer of peat forms. The peat that
became today’s coal was laid down millions of years ago.
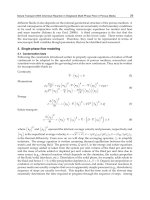
Buried peat is converted to coal when high pressure and elevated temperature is
applied to the buried layer. This process is known as coalification. The physical and
chemical structure of the coal changes over time. As shown in Figure 1.1, the youngest
(least converted) coal is known as lignite, which can be further converted to sub-bitu-
minous coal, bituminous coal, and finally anthracite. These coal types strongly influence the
properties and use of coal, and will be discussed further.
Peat
Lignite
Sub-bituminous
Bituminous
Anthracite
Increasing
age,
conversion
Figure 1.1 Coalification.
Coal Gasification and Its Applications. Ó 2011 Elsevier Inc.
ISBN B978-0-8155-2049-8.10001-4, doi:10.1016/B978-0-8155-2049-8.10001-4 All rights reserved.
1
Petrography is the visual inspection of a rock sample to determine the mineral types in
the sample. When applied to coal, the different coal types are known as macerals. Ta ble
1.1 lists coal macerals, and shows how they are derived from plant material.
COAL ANALYSIS AND CLASSIFICATION
Coal is used primarily as a fuel, so its most important property is its heat of
combustion. Gross calorific value, also known as higher heating value (HHV), is determined
by measuring the heat released when coal is burned in a constant-volume calorimeter,
with an intitial oxygen pressure of 2 to 4 MPA, and when the combustion products are
cooled to a final temperature between 20 and 35
C (ASTM D 5865-04). The tests
mentioned in this book are primarily based on the American Society for Testing and
Materials (ASTM) specifications.
1
Coal is a variable, widely distributed and widely
used material so a wide range of standard tests have been developed by a variety of
individuals and organizations.
Coal is a porous medium, and these pores, especially in low rank coals, can contain
substantial quantities of water even though the coal appears to be dry. The water is either
adsorbed onto hydrophilic surface sites or held in pores by capillary forces. When this
moist coal is burned or gasified, a substantial fraction of the combustion heat is required
Table 1.1 Coal macerals, based on ASTM D121-05 and ASTM D 2799-05a.
1
Maceral
group Maceral Origin Comments
Vitrinite Vitrinite Woody tissue of plants (cellulose,
lignin)
Most common maceral
Liptinite Alginite Botryoccus algae Waxy, resinous
materialsCutinite Waxy coating (cuticle) of leaves, roots
and stems
Resinite Plant resins
Sporinite Spores and pollen grains
Inter tite Fusinite Some structures of plant cell wall still
visible
Derived from strongly
altered and degraded
peatInertodentrinite Fragments incorporated within other
macerals.
Macranite No plant cell wall structure, larger than
10
m
m
Micranite No plant cell wall structure, less than 10
m
m, and typically 1 to 5
m
m
Funginite Fungi
Secretinite No obvious plant structure, sometimes
containing fractures, slits or notch.
Semifusinite Like fusinite, but with less distinct
evidence of cellular structure.
2 The Nature of Coal
to vaporize water. Since the final temperature in the gross calorific value test is 20 to
35
C, most of the water is condensed, thereby recovering the heat of vaporization.
Water in the HHV test is primarily a non-combustible diluent. For example,
a Wyoming Powder River Basin coal typically has an HHV of 19.8 MJ/kg (8500
Btu/lb) and a 28% moisture level. One can then calculate an HHV value for the coal if
it is dried:
HHV ; dry ¼
19:8 MJ=kg
1 À0:28
¼ 27:5
MJ
kg
11; 800
Btu
lb
Eqn. 1.1
If coal is burned or gasified near atmospheric pressure, then the heat of condensation
for the water may not be recovered. For example, in a coal-fired power plant, the water
contained in the coal may go up the stack as steam. In other situations, the heat of
condensation is recovered, but the value of this heat is relatively low because of its
temperature. In these cases, a better estimate of coal heat of combustion is the net calorific
value, also known as Lower Heating Value (LHV), which assumes that vaporized water
remains as steam and that the heat of condensation is not recovered. Water in the coal
reduces its heating value by its heat of vaporization, 2.395 MJ/kg water (1055 Btu/lb
water). Again, for a typical PRB coal:
LHV ; moist ¼
19:8 MJ
kg coal
À 2:395
MJ
kg water
à 0:28
kg water
kg coal
¼ 19:1
MJ
kg coal
8; 200
Btu
lb coal
Eqn. 1.2
Proximate Analysis (ASTM D 3172-89) involves a series of tests that heat and burn
coal. Moisture is measured (ASTM D 3173-03) by determining the weight loss after
coal is dried at 104 to 110
C. Volatiles are then measured (ASTM D 3175-02) by
determining additional weight loss when c oal is pyrolyzed at 950
C. Ash is deter-
mined (ASTM D 3174-04) by the weight o f inorganic materials remaining after coal
is burned. Fixed carbon is the frac tion of c oal that is not moisture, volatiles, or ash.
Fixed carbon, which is mostly carbon but can contain other elements represents the
combustible portion of the coal char that remains after the volatiles have been
removed.
Proximate analysis results are sometimes reported on a dry mineral matter-free basis.
Mineral matter is calculated using the following equation:
Mm ¼ 1:08A þ0:55S Eqn. 1.3
Where: Mm ¼ percent mineral matter
A ¼ percent ash
S ¼ percent sulfur (ASTM D 3177 or D 4239)
The Nature of Coal 3
The 1.08 factor presumes that minerals in the coal are hydrated. This water of hydration
is lost when the coal is burned. The 0.55 factor assumes that sulfur is present as pyrites,
which in many areas are converted to the corresponding oxides during combustion.
Ultimate analysis (ASTM D 3176) describes coal in terms of its elemental composi-
tion. For a dried coal, weight percentages of carbon, hydrogen, nitrogen, sulfur, and ash
are measured. The remainder of the coal sample is assumed to be oxygen.
COAL RANK
In the coalification process, the coal rank increases from lignite to anthracite, as shown in
Figure 1.1. Coal rank is useful in the market, because it is a quick and convenient way to
describe coal without a detailed analysis sheet. A more detailed description of coal rank is
shown in Tables 1.2 and 1.3.
Bituminous and sub-bitumous coals are the primary commercial coals. A relatively
small amount of anthracite is available. In the USA, anthracites are produced only in north-
eastern Pennsylvania. Lignites are abundant. But the economics of hauling a low-grade
fuel long distances are unfavorable; so most lignite is consumed close to where it is mined.
Peat is also mined and generally used close to where it is mined. Peat may be either
considered old biomass or very young coal. In nations that regulate greenhouse gas
emissions, the difference between the two is more than mere semantics. Carbon dioxide
emissions from biomass combustion are not considered a contributor to global warming,
because these emissions are offset by carbon dioxide uptake by growing biomass. On the
other hand, the same emissions from fossil fuels, are restricted. Emissions from peat
combustion are a regulatory gray area.
Some coal, particularly bituminous coal, has the tendency to cake. With increasing
temperature, coal particles simultaneously pyrolize and partially melt, causing the coal
particles to stick to one another. Some gasification reactors, especially moving bed and
fluidized bed gasifiers, are limited to processing coal that does not cake.
Table 1.2 Classification of anthracitic and bituminous coals by rank (ASTM D 388-05).
1
Rank
Fixed carbon limits
(dry mineral-matter-free basis), %
Volatile matter limits
(dry mineral-matter-free
basis), %
Equal or
greater than
Less
than
Greater
than
Equal or
less than
Meta-anthracite 98 n/a n/a 2
Anthracite 92 98 2 8
Semi-anthracite 86 92 8 14
Low volatile bituminous coal 78 86 14 22
Medium volatile bituminous coal 69 78 22 31
High volatile A bituminous coal n/a 69 31 n/a
4 The Nature of Coal
ASH THERMAL PROPERTIES
The melting temperatures of coal ash impose temperature limits for coal gasification.
Fluidized bed gasifiers and dry-bottom moving bed gasifiers, such as the Lurgi gasifier,
require free-flowing ash. The maximum operating temperature for these gasifiers is the
initial deformation temperature. When the temperature rises above the initial defor-
mation temperature the ash becomes sticky. Fluidized bed gasifiers often run near the
initial deformation temperature to maximize carbon conversion.
Entrained flow gasifiers and slagging moving bed gasifiers such as the BGL gasifier
require a fluid slag, so they must operate at a sufficiently high temperature to comp-
letely melt the ash. Operation at significantly higher temperatures increases oxygen
consumption.
Ash is a complex mixture of minerals, which will cause the coal ash to melt over
a temperature range rather than at a fixed temperature. Temperatures in this range are
specified by ASTM D-1857-04. A coal ash cone, 19 mm high and with an equilateral
triangle base 6.4 mm on each side, is placed in an oven. Temperatures are reported for
reducing or oxidizing gas environments. The initial deformation temperature (IDT) occurs
when rounding of the cone tip first occurs. The softening temperature (ST) occurs when
the cone has fused to produce a lump which has a height equal to its base. The hemi-
spherical temperature (HT) occurs when the lump height is half the length of its base. The
fluid temperature occurs when the fused mass has spread out in a nearly flat layer with
a maximum height of 1.6 mm.
A number of researchers have attempted to correlate ash thermal properties with
ash composition. The most extensive effort was by Seggiani and Pannocchia,
2
who
correlated the behavior of 433 ash samples, based on nine elemental concentrations.
Table 1.3 Classification of bituminous, sub-bituminous and lignite coals by rank. (ASTM D 388-05).
Note that high volatile A bituminous coal is the only rank that is listed in both Table 1.2 and Table 1.3.
Rank
Gross calorific value limits
(moist, mineral-matter-free basis)
Btu/lb MJ/kg
Equal or
greater than
Less
than
Equal or
greater than
Less
than
High volatile A bituminous coal 14 000 n/a 32.557 n/a
High volatile B bituminous coal 13 000 14 000 30.232 32.557
High volatile C bituminous coal 11 500 13 000 26.743 30.232
Sub-bituminous A coal 10 500 11 500 24.418 26.743
Sub-bituminous B coal 9 500 10 500 22.09 24. 418
Sub-bituminous C coal 8 300 9 500 19.30 22.09
Lignite A 6 300 8 300 14.65 19.30
Lignite B n/a 6 300 n/a 14.65
The Nature of Coal 5
Note that mineral elemental compositions are reported as if the mineral sample were
a blend of simple metal oxides. For example, the fraction of aluminum in a sample is
typically reported as the equivalent weight percent of Al
2
O
3
. Seggiani and Pannocchia’s
correlations are based on mole percents, rather than weight percents, on a normalized,
SO
3
-free basis.
The correlation for initial deformation temperature is given as:
IDT;
C ¼ 2; 040 exp
0:1
SiO
2
SiO
2
þ Fe
2
O
3
þ CaO þMgO
2
þ 83:4P
2
O
5
þ 2:12 Al
2
O
3
þ 39:3TiO
2
þ 0:335 ðFe
2
O
3
Þ
2
þ 0:118 ðAl
2
O
3
Þ
2
þ 0:135 ðCaOÞ
2
À 0:116 ðSiO
2
ÞðFe
2
O
3
Þþ0:0768 ðSiO
2
ÞðAl
2
O
3
Þ
þ 0:533 ðFe
2
O
3
ÞðCaOÞþ2:42
SiO
2
Al
2
O
3
2
þ 205
SiO
2
SiO
2
þ Fe
2
O
3
þ CaO þMgO
2
þ 780 exp
10
À4
ðSiO
2
ÞðAl
2
O
3
Þ
À 2170
Eqn. 1.4
The correlation for softening temperature is given as:
ST;
C ¼ 5; 360 exp
0:1
SiO
2
SiO
2
þ Fe
2
O
3
þ CaO þ MgO
2
þ 91:3 P
2
O
5
þ 0:282 ðFe
2
O
3
Þ
2
þ 0:178 ðCaOÞ
2
þ 0:939ðMgOÞ
2
þ 0:630 ðFe
2
O
3
Þ
ÂðCaOÞÀ1:03 ðFe
2
O
3
ÞðMgOÞþ2:34
SiO
2
Al
2
O
3
2
À 140
SiO
2
SiO
2
þ Fe
2
O
3
þ CaO þ MgO
2
À 85:9
CaO þ MgO
Fe
2
O
3
þ CaO þMgO þK
2
O þ Na
2
O
3
þ 3; 120 exp
10
À4
ðSiO
2
ÞðAl
2
O
3
Þ
À 7820
Eqn. 1.5
6 The Nature of Coal
The correlation for hemispherical temperature is given as:
HT;
C ¼ 2; 150 exp
0:1
SiO
2
SiO
2
þ Fe
2
O
3
þ CaO þMgO
2
þ 53:1 TiO
2
À 25:3K
2
O þ 16:0 ðTiO
2
Þ
2
þ 0:0877 ðCaOÞ
2
þ 19:3
Fe
2
O
3
CaO
þ 0:285
SiO
2
Al
2
O
3
2
þ 910exp
0:1
Fe
2
O
3
þ CaO þMgO þK
2
O þ Na
2
O
SiO
2
þ Al
2
O
3
þ TiO
2
þ P
2
O
5
À 1
2
þ 41:9
Fe
2
O
3
þ CaO þMgO þK
2
O þ Na
2
O
SiO
2
þ Al
2
O
3
þ TiO
2
þ P
2
O
5
2
þ 86:4
Fe
2
O
3
þ CaO þMgO þK
2
O þ Na
2
O
SiO
2
þ Al
2
O
3
þ TiO
2
þ P
2
O
5
À 1
2
þ 216
SiO
2
SiO
2
þ Fe
2
O
3
þ CaO þMgO
2
À 2; 120
Eqn 1.6
The correlation for fluid temperature is given as:
FT;
C ¼ 2; 240 exp
0:1
SiO
2
SiO
2
þ Fe
2
O
3
þ CaO þMgO
2
þ 6:13Al
2
O
3
þ 58:0TiO
2
À 13:8MgO þ0:259 ðFe
2
O
3
Þ
2
þ 0:278 ðAl
2
O
3
Þ
2
þ 0:736 ðMgOÞ
2
þ 0:259 ðFe
2
O
3
ÞðCaOÞÀ0:730 ðFe
2
O
3
ÞðMgOÞ
þ 2:03
SiO
2
Al
2
O
3
2
þ 92:0
Fe
2
O
3
þ CaO þMgO þK
2
O þ Na
2
O
SiO
2
þ Al
2
O
3
þ TiO
2
þ P
2
O
5
2
þ 231
SiO
2
SiO
2
þ Fe
2
O
3
þ CaO þMgO
2
À 1; 340
Eqn. 1.7
The temperature of critical viscosity, T
cv
, is not part of the ASTM D1857 test but
it is important for slagging gasifiers because it marks the transition of slag from a
The Nature of Coal 7
difficult-to-handle Bingham plastic, below T
cv
, to a more easily handled Newtonian
fluid, above T
cv
. The correlation for temperature of critical viscosity is given as:
T
cv
;
C ¼À935P
2
O
5
þ 4:11Al
2
O
3
þ 2; 580ðP
2
O
5
Þ
2
þ 0:254ðAl
2
O
3
Þ
2
À 0:139ðNa
2
OÞ
2
þ 0:108 ðSiO
2
ÞðFe
2
O
3
Þþ0:0377 ðSiO
2
ÞðAl
2
O
3
Þ
þ 14:0
SiO
2
Al
2
O
3
þ 3:05
SiO
2
Al
2
O
3
2
þ 0:00691
Fe
2
O
3
þ CaO þMgO
þ K
2
O þ Na
2
O
2
þ 7:40
Fe
2
O
3
þ CaO þ MgO þK
2
O þ Na
2
O
SiO
2
þ Al
2
O
3
þ TiO
2
þ P
2
O
5
À 113
Fe
2
O
3
þ CaO þ MgO þK
2
O þ Na
2
O
SiO
2
þ Al
2
O
3
þ TiO
2
þ P
2
O
5
2
À 5:48 ðNa
2
OÞ
Fe
2
O
3
þ CaO þ MgO þK
2
O þ Na
2
O
SiO
2
þ Al
2
O
3
þ TiO
2
þ P
2
O
5
À 164
Fe
2
O
3
Fe
2
O
3
þ CaO þ MgO þK
2
O þ Na
2
O
À 7:40
Fe
2
O
3
þ CaO þ MgO þK
2
O þ Na
2
O
SiO
2
þ Al
2
O
3
þ TiO
2
þ P
2
O
5
À 1
þ 409 exp
10
À4
ðSiO
2
ÞðAl
2
O
3
Þ
þ 675
Eqn. 1.8
Seggiani and Pannocchia report standard deviations for their correlations to be 70 to
88
o
C. Table 1.4 compares experimental results for four American coals from Baxter
3
to
the temperatures predicted by these correlations. The predicted results are very close to
the experimental results for the lignite and the sub-bituminous coals. The exception is
the predicted temperatures are substantially higher than the experimental values for the
bituminous coals.
Inorganic additives have been added to coal gasifiers to modify ash thermal prop-
erties. For example; alkaline materials such as sodium, potassium and calcium
compounds tend to lower ash melting temperatures. These can be added to an entrained
flow gasifier to lower slag viscosity. Care must be taken with refractrory-lined gasifiers,
because these compounds may attack the refractory. The opposite approach was taken by
van Dyk and Waanders.
4
They sought to increase the ash fusion temperature (ISO 540
and 1195E) to allow higher temperature operation in a Lurgi gasifier. Tests with Al
2
O
3
,
TiO
2
, and SiO
2
showed that Al
2
O
3
was most effective. Addition of 6 weight % Al
2
O
3
boosted the ash fusion temperature of a mixture of South African coals from 1,340
Cto
greater than 1,600
C.
8 The Nature of Coal
Ash is typically land-filled. If the landfill is unlined, then water percolating through
the ash pile may affect surface and groundwater quality. Many ashes are alkaline and there
is the possibility that toxic heavy metals in the ash may be leached by rainwater. Slagging
gasifiers produce glassy, non-leachable slag.
Some coal ashes are pozzolanic, which means that they tend to set up like cement
when mixed with water. These ashes are often used as road base. High calcium ash has an
analysis that is similar to commercial cement. Pozzolanic ashes are less likely to pose
leachate problems than unconsolidated ashes.
COAL AS A POROUS MATERIAL
Coal is a porous material.
5
Pores are classified as macropores (greater than 50 nm), which
are measured using mercury porosimetry, mesopores (2.0 to 50 nm), measured by nitrogen
adsorption at 77 K, and micropores (0.4 to 2.0 nm), measured by carbon dioxide
adsorption at 298 K. Micropores are due to the voids from imperfect packing of large
organic molecules. Coals typically have surface areas in the range of 100 to 400 m
2
/g,
Table 1.4 Coal ash thermal properties: comparison of experimental values to values predicted by the
Seggiani and Pannocchia correlations.
Coal rank Beulah lignite
Wyodak sub-
bituminous
Pittsburgh No. 8
bituminous
Illinois No. 6
bituminous
Mineral
Mole
weight
Weight
%
Mole
%
Weight
%
Mole
%
Weight
%
Mole
%
Weight
%
Mole
%
Al
2
O
3
101.94 13.968 12.666 14.218 11.562 20.657 17.262 16.904 13.348
CaO 56.08 16.358 26.963 24.845 36.725 2.085 3.167 5.180 7.435
Fe
2
O
3
159.70 12.249 7.090 5.450 2.829 29.238 15.596 20.671 10.419
K
2
O 94.20 0.220 0.216 0.198 0.175 1.742 1.576 2.031 1.735
MgO 40.32 4.457 10.219 4.363 8.970 0.786 1.660 0.798 1.593
Na
2
O 61.99 6.501 9.694 0.872 1.166 0.403 0.554 1.302 1.691
P
2
O
5
141.96 0.001 0.001 1.009 0.589 0.1151 0.091 0.167 0.095
SiO
2
60.06 21.227 32.671 26.537 36.627 41.696 59.140 46.854 62.794
TiO
2
79.90 0.415 0.480 1.309 1.358 0.896 0.956 0.883 0.890
Total 73.395 100.00 78.801 100.00 97.653 100.00 94.790 100.00
IDT,
C, exp. 1,108 1,183 1,047 1,060
IDT,
C, calc. 1,061 1,187 1,189 1,180
Error,
C À47 þ4 þ142 þ120
HT,
C, exp. 1,176 1,212 1,082 1,090
HT,
C, calc. 1,177 1,281 1,400 1,342
Error,
C þ1 þ69 þ318 þ251
FT,
C, exp. 1,199 1,253 1,222 1,253
FT,
C, calc. 1,220 1,229 1,467 1,421
Error,
C þ21 À25 þ244 þ168
The Nature of Coal 9
which is due almost entirely to micropores. For comparison, a typical atomic diameter is
0.25 nm, so only small molecules may penetrate micropores. Olague and Smith
6
studied
gas diffusion in coal.
SPONTANEOUS COMBUSTION
Coal oxidizes when it is exposed to oxygen at ambient conditions. Low grade coals are
especially prone to low temperature oxidation. The effect of long-term air exposure on
coal quality is known as weathering. Oxidation at low temperatures is exothermic,
resulting in increased temperatures that accelerate the rate of coal oxidation. This
sometimes leads to spontaneous combustion of coal.
Itay et al.
7
studied low temperature oxidation of South African coal. They found that
the quantity of oxygen adsorbed was greater than the quantity of oxygen-containing
product gasses (CO
2
,CO,H
2
O), so most of the adsorbed oxygen remains in the coal.
Other investigors
8,9
found an increase in carboxylic acids in weathered coal. Itay et al.
found that oxygen uptake with repeated oxygen exposures declines. This same effect is
shown in Figure 1.2
10
. Small particles tend to oxidize faster than large particles, but the
particle size effect is not large. This suggests that the rate of oxidation is limited by oxygen
diffusion in coal micropores or by surface reaction rates.
As-mined low grade coals typically have high water content, and the water-filled
pores tend to block low tempe rature oxi dation. As shown in Equation 1.1, the heat
content of these coals can be greatly increased by drying. Unfortunately, the d ry coals
cannot be safely stored or shipped under ambient conditions due to their tendency to
spontaneously combust. Exposure o f dry coals to high humidity or liquid water
Figure 1.2 Low temperature oxidation of about 1.5 g dried, sub-bituminous, Adaville coal from
Kemmerer, Wyoming in a microcalorimeter
10
. Note that the heat released diminishes with repeated
oxygen exposures.
10
The Nature of Coal
accelerates the rate of low-temperature oxidation, possibly because water adsor ption
on coal is exothermic. Processes have been developed
11,12
to convert high moisture,
low grade coals to low moisture fuels with reduced spontaneous combustion
tendencies.
RESERVES, RESOURCES, AND PRODUCTION
Throughout history coal has played a very small role in the world’s energy mix. Locally
it was a curiosity because it was an interesting rock that could be made to burn.
However, commencing in about the year 1500, it began to be mined for small scale
energy use in England and Germany. When the Industrial Revolution dawned in
England in the eighteenth century coal became a significant energy source that fueled
the English factories that were the hallmark of the Industrial Revolution. However, in
terms of total energy use biomass (particularly wood) remained the major source of
energy for the world until about 1900, when coal overtook biomass as the chief world
energy source. In the United States, where coal was abundant and easier to mine, it
had become the chief energy source in about 1880. Throughout the first half of the
twentieth centur y coal was the major world energy source, until it was overtaken by oil
in about 1960. Even though coal production has continued to increase since then it
remains in second place behind oil and just ahead of natural gas. This is illustrated in
Figure 1.3.
In the near future it is likely to remain in the second position until oil production
peaks and starts to decline. It is conceivable that when this happens coal will again
Figure 1.3 World energy sources since 1800.
The Nature of Coal 11
become the most consumed energy source in the world. In terms of energy reserves
the world has much more coal than any other energy source. Some might argue that
coal production will be restricted because of the amount of CO
2
that it produces. But
as we learn to capture and sequester the CO
2
economically, coal production will likely
continue to increase.
The entire quantities o f coal present, regardless of the cost or practicality of
recovery, are known as resources. A 5 cm thick layer of low quality coal buried under
2000 m of overburden con tribut es to to ta l resources, but it is unlikely that it will ever be
mined. A more practical measure of the quantities of coal available are known as reserves,
which is the subset of resources that can be mined at current prices using current
technology. There are an estimated
13
275 billion tons of coal reserves in the United
States, compared to approximately 4 trillion tons of coal resources. Table 1. 5 shows
estimates of world wide reserves, recent annual production and reserve/production (R/
P) ratios, w hich is the number of year s these reserves will la st at current production
levels.
14
Table 1.5 Worldwide coal production and reserves.
14
Region and selected
countries
2006 coal production,
million short tons
2003 coal reserves,
million short tons
Reserves/production,
years
United States 1,161.44 270,718 233
North America 1,243.47 279,506 225
Columbia 70.22 7,287 104
Central and South
America
86.55 21,928 253
Germany 222.74 7,428 33
Greece 72.37 4,299 59
Poland 171.12 15,432 90
Turkey 71.51 4,614 65
Europe 799.27 65,572 82
Kazakhstan 106.17 34,479 325
Russia 340.61 173,074 508
Former USSR 534.21 250,694 469
Iran 0.94 462 491
Middle East 0.94 462 491
South Africa 269.37 53,758 200
Africa 274.93 55,486 202
Australia 419.58 86,531 206
China 2,620.50 126,215 48
India 497.18 101,903 205
Indonesia 186.25 5,476 29
Asia and Oceania 3,842.16 327,264 85
World 6,781.53 1,000,912 148
12 The Nature of Coal
It does not mean that the world will run out of coal in the next 148 years. For
example, Luppens, et al.
15
studied coal reserves and resources in the Gillette Coal
Field, a 5,180 km
2
portion of the 57,000 km
2
Powder River Basin in northeastern
Wyoming and southeastern Montana. Coal is abundant throug hout the Powder River
Basin, but mining is restricted to coal with the lowest mining cost. Most mining in
the basin occurs within the Gillette Coal Field, where thick coal se ams lie close to the
surface. There are multiple coal beds and the thickest of these, the Anderson, has an
average 15 m thickness. The beds dip slightly from east to west, so coal is produced
from 13 strip mines along a 78 km northesouth line along the east ern edge of the
district. These 13 mines produced over 42% of the coal produced in the USA in
2007.
14
Because of the abundance of this coal, and because of its low mining cost, the open
market mine mouth price
14
for this sub-bituminous coal in 2007 was $9.67/ton;
compared to $47.63/ton for bituminous coal from West Virginia. As shallow coal in the
Gillette Coal field is depleted, mining moves to the west, with gradually increasing
overburden and gradually increasing mining cost. When the overburden becomes too
thick for strip mining, underground mining may be used to further extract coal. Luppens
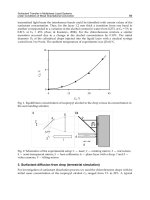
et al. estimated the volume of coal available in the Gillette Coal Field versus price, and
these data are shown in Figure 1.4. At the 2008 production rate of 464 million tons/year,
the coal reserves in the Gillette Coal Field will last only 21 years if coal is priced at $10/
ton. If the price of coal rises to $60/ton, then the coal will last 176 years at the 2008
production rate. Of course, the Gillette Coal Field is only one mining district, amongst
many scattered throughout the world. As mining costs in the Gillette Coal field rise,
mining will shift to other portions of the Powder River Basin and to other coal prov-
inces. On a worldwide basis, coal will be available for a very long time, but coal prices are
expected to gradually increase due to increasing mining costs.
$0
$10
$20
$30
$40
$50
$60
0 10,000 20,000 30,000 40,000 50,000 60,000 70,000 80,000
Coal Cost, $/ton
Coal reserves, millions of tons
Figure 1.4 Coal reserves versus cost in the Gillette Coal Field.
15
The Nature of Coal 13