Assignment 2 tcs18005 le vo hong ngoc 1641
Bạn đang xem bản rút gọn của tài liệu. Xem và tải ngay bản đầy đủ của tài liệu tại đây (1.87 MB, 28 trang )
lOMoARcPSD|10228358
Assignment 2 TCS18005 Le Vo Hong Ngoc 1641
Information Technology (FPT University)
Studocu is not sponsored or endorsed by any college or university
Downloaded by Nguyen Minh Duc (FGW HCM) ()
lOMoARcPSD|10228358
Assessment Brief
Student Name/ID
Number
Unit Number and Title
14: Business Intelligence
Academic Year
2018
Unit Tutor
Assignment Title
Assignment 2: Apply BI tools & techniques and their
impact
Issue Date
Submission Date
IV Name & Date
Submission Format
Part I: Project submission. This should be a zip / rar folder of your project, including all
necessary files to run your project. There should be a link to your Tableau work on Tableau
Public cloud.
Part II: The submission is in the form of a group written report. This should be written in a
concise, formal business style using single spacing and font size 12. You are required to
make use of headings, paragraphs and subsections as appropriate, and all work must be
supported with research and referenced using the Harvard referencing system. Please also
provide a bibliography using the Harvard referencing system.
Part III: Team needs to present their point of view about how business intelligence tools can
contribute to effective decision-making as well as the legal issues involved in exploiting user
data for business intelligence. You may need to research for specific examples of
organizations that use BI tools to enhance or improve their business and evaluate how they
can use BI tools for extend their target audience and make them more competitive within
the market.
Downloaded by Nguyen Minh Duc (FGW HCM) ()
lOMoARcPSD|10228358
Unit Learning Outcomes
LO3 Demonstrate the use of business intelligence tools and technologies
Assignment Brief
(Continued from previous scenario)
Your next task is to demonstrate to the board of directors about the ability of applying
business intelligence in the company's current business processes. To demonstrate BI, you
need to prepare a presentation about BI and related tools & techniques and a demonstration
on real company dataset.
For the presentation, you need:
-
Explain general concept of what is BI
Introduction to some tools / techniques for BI and their application in general
For the demonstration, you need:
-
A (some) data set(s) extracted from the company's business processes. Explain the dataset.
Show how you pre-process data for later analysis, explain each step and it purpose
Design dashboards to show your analysis on pre-processed data. Explain clearly purpose of dashboards and
charts. Suggestions should be made after analysis
During the demonstration, you need collect feed-back and comments from users to review
how well your dashboards design meet user or business requirement and what customization
needed for future use.
Team needs to present their point of view about how business intelligence tools can contribute
to effective decision-making as well as the legal issues involved in exploiting user data for
business intelligence. You may need to research for specific examples of organizations that
use BI tools to enhance or improve their business and evaluate how they can use BI tools for
extend their target audience and make them more competitive within the market.
To summary, you need to submit a report in PDF includes 4 parts: your presentation, result
of demonstration and review of user feedback, point of view on BI contribution and legal
issues.
HNC/HND Computing 3
Downloaded by Nguyen Minh Duc (FGW HCM) ()
lOMoARcPSD|10228358
Learning Outcomes and Assessment Criteria
Pass
Merit
Distinction
LO3 Demonstrate the use of business intelligence tools and
technologies
P3 Determine, with examples,
what business intelligence is and
the tools and techniques
associated with it.
M3 Customise the design to ensure
that it is user friendly and has a
functional interface.
P4 Design a business
intelligence tool, application
or interface that can perform a
specific task to support problemsolving or decision-making at an
advanced level.
LO4 Discuss the impact of business intelligence tools and technologies
for effective decision-making purposes and the legal/regulatory
context in which they are used
P5 Discuss how business
intelligence tools can contribute
to effective decision-making.
P6 Explore the legal issues
involved in the secure
exploitation of business
intelligence tools
M4 Conduct research to identify
specific examples of organisations
that have used business
intelligence tools to enhance or
improve operations.
D3 Provide a critical review
of the design in terms of
how it meets a specific user
or business requirement
and identify what
customisation has been
integrated into the design.
D4 Evaluate how
organisations could use
business intelligence to
extend their target audience
and make them more
competitive within the
market, taking security
legislation into consideration
HNC/HND Computing 4
Downloaded by Nguyen Minh Duc (FGW HCM) ()
lOMoARcPSD|10228358
Introduction
Tasks
From assignment 1 we continue to present the ability to apply business intelligence in the company's current
business processes. This 2 Assignment you will have company review data written by customers over
5,000,000 records. Your mission is to use BI power to demonstrate smart business applications with data. When
you receive user reviews, you'll need to write an app review report based on user feedback as well as your
reviews. Discuss the ability to apply business intelligence to the company itself (besides what the demo
application did). Management also needs to know about legal issues related to the exploitation of user data for
smart businesses.
P3 Determine, with examples, what business intelligence is and the tools and techniques associated
with it.
What is Business Intelligence?
BI (Business Intelligences) is a series of rules, ideas, and ideas for changing the data of the real world with the
idea of success. Business partners have a need for help.
The dynamics will continue to reach the business guidelines and be effective and relevant in the business. Be
sure to make the decision based on the actual situation using the method of changing the format.
Real-time BI customers benefit from a wide range of products, creating a wide range of clothes, a lot of clothes,
a lot of clothes, and what you believe. For companies and businesses.
Techniques associated with BI.
Microsoft - Power BI
Microsoft, Bill Gate's renowned software company with Windows operating systems, has also developed
Power BI systems for handling data display. almost for free, Microsoft Power BI continues to expand and
adds many new features almost every month.
Microsoft has built Power BI with 2 types:
Web version.
Version on personal computer, named Microsoft Power BI Personal.
Tableau
The tableau deskop tool is a fully developed name in the data analysis and display software market. Because
of this, Tableau desktop has become a symbol, symbolically meaningful for analyzing and visualizing data.
HNC/HND Computing 5
Downloaded by Nguyen Minh Duc (FGW HCM) ()
lOMoARcPSD|10228358
Tool tableau deskop Includes 3 main products:
Software to build display graphs - Tableau desktop.
Server sharing data tables - Tableau server.
Online data sharing chart system - Tableau online.
Qlik
Software analysis data display Qlik Sense Enterprise Server is a fairly new product but very fast
development in the technology industry displays graphs and data analysis. Qlik has entered the group of
leading software in terms of 2 vision and excellence in product quality.
Qlik Sense Enterprise Server can run on a personal computer or online virtual machine platform.
Qlik Sense Enterprise Server can serve the needs of the company from small to medium excellent
Main components of a BI system:
Data sources: raw data from different sources such as HRM, CRM, e-commerce website, ...
Data warehousing: is the organization's long-term data store.
Integrating Server: is responsible for operating the ETL tool to convert data from Data Sources to
Data Warehouse.
Analysis Server: where to receive input data to return results based on predefined business knowledge.
The Reporting Server: executes reports with output received from Analysis Server.
Data Mining: is the process of extracting processed data information, this stage is quite important!
Data Presentation: reports, charts from the data mining process created from here.
Examples of Business Intelligence:
Our company, NESTLÉ Every day we touch billions of lives. We want to help shape a better and
healthier world for individuals and families, for our communities and for the planet. Our stories take a
deeper look at how NESTLÉ is making a difference. And my company operates for more than 150
years. In order to compete in the industry, I must have a suitable business strategy to help NESTLÉ
company make better decisions in the future. It helps the branch manager determine which customers
buy the most Food & Brand. From there I will hit hard on the item, for example, my company has many
people who like many product. because that makes my brand. I knew that strong point thanks to BI,
and I developed it stronger. The use of BI tools to develop companies and create more bold strategies
HNC/HND Computing 6
Downloaded by Nguyen Minh Duc (FGW HCM) ()
lOMoARcPSD|10228358
and analyze each part of the company. And from that data, the director will decide the company's
competitive position in different markets. By analyzing these trends year by year, month by month, and
day by day, the management team will give discounts to Food & Brand.
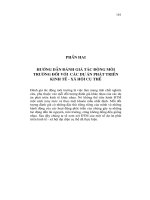
And I will use Power BI to authenticate, I will use NESTLÉ data to assess which items are the hottest.
Figure 1: NESTLÉ business chart
From the above values, I will see clearly that what items are most weak to people, how to evaluate
people about the item, how much positive reviews are.
HNC/HND Computing 7
Downloaded by Nguyen Minh Duc (FGW HCM) ()
lOMoARcPSD|10228358
When I want any item that is most interested. For example, I want to see how much Blouses stands in the total
number of items. And how much is it worth when the reviews are positive. We can customize many tools and
customize our design.
P4 Design a business intelligence tool, application or interface that can perform a specific task to support
problem-solving or decision-making at an advanced level. & M3 Customise the design to ensure that it
is user friendly and has afunctional interface.
HNC/HND Computing 8
Downloaded by Nguyen Minh Duc (FGW HCM) ()
lOMoARcPSD|10228358
Extract file excel into power BI
To push data from Excel File into, at the File Menu, We choose Get Data => Excel. For Data Source is File
Excel, PowerBI has only one type of data connection: Import the entire Data Source content into the
Desktop PowerBI.
Figure 2: Extract file excel
Select the downloaded Excel File, click Open
Figure 3:Open to open file
HNC/HND Computing 9
Downloaded by Nguyen Minh Duc (FGW HCM) ()
lOMoARcPSD|10228358
Select the data sheet to use, click Load and wait a moment for the data to be loaded into PowerBI
Figure 4:Load to import file
In the left toolbar, go to the Data section to see the data imported.
HNC/HND Computing 10
Downloaded by Nguyen Minh Duc (FGW HCM) ()
lOMoARcPSD|10228358
Figure 5:See the data imported
In this example, we will create a simple chart showing the Total Revenue rating.
We switch to the Report section. In the right toolbar, in the Visualizations section, select Clustered Column
Chart. A blank chart was created.
HNC/HND Computing 11
Downloaded by Nguyen Minh Duc (FGW HCM) ()
lOMoARcPSD|10228358
Figure 6:Clustered Column Chart
In Fields, we choose Rating, Value is Total Revenue and Region. PowerBI will create a corresponding chart
HNC/HND Computing 12
Downloaded by Nguyen Minh Duc (FGW HCM) ()
lOMoARcPSD|10228358
Figure 7: Clustered column chart
An interesting point of PowerBi is that we can interact with the Chart created. We can left click on each color,
corresponding to each product to highlight the information of just one selected product.
HNC/HND Computing 13
Downloaded by Nguyen Minh Duc (FGW HCM) ()
lOMoARcPSD|10228358
Data View & Relationship View in BI
Data View helps you observe, explore and understand specific data in the database. It is different when you
look at tables, columns (Column) and data in Query Editor. With Data View, you observe the data after it
has been uploaded and have created data constraints (Relationship).
When you design data, sometimes you need to observe the actual results in tables and columns, exactly to
the actual data in each line. This is absolutely necessary when creating columns that contain new data after
calculating or defining each column data type.
HNC/HND Computing 14
Downloaded by Nguyen Minh Duc (FGW HCM) ()
lOMoARcPSD|10228358
Figure 8:Data View
1. Data View Icon: Select to switch to data view
2. Data Grid: Displays data (all rows and columns) of the selected table. Note: If you observe a gray
column, it is the hidden columns in Report View. You can right-click that column to change options.
3. Modeling Ribbon - Manage data constraints (relationship), create calculations, change data types,
format (data types) for each column.
4. Search: Search for tables or columns in your project.
5. Field List: Select the table and column to view in the Data Grid.
Relationship View
Show all tables (Table), columns (Column) and data relationships (Relationship). This section is useful
when you design complex databases or have multiple relationships between tables in the database.
HNC/HND Computing 15
Downloaded by Nguyen Minh Duc (FGW HCM) ()
lOMoARcPSD|10228358
Figure 9:Relationship
Using Line chart in BI
Step 1: Prepare the data file
Step 2: Select the icon
HNC/HND Computing 16
Downloaded by Nguyen Minh Duc (FGW HCM) ()
lOMoARcPSD|10228358
Figure 10:Line chart
Step 3: Drag and drop the values to be displayed into the properties.
Axis: Region,... depending on your reporting purposes.
Value: Total Revenue.
Just as the line chart shows by the lines, shows us the increase and decrease of revenue.
HNC/HND Computing 17
Downloaded by Nguyen Minh Duc (FGW HCM) ()
lOMoARcPSD|10228358
Figure 11:Line chart
In this chart, I do not use the Legend attribute because it will not work to show your chart is lively or even
a bit confusing. Note: If you combine with the Drill Down feature, you will get the effect of this attribute.
However, I will still try to use this attribute so that you can better visualize: I drag and drop the Provider
name on both Axis and Legend properties, as you can see, we have 5 suppliers so there will be 5
corresponding points. For a small number, you can clearly see each point (small dot) that corresponds to
the supplier, but if you have 100 suppliers, can you still distinguish each supplier? ! See the picture below:
HNC/HND Computing 18
Downloaded by Nguyen Minh Duc (FGW HCM) ()
lOMoARcPSD|10228358
Figure 12:Line chart
Remember, I just tried drawing so you could imagine why I didn't use the Legend attribute in this case.
However, in the following case, you can use:
HNC/HND Computing 19
Downloaded by Nguyen Minh Duc (FGW HCM) ()
lOMoARcPSD|10228358
Figure 13:Completed line chart
However, if there are too many product groups, you will be slightly confused. So with this type of chart, it
is not always possible to use Legend attribute, it should be used only when the data shows little.
From the above methods, I will now design myself with the company's data NESTLÉ.
This is a data file from the F&B company, looking at the data we see is the Item type of each product,
Country, Order Date, Region, Sales Chanel, Review test is my feeling when buying something in this
company, rating , Total Cost, Total Profit, Total Revenue, . And we will use power BI to look at reviews,
charts, and power BI to see what positive reviews are for (Total Revenue)?
HNC/HND Computing 20
Downloaded by Nguyen Minh Duc (FGW HCM) ()
lOMoARcPSD|10228358
Figure 14: F&B of NESTLÉ
P5 Discuss how business intelligence tools can contribute to effective decision-making
Introduction: BI simply says it is a software tool used by people to analyze an organization's raw data to
make smart decisions for business and business success. BI is that it includes data mining, online analytics
processing, queries and reports The purpose of a smart business system is to provide entrepreneurs with
tools and methods that enable them to make effective and Timely decision.
Effective decisions.
Applying sophisticated analytical methods allows decision makers to rely on more reliable information and
knowledge. Thus, they can make better decisions, set appropriate policies and achieve their goal more
effectively. Indeed, the shift to formal annalytical methods forces decision maker to clearly describe both
HNC/HND Computing 21
Downloaded by Nguyen Minh Duc (FGW HCM) ()
lOMoARcPSD|10228358
criteria for evaluating alternatives. Futher in-depth testing and subsequent thinking lead to deeper
awareness and a better understanding of the basic logic of decision making.
Timely Decisions
Enterprises operate in economic environments characterized by growing levels of opposition and high
vitality. As a consequence, the ability to quickly react to the actions of participants and to new market
conditions is a critical factor in the success or even the survival of a company.
Figure 7 demonstrates the major benefits that a given organization may draw from the acceptance of a
business intelligence system. When facing problems such as those described in decision makers ask
themselves a series of questions and develop the corresponding analysis. Hence, they examine and compare
several options, selecting among them the best decision, given the conditions at hand.
If decision makers can rely on a business intelligence system facilitating their activity, we can expect that
the overall quality of the decision-making process will be greatly improved. With the help of mathematical
models and algorithms, it is actually possible to analyze a larger number of alternative actions, achieve
more accurate conclusions and reach effective and timely decisions. We may therefore conclude that the
major advantage deriving from the adoption of a business intelligence system is found in the increased
effectiveness of the decision-making process.
Figure 17:Benefits of a business intelligence system.
Source:
HNC/HND Computing 22
Downloaded by Nguyen Minh Duc (FGW HCM) ()
lOMoARcPSD|10228358
As observed above, a vast amount of data has been accumulated within the information systems of public
and private organizations. These data initiate partly from internal operation of an administrative, logistical
and business-related nature and partly from external sources. However, even if they have been gathered
and stored in a methodical and structured way, these data cannot be used directly for decision-making
purposes. They need to be processed by means of suitable taking out tools and analytical methods capable
of transforming them into information and knowledge that can be afterward used by decision makers.
So how does it help your company?
Foresee the trend.
Power BI software, tracking company processes, and making market trend forecasts. This data is analyzed
along with a set of information, including market data. That will make your business foreseeable. For
example, customers' needs to buy clothes rather than accessories
Create goals that can be done.
Market analysis that ignores internal factors will not bring good results for your company. A leader of his
business must capture what growth is in the field. To help a company set effective goals, BI will report to
your business situation, creating opportunities for businesses to new strategies in the next market.
Take advantage of the data.
BI, through automated systems, will reduce the risks of human error and fraud in creating false information,
bring the trust of decision makers and lead to a prosperous environment. and more reliable.
Conclusion: BI it provides yourself with information that can make decisions. KPIs are summarized with
designs to forward the state of their measures. by putting discipline into a strategic model. By having
managers, finance and executives focus on analyzing information instead of collecting and processing
information, these solutions provide organizations with agility that is more flexible thereby creating create
business opportunities and optimize resources and link strategic goals to operational plans
P6 Explore the legal issues involved in the secure exploitation of business intelligence tools.
Data it is often characterized by large volumes of data, it is very diverse and rich. Data can come from
many different sources, such as social media, online shopping, data from licensed Facebook. Data is created
by everything around us anytime, anywhere. Data comes from many sources with high speed, volume, and
complexity. Analysis capabilities are needed to extract information that can be executed from large data.
Businesses need to analyze converting large and complex data into information to make better decisions.
Big data analysis is the process of collecting, organizing and analyzing data to discover different useful
information. Big data analysis can help businesses better understand information in data, and Determine
which data helps your business improve the efficiency of decisions.
HNC/HND Computing 23
Downloaded by Nguyen Minh Duc (FGW HCM) ()
lOMoARcPSD|10228358
The legal department today must integrate problem management, electronic reporting systems and to
maximize the effectiveness of their data.
Legal issues.
Privacy policy
The law and regulations are focused on the best and the utmost confidence. Introduce, great website,
service, it is a great way to use and maintain a lot of people. By using or using the service. There are federal
and state laws and regulations that apply to certain types of personal information, such as financial or health
information. There is also a consumer protection law that has been used to prohibit unfair or deceptive
practices related to disclosure and security procedures to protect personal information.
The first step is to be sure that the rules are good and the people are comfortable with the situation that he
or she is or not and not This is applied to the fact that you have a lot of information and that you are aware
of it.
Commercial committee law is a consumer protection law that prohibits unfair or deceptive acts and applies
to data security and online privacy policies.
The law also requires the operator to comply with the privacy policy.
Control over Data.
Ownership for data can be competitive because data control data owners can be used and shared. Data
ownership due to analysis is also important. Data rights are often allocated in security and TOS policies for
websites, online services and mobile applications. Traditional signed agreements can be used in business
to do business transactions
For example:
A signed agreement can be used between an IoT provider and their customer in an intelligent business
application.22 Joint ownership is an intermediary platform for allocating ownership in a number of
businesses. for business transactions.
Intellectual property protection
Some data analysis software is patented after alice court decision. The invention steps will be necessary to
make the software data patented. Such patents may lose their value over time because the algorithm may
improve compared to the description in patent and patent application needed.
HNC/HND Computing 24
Downloaded by Nguyen Minh Duc (FGW HCM) ()
lOMoARcPSD|10228358
Terms of service agreement
The TOS is a legal agreement established to limit the use of websites, mobile applications or online
services. The TOS includes provisions that reduce the risk of complaints from users and others. The TOS
may also include the scope of permitted use, limited activity, content disclaimer, compensation, term and
termination, copyright and other intellectual property rights, regulatory law, jurisdiction, dispute resolution
and other issues.
Conclusion:
Privacy rules and privacy for personal information around the world. Collection, use and sharing of
personal information must be in accordance with applicable privacy policies and laws and regulations. The
TOS and other agreements are used to establish rules for other Big Data ownership and control and to
minimize risks.
M4 Conduct research to identify specific examples of organisations that have used business intelligence
tools to enhance or improve operations.
Power BI is trusted by Satya Nadella CEO and top managers at Microsoft.
Power BI is Microsoft's first product released when satya CEO accepted the position in 2014. It has become
a close and close tool for him as well as all employees in the company.
Figure 18:James Phillips tại Data Insights Summit 2017
The idea of power BI is very simple, meaning that I will take data from the excel spreadsheet to mix them
all into one in the form of charts and graphs, contributing to help businesses see the panorama of task.
HNC/HND Computing 25
Downloaded by Nguyen Minh Duc (FGW HCM) ()