Wind power plants for low rated wind speed regions feasibility analysis and simulation of a system
Bạn đang xem bản rút gọn của tài liệu. Xem và tải ngay bản đầy đủ của tài liệu tại đây (1.34 MB, 4 trang )
E3S Web of Conferences 10 , 00034 (2016)
DOI: 10.1051/ e3sconf/20161000034
SEED 2016
Wind Power Plants for Low Rated Wind Speed Regions: Feasibility
Analysis and Simulation of a System
Mehmet Numan Kaya1,a and Faruk Köse2
1
Karamanoglu Mehmetbey University, Mechanical Engineering Department, Karaman, Turkey
Selcuk University, Mechanical Engineering Department, Konya, Turkey
2
Abstract. The use of wind power has become an important and growing part of the electrical energy supply in many
countries all over the world. Wind turbines are the main components of wind power stations and every single
development on these turbines affects the market. Latest developments in wind turbine technologies caused
to decrease in costs, thus, besides high-wind-speed regions, low-wind-speed regions are taken into account
as a feasible option to generate electricity. The present work investigates the feasibility of a wind power station
located in a low rated wind speed region of Turkey providing a general approach for selection of the suitable wind
turbine. Economic analysis was performed by calculating the key financial figures such as net present value (NPV),
basic payback period (BPP) and the internal rate of return (IRR) for five various options and hourly mean, monthly
and seasonal power productions are simulated for the most feasible option using the wind speed measurements
in the region. Results show that it is possible to obtain a reasonable capacity factor in low rated wind speed regions
with wind turbines that have larger rotors. Although the average wind speed is low in the examined region, a wind
power station is still found to be feasible. According to the simulation results, maximum power is produced during
the evening hours on a daily basis and during the summer months on a seasonal basis, ensuring power flow usually
when maximum power consumption levels are reached. All the data used in this study are based on long-term
measurements.
1 Introduction
Energy has been an essential component of human being
since decades to perform various works and the need
for energy will never end. Not harming the environment
while producing energy is on the front burner of many
researchers since people realized that environmental
effects has the potential of negatively impacting the daily
lives of individuals. The first thing that spring to mind is
renewable energy when the topic is sustainable energy
production. Today, most of the developed and developing
countries are planning to increase energy production from
renewables since these are environment friendly, native
and unlimited. Wind power is one of the most known
renewables and the use of wind to produce energy
increases day by day. Global cumulative installed wind
power
capacity
has
increased
from
17,400
to 432,419 MW from 2000 to 2015 [1]. Studies on wind
energy, especially about feasibility of wind power, have
effect on the increase. In a feasibility study for İzmir,
Turkey, authors stated that the larger the installed
capacity, the smaller the generating cost per kWh
and the higher IRR of the investment [2]. Another study
for Turkey investigated the competition potential of wind
power plants and it was concluded that the Marmara,
southeast Anatolian and Aegean regions are highly
a
suitable for wind power generation since wind speeds
exceed 3 m/s in most of these areas [3]. Shaahid et al.
investigated economic feasibility of 75 MW wind power
plants on four coastal locations - Al-Wajh, Jeddah, Yanbu
and Jizan - of Saudi Arabia and found out that capacity
factors and unit costs vary from 12% to 21%
and from 0.0423 to 0.0711 US$/kWh, respectively [4].
Khabit et al. studied on Assessment of electricity
generation by wind power in nine costal sites in Malaysia
specified that average unit cost of the energy produced
by a
wind
power
system
in
Malaysia
is
1.6–7.29 USD/kWh and the use of wind power systems
as standalone systems is not recommended
for the selected sites [5]. Celik pointed out in his study
that the cost of wind electricity per kWh can be
significantly reduced if the components of wind energy
systems were exempted from taxes and subsidies were
introduced [6]. Mostafaeipou et al. studied on wind
energy feasibility study for city of Shahrbabak in Iran
and recommended to install small size wind turbines
for electricity supply of public buildings and private
houses [7]. Blackler and Iqbal specified that a wind
farm project at the Holyrood thermal generation station
site is feasible in their study on Pre-feasibility study
of wind power generation in Holyrood, Newfoundland
[8]. Many other studies can be found in the literature
Corresponding author:
© The Authors, published by EDP Sciences. This is an open access article distributed under the terms of the Creative Commons Attribution
License 4.0 ( />
E3S Web of Conferences 10 , 00034 (2016)
DOI: 10.1051/ e3sconf/20161000034
SEED 2016
Table 1. Characteristics of the selected turbines
on feasibility of wind power plants [9-13], in addition,
there are some review studies available for some
countries [14-15].
The present study investigates the feasibility
of a wind power station located in a low rated wind speed
region of Turkey. Most proper wind turbine among
various options is selected the for the region considering
the low rated wind speed and it is simulated for different
time periods. In addition, economic analysis was
performed by calculating BPP, NPV and IRR values.
Wind
turbines
WT - 1
WT - 2
WT - 3
WT - 4
WT - 5
WT - 6
2 Measured wind data
Cut-in
WS
(m/s)
3
3
3
3
3
3
Cut-out
WS
(m/s)
25
21
22
25
24
25
Rated
Power
(kW)
3000
3000
2000
1500
2000
1500
Rotor
diameter
(m)
115
122
100
100
100
86
4 Calculation Methodology
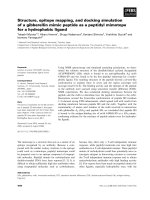
Wind speed measurements have been performed
in Cumra, Turkey since 2006 with the help of a wind pole
in the region. Five anemometers are installed at various
heights on the wind pole and the wind speed data
measured at 80 m height in 2013 are used in the present
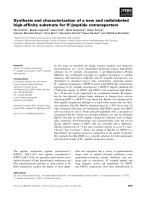
study. Monthly mean wind speeds are shown in Figure 1.
Capacity factor is the ratio of annual output to potential
output, and it is calculated using the Eq. 1 where Pannual is
the annual energy production (MW) and Ppotential is
the annual potential energy production in full capacity
(MW).
Cp = Pannual / Ppotential
(1)
Unit cost is calculated using Eq. 2. In this equation,
Ewt is the cost of the wind turbine (€) and n is the lifespan
(year) of the project.
UC = Ewt / (Pannual x n)
(2)
Basic payback period is the ratio of total expenditures,
Etotal (€) to annual savings (€).
BPP = Etotal / AS
(3)
Total expenditures include wind turbine cost, total
operation and maintenance (O&M) cost in the lifespan
period, foundation, transmission line and other costs. It is
given in Ref. [16] that the O&M costs are approximately
0.3-0.4 c€/kWh during the first two years
and approximately 0.6-0.7 c€/kWh after six years
for wind turbines. In our calculations, we considered
the value 0.5 c€/kWh for wind turbines. Foundation,
transmission line and other costs are taken as 20%
of the wind turbine price.
Net present value (NPV) is calculated by discounting
all future income and expenditure flows to the present
with Eq. 4 [9].
Figure 1. Monthly mean wind speeds
As seen from Fig. 1, mean wind speed is higher
in summer months compared to other months and highest
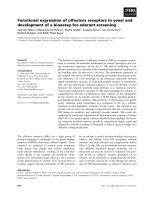
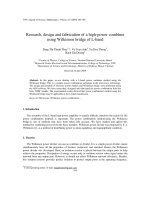
mean wind speed is obtained in August. Wind rose plot
depicting wind speed frequency and energy potential
according to the wind direction is given in Fig. 2.
NPV=∑[(B-C)/(1+r)n]
(4)
Where, B is the benefit, C is the cost, r is the discount
rate and n is lifecycle year of the project. In this study,
the project lifespan was taken as 25 years for the analysis
and the overall annual interest rate (r) is assumed
to be 2.5%. Salvage cost was not taken into account
which was estimated to be equal to the disassembly
cost of the wind power system components
at the end of the project lifespan. IRR is the rate,
which would make NPV value zero and it can be
calculated with Eq. 5, where the parameters are same
as the ones of NPV [9].
Figure 2. Wind speed frequencies and energy potential
3 Selected wind turbines
Six commercial wind turbines are selected to predict
annual energy production and perform economic
analysis. Total installed power is assumed to be 6 MW
according to the power requirement in the region
and wind turbines are selected considering this value.
Characteristics of wind turbines are given in Table 1.
∑[B/(1+r)n]=∑[C/(1+r)n]
2
(5)
E3S Web of Conferences 10 , 00034 (2016)
DOI: 10.1051/ e3sconf/20161000034
SEED 2016
Table 2. Annual electricity productions, capacity factors and unit prices of selected wind turbines
WT - 1
3 MW
4,050,000
2
WT - 2
3 MW
3,350,000
2
WT – 3
2 MW
2,175,000
3
WT - 4
1.5 MW
2,525,00
4
WT – 5
2 MW
2,575,000
3
WT - 6
1.5 MW
1,875,000
4
1,620,000
1,340,000
1,305,000
2,020,000
1,545,000
1,500,000
O&M costs for 25 years (€)
Total Cost(€)
1,769,125
11,489,125
1,557,500
9,597,500
1,776,500
9,606,500
2,135,875
14,255,875
1,816,125
11,086,125
1,642,625
10,642,625
Annual Electricity Production
(MWh)
14,153
12,460
14,212
17,087
14,529
13,141
355,300
427,175
363,225
328,525
0.0270
27
0.0334
32.5
0.0305
27.6
0.0324
25
Rated Power (MW)
WT Cost* (€)
Number of WT
Foundation, Transmission line and
other costs (€)
Total generated electricity in 25
353,825
311,500
years (MWh)
0.0325
0.0308
Unit cost of the electricity (€/kWh)
26.9
23.7
Capacity Factor, Cp (%)
*Cost of one wind turbine including its installation cost.
Table 3. Economic feasibility analysis results
Turbine type
WT - 1
WT - 2
WT - 3
WT – 4
9720000
8040000
7830000
12120000
Investment cost1 (€)
Annual energy production
14153
12460
14212
17087
(MWh/year)
1556830
1370600
1563320
1879570
Annual cost saving (€/year)
Operation and maintenance
70765
62300
71060
85435
cost (€/year)
Net annual cost saving2
1486065
1308300
1492260
1794135
(€/year)
6.15
5.25
6.76
Basic payback period (years) 6.54
17,659,820
16,064,611
19,663,960
20,935,819
NPV (€)
14.8
15.9
18.8
14.3
IRR (%)
1Investment cost includes installation and other additional costs except O&M costs.
2Net annual cost saving is calculated by subtracting yearly O&M costs from annual cost saving.
WT - 5
9270000
WT - 6
9000000
14529
13141
1598190
1445510
72645
65705
1525545
6.08
18,837,215
16.1
1379805
6.52
16,422,046
14.9
5 Results
The power outputs, capacity factors and unit prices
of the selected turbines are given in Table 2.
As mentioned before, total installed power is assumed
to be 6 MW. According to the Table 2, capacity factors
and unit prices change between 25 - 32.5 % and 0,027 –
0,0325 €/kWh, respectively. Although WT – 4 has
the highest capacity factor, WT – 3 has the best unit price
because of its cheaper price. Economic feasibility
analysis results are presented in Table 3. All the options
have basic payback periods that change between 5,25
and 6,54 years, and the most feasible one is found to be
the WT -3.
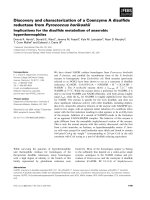
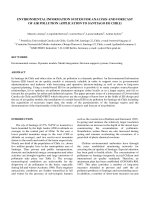
Figure 4. Monthly power production
Figure 5. Seasonal power production
Figure 3. Hourly mean power production
3
E3S Web of Conferences 10 , 00034 (2016)
DOI: 10.1051/ e3sconf/20161000034
SEED 2016
Hourly mean, monthly and seasonal power
productions are simulated for the most feasible option,
the one including three of WT – 3s. Hourly, monthly
and seasonal mean power productions are presented
in Fig. 3, 4 and 5, respectively. As it is can be seen
from the figures, maximum power productions are
obtained during evening hours on a daily basis and during
summer months on a monthly basis.
8.
9.
10.
6 Conclusion
In the present study, feasibility of a wind power plant
in a low rated wind speed region is investigated and it is
found out that it can also be feasible to install wind power
plants in low rated wind speed regions. A good capacity
factor that is about 32 % is obtained for a commercial
wind turbine, however, it was not the most feasible
option because of the higher price. A reasonable basic
payback period, 5.25 years, is obtained in the region
where the average wind speed is under 6 m/s at 80 m
height. This shows that the more the wind turbine
technology enhances, the more feasible wind power
plants will become in low rated wind speed regions
in the future. Simulation results show that maximum
power output from the wind power plant is obtained
during the times when maximum energy consumption
levels are reached.
11.
12.
13.
14.
Acknowledgement
Authors would like to thank to Alibeyhuyugu Irrigation
Cooperation for providing the data.
15.
References
16.
1. GWEC- Global Wind Energy Council, Global Wind
Power
Statistics
(2015),
available
online
at : />2. B. Ozerdem, S. Ozer, M. Tosun, Feasibility study
of wind farms: A case study for Izmir, Turkey
J. Wind Eng. Ind. Aerodyn. 94, 10 (2006).
3. A. Demirbas, Competition Potential of Wind Power
Plants, Energy Sources 27, 7 (2005).
4. S. M. Shaahid, L.M. Al-Hadhrami, M.K. Rahman,
Economic feasibility of development of wind power
plants in coastal locations of Saudi Arabia –
A review, Renewable Sustainable Energy Rev. 19
(2013).
5. T. Khatib, K. Sopian, M. Z. Ibrahim, Assessment
of electricity generation by wind power in nine costal
sites in Malaysia, Renewable Sustainable Energy
Rev. (2012).
6. A. N. Celik, A Techno-Economic Analysis of Wind
Energy in Southern Turkey Int. J. Green Energy 4, 3
(2007).
7. A. Mostafaeipour, A. Sedaghat, A. A. Dehghan-Niri,
V. Kalantar, Wind energy feasibility study for city
4
of Shahrbabak in Iran, Renewable Sustainable
Energy Rev. 15, 6 (2011).
T. Blackler, M.T. Iqbal, Pre-feasibility study of wind
power generation in Holyrood, Newfoundland,
Renewable Energy 31, 4 (2006).
M.S. Genỗ, M. Gửkỗek, Evaluation of Wind
Characteristics and Energy Potential in Kayseri,
Turkey, J. Energy Eng. 135, 2 (2009).
F. Kose, M.N. Kaya, Analysis on meeting
the electric energy demand of an active plant
with a wind-hydro hybrid power station in Konya,
Turkey: Konya water treatment plant Renewable
Energy 55 (2013).
F. Kose, M. H. Aksoy, M. Ozgoren, An assessment
of wind energy potential to meet electricity demand
and economic feasibility in Konya, Turkey,
International Journal of Green Energy 11 (2014).
M. R. Nouni, S. C. Mullick, T. C. Kandpal, Technoeconomics of small wind electric generator projects
for decentralized power supply in India, Energy
Policy 35 (2007).
F. Kose, M.H. Aksoy, M. Ozgoren, ”Economic
Feasibility of Wind Energy Potential in Konya,
Turkey”, International Scientific Conference,
UNITECH09, Proceedings (2009) Gabrovo,
Bulgaria.
S.M. Shaahid, L.M. Al-Hadhrami, M.K. Rahman,
Economic feasibility of development of wind power
plants in coastal locations of Saudi Arabia –
A review, Renewable Sustainable Energy Rev.
19, (2013).
R. Majumder, I. Mukherjee, B. Tudu and D. Paul,
Review on feasibility of wind energy potential
for India, Non Conventional Energy (ICONCE), 1st
International Conference on, Kalyani (2014).
The European Wind Energy Association (EWEA),
Wind energy 2 (2011).