The role of health related, motivational and sociodemographic
Bạn đang xem bản rút gọn của tài liệu. Xem và tải ngay bản đầy đủ của tài liệu tại đây (132.91 KB, 8 trang )
Public Health Nutrition: 15(3), 407–414 doi:10.1017/S136898001100156X
The role of health-related, motivational and sociodemographic
aspects in predicting food label use: a comprehensive study
Rebecca Hess*, Vivianne HM Visschers and Michael Siegrist
Consumer Behavior, Institute for Environmental Decisions, ETH Zurich, Universitaetstrasse 22,
8092 Zurich, Switzerland
Submitted 22 July 2010: Accepted 27 May 2011: First published online 14 July 2011
Abstract
Objective: Previous studies focused on a limited number of determinants of food
label use. We therefore tested a comprehensive model of food label use consisting
of sociodemographic, health-related and motivating variables. These three predictor
groups were chosen based on the previous literature and completed with new
predictors not yet examined in a comprehensive study of frequency of lab el use.
Design: We sent questionnaires to a random sam ple of households in the German-
speaking part of Switzerland.
Setting: The respondents filled in the questionnaire at home and returned it by mail.
Subjects: We analysed the data of 1162 filled-in questionnaires (response r ate 5 38
%). Of the respondents, 637 were women (55 %), and their mean age was 53?54
(
SD 15?68) years.
Results: Health-related variables were the most important group of predictors of label
use, followed by motivating factors and sociodemographic variables. Placing impor-
tance on health, healthy eating and nutritional value of food, perceived vulnerabil ity
for diet-related diseases, nutrition knowledge, numeracy and gender were positively
associated with frequency o f foo d l abel use whereas shopping habits and seeing
eating as something positive were negative predictors of frequency of label use.
Conclusions: People’s health consciousness should be raised in order to increase the
frequency o f f ood label use. F urthermore, i t s hould b e stressed that r eading labels and
keeping a healthy diet do not contradict ‘good eating’, and that both of these aspects
can be combined with the help of food labels.
Keywords
Food label
Nutrition table
Comprehensive model
Predictors of food label use
Nutrition labels on food products are often praised as an
important instrument for health promotion and preven-
tion of diseases associated with overweight and obe-
sity
(1–4)
. To find out how this preventive strategy can be
used optimally and where the potential starting points
for further improvement could be, it is very important to
understand what determines use of food labels. This
knowledge would help public health communicators to
decide to whom and how they need to promote food
label use. However, to our knowledge, existing studies
investigating food label use have focused mainly on
either sociodemographic and economic variables or on
health-related factors. No study has systematically inclu-
ded factors inhibiting label use. The aims of the present
study were, therefore, to provide a comprehensive fra-
mework of determinants of nutrition label use and to
shed light on the motivators and inhibitors of nutrition
label use. Thereby, we paid attention to three groups of
potential determinants of label use: (i) a person’s socio-
demographic and economic background; (ii) health-
related aspects; and (iii) factors which discourage people
from using food labels (see Fig. 1). We now discuss the
relevant factors of each of these three determinants,
based on previous studies. One difficulty of studying
label use is the number of different labels in the different
international markets and the difference in measuring
label use (e.g. frequency of label use v. are labels used at
all – yes or no). As we are interested in factors predicting
the frequency of label use, we focus mainly on studies
investigating frequency of label use (i.e. how often peo-
ple use labels) and less on studies investigating whether
labels are used at all.
First, regarding sociodemographic and economic vari-
ables, review studies suggest that women, better edu-
cated people and younger people usually report looking
at nutrition labels more often
(1,2,5)
. Furthermore, addi-
tional situational factors, for example, type of household
and perceived importance of price, seem to play a role in
determining whether people look at nutrition labels or
not
(3,5)
. However, in studies in which several types of
sociodemographic and situational variables were looked
at together, the picture is not that clear any more
(6–10)
.
*Corresponding author: Email r The Authors 2011
There were no clear and consistent associations between
the sociodemographic variables and frequency of label
use. For example, two studies found that men used labels
less often than women
(7,8)
; however, others did not find
any effect of gender on degree of label use. In one study,
age had a negative effect on frequency of label use
(7)
whereas no other studies found significant effects for age.
Furthermore, no studies found associations between
education or income and degree of label use except one
study which found that higher education was associated
with more label use and higher income with less label
use
(6)
. One reason for these inconsistent findings could
lie in the different sets of predictor variables used in these
studies. For example, the studies that found no effect
for gender included importance of price, nutrition and
taste
(6,9,10)
whereas the ones that found a gender effect
did not include these variables in the set of predictors
(7,8)
.
Therefore, it seems as if the effects of sociodemographic
variables sometimes disappear when underlying variables
are included in the model. Our aim is to clarify the role
of sociodemographic variables in label use by including
all main predictor variables that have been investigated
separately in one model. Following this procedure, we
intend to investigate which of the sociodemographic
variables might be genuine predictors of label use and
which are rather proxies for underlying factors.
Second, these studies measured several health-related
variables that may influence label use. These variables,
for example, being on a special diet
(6,8,9)
, believing that
there is a relationship between diet and disease
(8,10)
,
placing importance on nutrition
(9,10)
as well as placing
importance on following dietary guidelines
(9,10)
, seem to
be related to more frequent label use. Other studies also
supported the importance of health-related aspects for
label use (see references (1), (2) and (5) for reviews of
this literature). For example, having a strong belief in a
relationship between diet and cancer, interest in healthy
eating and being confident that one is able to eat healthily
were associated with whether participants used labels at
all
(11–14)
. Furthermore, Petrovici and Ritson
(15)
found that
self-reported nutrition knowledge and health motivation
were positively related to frequency of label use. Perceived
threat of nutrition-related diseases was negatively related
and perceived effectiveness of diet t o decrease the risk of
disease was positively related to self-reported healthiness of
diet. H owever, these two latter v ariables were not associated
with label use.
In sum, health-related aspects, such as the importance
of health and a healthy diet, seem to play an important
role in why some people use labels. However, everybody
is not interested in health and healthy eating, and mere
exposure to food labels does not necessarily lead to
food label use and decisions to use healthy food pro-
ducts
(13,14)
. Thus, one should additionally consider a third
group of determinants; namely, the motivational reasons
people do not use labels. Gorton et al.
(16)
asked their
participants about their reasons for not using nutrition
labels. In addition to not being interested in healthy eat-
ing, the participants mentioned not needing more infor-
mation about food, not understanding labels and having
priorities other than healthy eating
(16)
.
Reading labels might, therefore, sometimes simply not
be necessary for picking healthy food products because
people always buy the same products and, therefore,
know the products very well. Similarly, one reason peo-
ple gave for not looking at health endorsements on
products in a study by Rayner et al.
(17)
was that buying
food products was a habit, making reading labels super-
fluous. Shopping habits might therefore be associated
with less label use. Food and nutrition knowledge might
play a similar role in determining food label use. People
who know a lot about healthy eating might not consider
looking at labels necessary because they already know
enough about the nutritional value of the food product
they are buying. Some studies point in this direction as
they showed no effect of nutrition knowledge on the
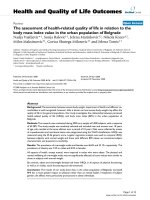
Sociodemographic and socio-economic variables
Gender (x)
Age (x)
Education (x)
Health-related aspects
Importance of health and healthy eating (+)
Importance of nutritional value of food and health while shopping (+)
Perception of health/diet association (+)
Perceived vulnerability of getting a diet-related disease (+)
Special diet (+)
Self-efficacy of eating a healthy diet (+)
Motivational variables
Shopping habits (–)
Nutrition knowledge (–/+)
Numeracy (+)
Importance of price and taste while shopping (–)
Hedonic meaning of eating (–)
Frequency of nutrition label use
Fig. 1 A comprehensive model of determinants of label use. Expected direction of associations, based on previous literature:
2, negative relationship expected; 1, positive relationship expected; 2/1, relationship expected, unclear in which direction;
x, no relationship expected
408 R Hess et al.
probability of label use
(7,9,10)
. However, this might not be
the only way in which nutrition knowledge can interact
with label use because other studies suggest that nutrition
knowledge is p ositively associated w ith label use
(6,13–15,18)
.
Thus, having high nutrition kn owledge might refl ect a basic
interest in healthy e ating a nd could, therefore, be associated
with even more label use.
Another reason why the participants in Gorton et al.’s
study
(16)
did not use labels was that the participants
did not understand the labels. According to Grunert
et al.’s
(13,14)
conceptual framework of food label use, the
relationship between the perception of labels and the
actual and meaningful use of the information in the labels
is influenced by factors associated with understanding the
label. Similarly, perceived ease of label use and observed
efficiency of label use have been shown to be associated
with more label use
(7,8)
. Therefore, factors that are
negatively associated with actual understanding of labels
and/or confidence in understanding labels might also be
negatively related to label use. Numeracy is such a
potentially inhibiting factor, as it is associated with less
understanding of nutrition labels
(19)
. In the same study,
there was also a weak indication that label use was dif-
ferent for persons with high numeracy and for persons
with low numeracy
(19)
.
Finally, participants in Gorton et al.’s study
(16)
men-
tioned having priorities other than healthy eating as a
reason why they do not use labels. Importance of price
was negatively associated with frequency of nutrition
label use in Drichoutis et al.’s study
(6)
. Furthermore, the
perception of eating as a primarily hedonic experience
might also inhibit people from looking at labels. The
results of an eye tracking study suggested that being
motivated to look for tasty food was associated with less
attention to nutrition tables than being motivated to
choose healthy products
(20)
. Furthermore, Drichoutis
et al.
(6)
found importance of taste to be negatively related
to whether people used labels at all or not (irrespective of
how often they use it). Thus, having priorities such as
having a tight budget for buying food products or placing
importance on the hedonic aspects of eating might keep
people from using labels whereas health motivation may
enhance label use.
We included all of these aspects described above in
one comprehensive model of determinants of label use
(see Fig. 1). We thereby aimed to answer the question
which determinants influence whether people do or do
not use labels and, based on these important determi-
nants, to suggest implications for public health practice.
Based on the literature described above, we expect that
the health-related variables are the most important posi-
tive predictors of label use, followed by the motivational
variables, which we expect discourage people from
using labels (see Fig. 1). Because the studies described
above showed very inconsistent results regarding socio-
demographic and economic variables, we hypothesise
that these variables are rather proxies of underlying
health-related motivators and inhibitors of label use and
will therefore not be associated with label use when
controlling for the other two groups of variables.
Method
Procedure and sample
We sent a questionnaire to a sample of households in the
German-speaking part of Switzerland. This sample was
randomly chosen from the Swiss telephone book, the
best available directory for the Swiss general population.
The first questionnaire was sent to the households in
September 2009. Seven weeks later, we sent a reminder
letter to the households from which we had not yet
received a filled-in ques tionnaire. Following this procedure,
we received 1162 filled-in questionnaires (response rate
38 %) from 637 women (55 %) and 508 men ( 44 %).
Seventeen pe rsons (1 %) did not specify t h eir gender. In our
sample, 109 persons (9 %) had finished primary or lower
secondary school, 530 (46 %) u pper s econdary v ocational
school, 194 (17 %) upper secondary school and 309 (26 %)
university/technical university; t wenty (2 %) persons did
not state their educational background. The respondents’
mean age was 53 ?54 (
SD 15?68) ye ars. Accor ding to Sw iss
Federal Statistical Office data
(21)
, men, people with primary
or lower secondary school education and younger people
were slightly under -represented in o ur sampl e. Nevertheless,
our sample was a good representation of the German-
speaking part of Switzerland.
Questionnaire
The questionnaire contained questions about all of
the variables and constructs listed in Fig. 1. Most of the
predictor concepts and the outcome variable label use
were assessed in scales consisting of several items (see
Table 1). We based the items of these scales on several
previous studies that had examined knowledge, attitudes
and beliefs in a health and nutrition context, or numer-
acy
(15,22–28)
, and completed them with our own ques-
tions. Table 1 presents the scales used in the study with
one item example each, the internal reliability, mean sum
score, number of respondents and original sources*. We
calculated the means of the scales for all persons who had
filled in more than half of the items of a scale.
We measured our outcome variable label use by asking
the respondents how important labels are when they are
choosing food products, and how often they used labels
in three different situations (choice of food products
one has never bought before, decision between two or
more food products, judging how healthy a product is).
* Due to space restrictions, not all items on the questionnaire can be
listed here. However, the items can be obtained from the first author
upon request.
Predicting food label use 409
We chose these situations based on the study by Hig-
ginson et al.
(29)
, which showed that these situations are
important application fields of food labels. In Switzerland,
labels in the form of nutrition tables are the standard
form of food labelling, although recently front-of-package
labels have been appearing more and more in stores.
We focused our questions on the standard nutrition table
to be sure that all respondents have been exposed to
the labels we are studying. As can be seen in Table 1,
knowledge was measured in two ways. On the one hand,
it was assessed as self-reported knowledge (‘subjective
knowledge’) and on the other hand as a score on a short
knowledge scale (‘objective knowledge’). We chose to
measure these two aspects of knowledge as both have
been shown to be important for label use
(6,15,18)
.
In addition to the scales shown in Table 1, age, gender
(0 male/1 female) and education (four categories, see
sample description) were assessed as sociodemographic
characteristics. Education was turned into three dummy
variables with the reference category as ‘upper secondary
vocational school’ (i.e. the largest group) so that we could
enter this variable into the linear regression model. Further-
more, being on a special diet was measured with one single
dichotomous item (‘do you have to adhere to a special diet
due to a disease or are you on a diet?’; 0 no/1 yes).
Data analysis
We analysed the data by running a hierarchical regression
analysis with the SPSS statistical software package version
17?0 (SPSS Inc., Chicago, IL, USA). The model in Fig. 1
was used as the theoretical framework for the analysis,
and we entered the variables blockwise into the regres-
sion model. As the previously most examined group
of predictors, sociodemographic variables were entered
first (step 1), followed by the second already studied
group of health-related variables (step 2). Finally, the
Table 1 Description of predictors and outcome variables measured on 6-point Likert-scales (1 5 do not agree, 6 5 agree, if not mentioned
otherwise) and example items
Number of items Mean
SD n a
Outcome variable
Food label use 43?33 1?59 1149 0?934
How often do you use labels when you buy a product for the first time?-
Health-related predictors
Importance of health 84?37 0?88 1138 0?783
Living in the best possible health is very important to me-
-
Importance of healthy eating 4 3?90 0?99 1139 0?712
I am prepared to leave a lot to eat as healthy as possibley
Importance of nutritional value of food while shopping 1 4?53 1?27 1142 –
How important is the nutritional value of food for you when you are buying food?J
Importance of health while shopping 1 5?10 0?95 1146 –
How important is health for you when you are buying food?J
Perception of health/diet association 4 4?68 0?90 1139 0?748
Diet is something very important for my healthz
Perceived vulnerability for diet-related disease 3 2?06 1?01 1136 0?844
I am worried about becoming ill in the future because of my diet
Self-efficacy of eating a healthy diet 2 4?85 0?96 1141 0?643
I can eat a healthy diet when I want to
Motivational predictors
Shopping habits 44?19 0?95 1148 0?583
I always buy approximately the same food products
Self-reported nutrition knowledge 4 4?67 1?01 1149 0?720
I know better how a healthy diet looks like compared with the average person
Nutrition knowledge 10 6?41 2?06 1150 0?548
Bacon contains more calories than ham-
-
-
-
,yy
Numeracy 84?14 0?89 1138 0?829
How good are you at working with percentages?JJ,zz
Importance of price while shopping 1 4?34 1?34 1145 –
How important is price for you when you are buying food?J
Importance of taste while shopping 1 5?44 0?79 1144 –
How important is taste for you when you are buying food?J
Hedonic meaning of eating 5 5?35 0?70 1145 0?786
Eating well means quality of life for me
-1 5 never to 6 5 very often.
-
-
From the health consciousness attitude scale by Dutta-Bergman (2004)
(25)
.
yFrom the health consciousness scale by Schifferstein and Oude Ophuis (1998)
(23)
.
J1 5 not important at all to 6 5 very important.
zBased on an item from the attitudes about diet and health scale by Kristal et al. (1990)
(26)
.
Based on the health knowledge scale by Jayanti and Burns (1998)
(24)
.
-
-
-
-
From the consumer-oriented nutrition knowledge questionnaire by Dickson-Spillmann et al. (2011)
(28)
.
yy1 5 correct answer, 0 5 incorrect answer/don’t know (maximum score 5 10).
JJFrom the subjective numeracy scale by Fagerlin et al. (2007)
(27)
.
zz1 5 not at all good to 65 very good.
410 R Hess et al.
new set of motivational variables was entered into the
model as the last step (step 3).
Results
Mean degree of label use was 3?33 (
SD 1?59) on a scale
from 1 (‘never’) to 6 (‘very often’). More respondents
reported they never used labels (13 %) than reported they
always used labels (5 %); the rest of the answers were
distributed approximately equally between these two
extreme points of the scale (25th percentile 5 2?0, 50th
percentile 5 3?5, 75th percentile 5 4?75). These results
suggest a medium frequency of label use in our sample.
The results of the regression analysis are shown in
Table 2. All of the variable groups (steps) significantly
improved the regression model. O verall, sociodemographic,
health-related and motivational variables explained 32 %
of the variance in label use in our sample. The largest part
of the explained variance was due to the health-related
variables (R
2
5 0?190), whereas motivational (R
2
5 0?070)
and sociodemographic variables (R
2
5 0?055) were less
important for predicting label use.
In the group of the health-related variables, importance
of healthy eating, importance of nutritional values while
choosing foods in the supermarket and importance of
health in general significantly predicted label use. Thinking
that health in general, healthy eating and nutritional values
of food are i mpo rtant was a ssociated with more label use.
Interestingly however, importance o f health w hile shopping
or self-efficacy of eating a healthy diet was not significantly
related to label use. Th ere was also one significant a lbeit
weaker association of label use with a disease-related con-
cept: feeling at risk f or diet-related diseases was associated
with more label use. Being aware of a diet–disease asso-
ciation, on the other h and, was not associated with label
use. Therefore, wanting to live healthily seemed to be a
more important motivator for label use in our sample than
wanting to prevent disease.
The strongest predictor of label use in the group of
motivational variables was nutrition knowledge. Being
more knowledgeable (‘objective knowledge’) and also
feeling knowledgeable about nutrition and healthy eating
(‘subjective knowledge’) were associated with more label
use. Furthermore, the factors that might keep people from
using food labels were also important in our model. The
strongest inhibiting predictor was numeracy, which was
positively related to label use. This suggests that people
who do not like numbers and report that they are not
good at using numbers use food labels less. Furthermore,
having stronger shopping habits and, finally, the hedonic
meaning of eating were negatively associated with label
use. Therefore, respondents who often buy the same
food products and who see eating as something positive
use labels less. One predictor of this group turned out to
be a motivating and not an inhibiting factor: we expected
importance of price to be a negative predictor as it mir-
rors priorities other than health. However, in this model,
placing importance on price while shopping was asso-
ciated with more label use.
Of the sociodemographic variables, only gender was a
significant predictor of food label use, even after controlling
Table 2 Regression analysis for label use predicted by sociodemographic, health-related and motivational variables (n 1013)
Predictor variable B
SE B b R
2
Fdf
Step 1: Sociodemographic variables 0?055 11?647*** 5, 1007
Gender 0?357 0?098 0?112***
Age 0?000 0?003 0?000
Education (primary/lower secondary school) 20?107 0?155 20?020
Education (upper secondary vocational school)- –– –
Education (upper secondary school) 0?079 0?123 0?019
Education (university) 20?016 0?110 20?004
Step 2: Health-related variables 0?190 24?914*** 13, 999
Importance of health 0?249 0?081 0?139**
Importance of healthy eating 0?274 0?070 0?172***
Importance of nutritional value while shopping 0?167 0?046 0?134***
Importance of health while shopping 20?087 0?067 20?053
Perception of health/diet association 0?013 0?062 0?008
Perceived vulnerability for diet-related disease 0?133 0?045 0
?084**
Special diet 0?070 0?155 0?012
Self-efficacy of eating a healthy diet 20?037 0?054 20?022
Step 3: Motivational variables 0?070 22?763*** 20, 992
Shopping habits 20?147 0?045 20?089**
Self-reported nutrition knowledge 0?185 0?055 0?119**
Nutrition knowledge 0?130 0?023 0?168***
Numeracy 0?203 0?054 0?114***
Importance of price while shopping 0?071 0?033 0?060*
Importance of taste while shopping 0?022 0?060 0?011
Hedonic meaning of eating 20?174 0?067 20?076**
F
Change
(8, 999) 5 31?446, P , 0?001 for step 1/2; F
Change
(7, 992) 5 14?418, P , 0?001 for step 2/3; R
2
5 0?315 for the final model.
*P , 0?05, **P , 0?01, ***P , 0?001.
-Reference category.
Predicting food label use 411
for all other possible predictors. Age and education, on the
other h and, were not s ignifica ntly associated with food lab el
use in o u r model. In sum, health-related aspects, knowledge
and inhibiting factors were the most powerful predictors of
label use in ou r model wherea s sociodemographic variables
were of little importance.
Discussion
To the best of our knowledge, the present study is the first
to apply a more comprehensive model of food label use.
In addition to the quite well-established sociodemo-
graphic and health-related variables, we included inhi-
biting factors of label use in our model. Furthermore, our
comprehensive model showed that not all variables
which appeared important for label use in previous stu-
dies were significantly associated with label use when
entered into the model together with other predictors.
Two main influence factors on label use emerge from
our findings: attitudes toward health and inhibiting fac-
tors. First, the most important predictor of label use was
importance placed on health and eating. Respondents
who considered health, healthy eating and the nutritional
value of food as important reported more frequent label
use than respondents who did not place importance
on these aspects. This finding confirms the crucial role
that health-related factors played in earlier studies
(9–15)
.
Disease-related aspects, on the other hand, were less
important for predicting label use. In sum, these findings
imply that people rather use labels because they are
interested in health and healthy eating and not primarily
because they are afrai d of falling ill. Interestingly, people
who saw eating as something positive and hedonic repor-
ted less label use. Thus, people might perceive food labels
as something that spoils the enjoyment of eating or tha t
they do not perceive healthy eating as something positive.
Second, people’s skills and usual behaviour seem to be
important for how often they use labels. Lower numeracy
seems to inhibit food label use. It is thus possible that the
merely numerical presentation of nutritional information
on the package as is mostly the case in Switzerland might
be problematic from a public health perspective. On the
one hand, this format may decrease understanding of
the label
(30)
and on the other might cause people to not
even look at the label if they think they will not under-
stand the numbers on it anyway. Furthermore, shopping
habits were associated with less frequent label use in our
study. If somebody’s diet is already healthy, this asso-
ciation does not have to be a bad sign for the promotion
of healthy eating as label use is not necessary in this case.
However, if somebody’s diet is not healthy, habits do
become a problem for public health as they impede a diet
change toward a healthier diet. Interestingly, neither
importance of price nor importance of taste played an
inhibiting role for label use i n o ur model. Thus , beh avioural
and skill-related obstacles to label use were more important
in our sample than having potentially concurring priorities
when shopping. Knowledge seemed rather to be part of a
more general interest in he althy eating and less an inhi-
biting factor for label use as knowledge was associated with
more label use.
As expected, the sociodemographic variables we
measured did not play a major role in predicting the
frequency o f l abel use. Age and education may be corre-
lated with the more crucial underlying factors such as atti-
tudes or behaviours, and become important only when
these factors are not measured. This might explain t he
mixed results regarding t hese variables in previous stu-
dies
(6–10)
. Gender, on the other hand, was still a significant
predictor in our model. This might imply that women use
labels more often than men, even when cont rolling for
health consciousness. However, although we included
many potential predictors in our model, it did not explain a
large part of the variance of label use. We might not have
measured an important underlying factor that is corr elated
with gender. Further studies are thus needed to find out
which factors additionally influence food label use.
Apart from the rather large amount of unexplained
variance, several further limitations of our study should
be considered. Compared with more direct measures of
label use, for example, verbal protocol analysis, in-shop
observations or eye tracking, measures of label use that
rely on self-reported data such as questionnaires might
have the disadvantage of resulting in over-reported label
use
(4,13,14,17,31,32)
. Direct measures may thus be the
instrument of choice when one wants to know whether
people understand the labels and apply them correctly.
However, when people do not look at labels, one cannot
induce from such measures whether this was the case
because of implicit knowledge about the product or
shopping habits making looking at the label superfluous,
or because of a lack of interest in labels. Therefore, we
decided to take the potential disadvantage of over-
reporting and investigate our research question with a
questionnaire. Furthermore, even if there was no over-
reporting in our study, we cannot know whether people
who use labels more often use these labels as a decision
aid to buy the healthiest product. In other words, we do
not know whether label use translates into a healthier diet
(see the last part of Grunert et al.’s conceptual framework
of food label use
(13,14)
). As our results suggest that people
who are generally interested in health and healthy eating
use labels more often than others, we can speculate
that they may use labels for choosing healthy foods.
However, even if persons interested in health and healthy
eating do use labels for this purpose, this does not
imply that persuading persons who are not interested in
health and nutrition to use labels will have the same effect
on this group’s behaviour. Finally, another limitation
may be that we used short and partly new scales that had
not been tested before, and some did not have excellent
412 R Hess et al.
scale properties. Therefore, these results should be
replicated and confirmed in further studies.
Conclusions
Our findings can help public health communicators to
focus on crucial determinants of label use in order to
promote label use. On the one hand, as an interest in
health and healthy eating seems to be the central element
in determining the frequency of label use, people’s health
consciousness should be raised in order to also increase
the frequency of food label use. Additionally, if commu-
nicators want to directly promote label use and not
indirectly via health consciousness, labels should be
promoted primarily as an instrument to maintain health
rather than as a measure to prevent illnesses. Further-
more, it should be stressed that reading labels and
maintaining a healthy diet do not contradict enjoying
eating, and that both of these aspects can be combined
with the help of food labels. On the other hand, com-
municators should keep in mind the obstacles of food
habits and of perceived low skills that might lead to
a decreased frequency of label use. Food labels should be
designed in a way which is understandable for everyone.
Perhaps some graphical and/or verbal explanations for
the numbers should be used on the label or in dietary
counselling
(30)
. Public health communicators should take
shopping habits into account when promoting label use.
People with strong shopping habits and an unhealthy
diet should be encouraged to use labels to compare and
choose food.
Acknowledgements
The study reported in this paper received no specific
funding from an agency in the public, commercial or non-
profit sector. The authors had no conflicts of interest in
writing this paper . R.H., V.H.M.V. and M.S. developed the
study design and the questionnaire. R.H. organised the data
collection, analysed the data and wrote most of the article.
References
1. Baltas G (2001) The effects of nutrition information on
consumer choice. J Advert Res 41, 57–63.
2. Cowburn G & Stockley L (2005) Consumer understanding
and use of nutrition labelling: a systematic review. Public
Health Nutr 8, 21–28.
3. Grunert KG & Wills JM (2007) A review of European
research on consumer response to nutrition information on
food labels. J Public Health 15, 385–399.
4. Mhurchu CN & Gorton D (2007) Nutrition labels and claims
in New Zealand and Australia: a review of use and
understanding. Aust N Z J Public Health 31, 105–112.
5. Drichoutis AC, Lazaridis P & Nayga RM (2006) Consumers’
use of nutritional labels: a review of research studies and
issues. Acad Mark Sci Rev 2006, issue 9; available at http://
www.amsreview.org/articles/drichoutis09-2006.pdf
6. Drichoutis AC, Lazaridis P & Nayga RM (2005) Nutrition
knowledge and consumer use of nutritional food labels.
Eur Rev Agric Econ 32, 93–118.
7. Drichoutis AC, Lazaridis P, Nayga RM et al. (2008) A
theoretical and empirical investigation of nutritional label
use. Eur J Health Econ 9, 293–304.
8. Kim S-Y, Nayga RM & Capps O (2001) Health knowledge
and consumer use of nutritional lables: the issue revisited.
Agric Resour Econ Rev 30, 10–19.
9. Nayga RM, Lipinski D & Savur N (1998) Consumers’ use of
nutritional labels while food shopping and at home.
J Consum Aff 32, 106–120.
10. Nayga RM (2000) Nutrition knowledge, gender, and food
label use. J Consum Aff 34, 97–112.
11. Satia JA, Galanko JA & Neuhouser ML (2005) Food nutrition
label use is associated with demographic, behavioral, and
psychosocial factors and dietary intake among African
Americans in North Carolina. J Am Diet Assoc 105, 392–402.
12. Neuhouser ML, Kristal AR & Patterson RE (1999) Use of
food nutrition labels is associated with lower fat intake.
J Am Diet Assoc 99, 45–53.
13. Grunert KG, Fernandez-Celemin L, Wills JM et al. (2010)
Use and understanding of nutrition information on food
labels in six European countries. J Public Health 18,
261–277.
14. Grunert KG, Wills JM & Fernandez-Celemin L (2010)
Nutrition knowledge, and use and understanding of
nutrition infor mation on food labels among consumers in
the UK. Appetite 55, 177–189.
15. Petrovici DA & Ritson C (2006) Factors influencing
consumer dietary health preventative behaviours. BMC
Public Health 6, 222.
16. Gorton D, Mhurchu CN, Chen M-H et al. (2009) Nutrition
labels: a survey of use, understanding and preferences
among ethnically diverse shoppers in New Zealand. Public
Health Nutr 12, 1359–1365.
17. Rayner M, Boaz A & Higginson C (2001) Consumer use of
health-related endorsements on food labels in the United
Kingdom and Australia. J Nutr Educ
33, 24–30.
18. Fitzgerald N, Damio G, Segura-Perez S et al. (2008)
Nutrition knowledge, food label use, and food intake
patterns among Latinas with and without type 2 diabetes.
J Am Diet Assoc 108, 960–967.
19. Rothman RL, Housam R, Weiss H et al. (2006) Patient
understanding of food labels: the role of literacy and
numeracy. Am J Prev Med 31, 391–398.
20. Visschers VHM, Hess R & Siegrist M (2010) Health
motivation and product design determine consumers’
visual attention to nutrition information on food products.
Public Health Nutr 13, 1099–1106.
21. Swiss Federal Statistics Office (2011) Population size and
population composition. />portal/en/index/themen/01/02.html (accessed June 2011).
22. Lee SY, Hwang H, Hawkins R et al. (2008) Interplay of
negative emotion and health self-efficacy on the use of
health information and its outcomes. Commun Res 35,
358–381.
23. Schifferstein HNJ & Oude Ophuis P (1998) Health-related
determinants of organic food consumption in the Nether-
lands. Food Qual Prefer 9, 119–133.
24. Jayanti RK & Burns AC (1998) The antecedents of
preventive health care behavior: an empirical study. J Acad
Mark Sci 26, 6–15.
25. Dutta-Bergman MJ (2004) Health attitudes, health
cognitions, and health behaviors among Internet health
information seekers: population-based survey. J Med
Internet Res 6,8.
26. Kristal AR, Bowen DJ, Curry SJ et al. (1990) Nutrition
knowledge, attitudes and perceived norms as correlates of
selecting low-fat diets. Health Educ Res 5, 467–477.
Predicting food label use 413
27. Fagerlin A, Zikm und-Fisher BJ, Ubel PA et al. (2007) Measuring
numeracy without a math test: development of the subjective
numeracy scale. Med Decis Making 27, 672–680.
28. Dickson-Spillmann M, Siegrist M & Keller C (2011)
Development and validation of a short, consumer-oriented
nutrition knowledge questionnaire. Appetite 56, 617–620.
29. Higginson CS, Kirk TR, Rayner MJ et al. (2002) How do
consumers use nutrition label information? Nutr Food Sci
32, 145–152.
30. European Heart Network (2003) A Systematic Review of
the Research on Consumer Understanding of Nutrition
Labelling. Brussels: European Heart Network.
31. Jones G & Richardson M (2007) An objective examination
of consumer perception of nutrition information based on
healthiness ratings and eye movements. Public Health Nutr
10, 238–244.
32. Goldberg JH, Probart CK & Zak RE (1999) Visual search of
food nutrition labels. Hum Factors 41, 425–437.
414 R Hess et al.