Chi phí tĩnh của bảo hộ thương mại ở việt nam (tiếng anh)
Bạn đang xem bản rút gọn của tài liệu. Xem và tải ngay bản đầy đủ của tài liệu tại đây (234.85 KB, 24 trang )
CEPR Working Paper
WP-02/2008
The Static Costs of Trade Protection in Vietnam
Dao Nguyen Thang
Centre for Economic and Policy Research
College of Economics, Vietnam National University, Hanoi
CENTRE FOR ECONOMIC AND POLICY RESEARCH
COLLEGE OF ECONOMICS, VIETNAM NATIONAL UNIVERSITY HANOI
CEPR
C
ENTR
E FOR ECONOMIC AND POLICY RESEARCH
© 2008 Centre for Economic and Policy Research
College of Economics, Vietnam National University Hanoi
WP-02/2008
CEPR Working Paper
The Static Costs of Trade Protection in Vietnam
Dao Nguyen Thang
*
Email:
Abstracts
This study aims to evaluate the costs of trade protection in Vietnam and simulate the changes in
consumption structure, labor market as well as changes in social welfare under the context of
WTO membership. For these purposes, this research measure the costs of protection in 2003 for
three highly-protected industries of Vietnam such as steel, automobile and motorcycle. By
deploying the Computable Partial Equilibrium Model (CPEM) and the elasticity approach, the
costs of protection for these industries in 2003 were calculated of USD 1,093 million. The dead-
weight loss was around USD 30 million, the domestic producer’s gain was USD 390 million and
the Government’s gain in terms of tax revenue was USD 673.7 million. The paper also shows
that trade liberalization, under different assumptions, would reduce employment in the steel,
automobile and motorcycle industries by 5.3%, 6% and 3.5%, respectively.
Key words: Trade protection, trade liberalization, static cost, consumer surplus, producer surplus,
dead-weight loss, ad valorem, tariff barrier, non-tariff barrier.
JEL Classification Numbers: F13, F17
This working paper should not be reported as representing the views of the CEPR. The views
expressed in this working paper are those of the author(s) and do not necessarily represent
those of the CEPR.
*
I would like to thank Prof. Nguyen Khac Minh (Vietnam – Netherlands Center for Development Economics and
Public Policy (CDEPP), National Economics University) for his valuable suggestions. I am grateful to Dr Tu Thuy
Anh (Foreign Trade University) for her carefully reading and comments. Any shortcoming or error is of mine.
Content
1. Introduction 4
2. Theoretical Framework 5
2.1. The Computable Partial Equilibrium Model (CPEM) 5
2.2. The welfare effects of trade barriers 6
2.3. Supply and demand functions 7
2.4. Estimate Demand and Supply Elasticities 9
3. The static costs of trade protection 9
3.1. Selected goods 9
3.2. The elasticities of selected goods 10
3.3. Changes in of domestic and imported quantities and prices following liberalization 10
3.4. The Static Costs of Trade protection 11
3.4.1. Steel industry 11
3.4.2. Automobile industry 12
3.4.3. Motorcycle industry 13
3.6. Brief on dynamic effects of trade protection 14
4. Brief on Vietnamese foreign trade during two past decades and structure of protection 15
4.1. Vietnamese foreign trade during two past decades 15
4.2. Structure of protection 16
4.2.1. Import tariffs 16
4.2.2. Non-tariff barriers 17
4.3. Protection for the Steel, Automobile and Motorcycle industries after 2003 18
4.3.1. The steel industry 18
4.3.2. The Automobile industry 19
4.3.3. The Motorcycle industry 20
5. Policy Recommendations and conclusion remarks 20
5.1. Policy Recommendations 20
5.1.1. Steel industry 20
5.1.2. Automobile and Motorcycle industries 21
5.2. Conclusion remarks 22
References 23
1. Introduction
In the economic literature, many theories from classics such as Ricardian theory of comparative
advantage, to modern ones, such as Hecher – Ohlin – Samuelson model, as well as empirical
studies have proved the existence of benefits gained from free trade. Furthermore, countries with
a high level of trade distortions have lower productivity than those with fewer trade distortions.
For many different purposes, however, free trade does not absolutely exist in fact; and instead of
this, trade barriers have been set up to prevent the trade flow, distorting the free trade.
Generally, for a country, whenever protection is established, domestic consumers suffer a loss,
government and domestic producers gain. Hufbauer and Elliott (1994) employed CPEM and elasticity
approach to measure the costs of productions for 21 highly protected sectors, which covered a
domestic market worth almost USD 200 billion or 5% of total private consumption of the United
States (US) in 1990. The authors concluded that potential consumers gain if the US relaxed all tariffs
and quantitative restrictions on imports are in neighborhood of USD 70 billion (or equivalent to 1.3%
of US gross domestic product GDP) in 1990. Using the similar methodology, Yansheng et al. (1998)
measured the costs of protection for 25 highly protected sectors in China and found that the short-term
costs of trade liberalization would be substantial both in terms of lost domestic output (a drop about
USD 40 billion, or 32% of pre-liberalization output in the protected sectors) and lost jobs (about 11.2
million workers). Static benefits to consumers from fully liberalizing the protected sectors would
amount to USD 35 billion annually, and the annual pure efficiency gains would be USD 5 billion.
Vietnam applied to be WTO membership in 1995 considered important step toward economic
integration into the world economy, enhancing economic growth as well as increasing the social
welfare. In this process, an examination and establishing an effective protection structure are very
essential. So measuring the costs and benefits from trade protection in Vietnam would be necessary
from which policy makers will have better looks to situation of protection in Vietnam. Concerning the
cost of trade protection in Vietnam, there have been some studies by International Monetary Fund
(IMF), World Bank, Centre for International Economics, and researchers. However, most of them
were qualitative analyzed.
Self-evidently, measuring costs of protection quantitatively is a significant work. Basing on the
very rich background in the literature, this research measures the costs of protection in Vietnam in
2003 for three highly protected industries as steel, automobile and motorcycle industries. Beside the
purpose of calculating the costs and benefits from protection, the paper also provides policy
recommendations for WTO-based protection for Vietnam in the context of international economic
integration.
2. Theoretical Framework
2.1. The Computable Partial Equilibrium Model (CPEM)
The CPEM, which is used for measuring the costs of protection and social welfare, bases on four
relevant assumptions for a small and relative open economy like the Vietnam’s economy:
(i) Domestic goods and imported goods are not perfect substitutes;
(ii) The supply for imported goods is perfectly elastic;
(iii) The supply schedule for domestic goods slope upward (less than perfect elastic);
(iv) All markets are considered perfect competitive.
Figure 2.1: Effects in the import market of removing a trade barrier
With the trade barrier in place, the price of the imported good in the protected market is P
m
, and
the quantity imported is Q
m
. Following liberalization, the price falls to P
m’
(the world price).
Then, responding to a lower price in the domestic market (see Figure 2.2), the demand curve for
the imported good shifts from D
m
to D
m’
, and quantity imported settles at Q
m’
.
The static effects of relaxing a trade barrier are illustrated in Figures 2.1 and 2.2. In Figure 2.1, the
supply curve for import (S
m
) is flat implying an open economy as a “price taker” in the world market.
P
m’
is world price; with trade barrier in place, the landed price of imported good in home market is P
m
.
P
m
= P
m’
× (1 + t + n) (2.1)
P
P
m’
P
m
D
m’
D
m
S
m
Q
a
b
c
d
e
f
g
Q
m
Q
m’
Where t is tariff rate (percent ad valorem), and n is tariff equivalent of non-tariff barriers. After
trade liberalization, the landed price falls to P
m’
(the world price). Then, responding to the lower
price in the domestic market (see Figure 2.2), the demand curve for import shifts inward from D
m
to D
m’
, and quantity imported settles at Q
m’
, which is higher than the initial quantity imported, Q
m
.
Figure 2.2: Effects in the domestic market of removing a trade barrier
With the trade barrier in place, the price of the import-competing domestic good is P
d
, and the
quantity demanded is Q
d
. Following liberalization and the decline in import price (see Figure 2.1),
demand for the domestic substitute falls, shifting the demand curve from D
d
to D
d’
, the quantity
consumed falls to Q
d’
, and the price falls to P
d’
.
2.2. The welfare effects of trade barriers
Trade liberalization has a series of welfare effects. In the import market, due to trade
liberalization, the consumer surplus gain from liberalization is the area aceg (see Figure 2.2).
The area acfg is the transfers from government to consumer in the form of lost tariff. The
efficient gain is presented by the area cef. The rectangular area acfg represents a transfer from
government to consumers can be estimated as:
Area acfg = (P
m
– P
m
’) × Q
m
(2.2)
The area cef which presents efficient gain following trade liberalization is:
Area cef = )()(
2
1
'' mmmm
QQPP −×−× (2.3)
P
d’
Q
d’
Q
d
D
d’
D
d
w
P
d
Q
P
s
u
v
x
y
z
S
d
In Figure 2.2, the domestic supply curve for the import-competing domestic good (S
d
) slopes
upward. With the trade barrier in place, the price of the domestic good is P
d
, the quantity
demanded is Q
d
. Following liberalization and the decline in the import price (see Figure 2.1), the
demand curve for the domestic substitute shifts inward from D
d
to D
d’
, the quantity consumed
falls to Q
d’
, and the price drops to P
d’
. The consumer surplus gain from lower domestic price is
the area
swyz, which is offset by the producer surplus loss. The area swyz can be estimated as:
Area
swyz = )()(
2
1
'' dddd
QQPP +×−× (2.4)
Table 2.1: The welfare effects on the two markets following liberalization
Import market Domestic market Total gains
Consumer surplus
+ aceg + swyz + aceg + swyz
Producer surplus
- swyz - swyz
Government
- acfg - acfg
Efficiency gain
+ cef 0 + cef
2.3. Supply and demand functions
The model assumes that supply and demand relationships are nonlinear in absolute terms, but rather
are linear in logarithmic terms (Hufbauer and Elliott 1994; Yansheng et. al, 1998; Messerlin 2000).
The domestic supply and demand functions are specified according to the following equations:
dmdd
E
m
E
dd
PaPQ =
(2.5)
And
s
E
ds
bPQ =
(2.6)
In equation 2.5, E
dd
is the own-price elasticity of demand for the domestic good. E
dm
is the cross-
price elasticity of demand for the domestic good with respect to the price of the imported good.
In 2.6, E
s
is the own-price elasticity of the supply of the domestic good. Equilibrium in the
domestic market requires (Q
d
= Q
s
).
The demand and supply functions in the import market are:
mmmd
E
m
E
dm
PcPQ =
(2.7)
P
m
= P
m’
× (1 + t + n) (2.8)
In equation 2.7, E
md
is cross-price elasticity of demand for the imported good with respect to
price of the domestic good, while E
mm
is the own-price elasticity of demand for the imported
good. Equation 2.8 represents the assumption (ii), the world market CIF price, P
m’
, is the same
regardless of import quantity. This system of demand and supply functions can be converted into
a system of linear relationships by taking the logarithms to base e of equation 2.5, 2.6, 2.7, 2.8.
mdmdddd
PEPEaQ ln.ln.lnln
+
+
=
(2.9)
dss
PEbQ ln.lnln
+
=
(2.10)
mmmdmdm
PEPEcQ ln.ln.lnln ++=
(2.11)
lnP
m
= ln[P
m’
.(1 + t + n)] (2.12)
Equations 2.9, 2.10, 2.11, 2.12 are used to calculate the welfare effects of trade liberalization. The
calculation involves three steps: (i) estimate the elasticity parameters; (ii) estimate the protective
price premium (t + n) and substitute all values of the parameters and data into equations 2.9 through
2.12, together with the equilibrium condition Q
d
= Q
s
,
to find the protection quantities and welfare
effects; and (iii) we analyze the model’s results and derive realistic conclusions on impact of trade
protection.
Tariff elimination
We examine the case when a tariff is eliminated. By equalizing the right- hand sides of equation
2.6 and 2.7, we yield the new price of the domestic commodity as a function of the new import
price:
''
ln
lnln
ln
m
dds
dm
dds
d
P
EE
E
EE
ba
P ×
−
+
−
−
= (2.13)
The new import and domestic prices can be substituted into equations 2.9, 2.10 and 2.11 to yield
the new equilibrium quantities of import and domestic outputs.
Quota removal
If the new quantity of import, Q
m’
can be estimated, then from equation 2.8, we can find the new
import price as a function of both the new quantity imported and the new domestic price:
mm
dmdm
m
E
PEcQ
P
''
'
lnlnln
ln
−
−
=
(2.14)
Equations 2.13 and 2.14 can be solved together to yield the new prices: P
m’
, P
d’
.
2.4. Estimate Demand and Supply Elasticities
The five elasticities incorporated into the CPEM are fundamental parameters. To arrive at these
calculations, we can assume that the demand structure is of the “constant elasticity of substitution”
(CES) form. In the case the elasticity of substitution between the two commodities is available or
can be estimated, we can derive the estimates of the own-price elasticities of demand as:
].).1[(
dtdddd
ESSE +−−=
σ
(2.15)
].).1[(
dtmmmm
ESSE +−−=
σ
(2.16)
E
dt
is price elasticity of total demand, σ is elasticity of substitution between domestic and imported
goods; S
d
, S
m
are shares by value of the domestic and imported products in consumption, respectively.
Hufbauer and Elliott (1994) used the methodology developed by Tarr (1990) to calculate cross-price
elasticities in the case the own-price elasticities of demand and aggregate demand are known:
m
dddtd
md
S
EES
E
).(
+
−
=
(2.17)
d
mmdtm
dm
S
EES
E
).( +−
=
(2.18)
Finally, the elasticity of supply for the domestic goods can be estimated by:
θ
dm
dds
E
EE +=
(2.19)
Where
'
'
mm
dd
PP
PP
−
−
=
θ
is the coefficient of price response.
3. The static costs of trade protection
3.1. Selected goods
The criteria of selecting goods for measuring costs of protection bases on the import volume,
protection level, data availability and the purposes of protection. Protection level must considerably
affect consumer’s behavior. So these products below are selected to measure the costs of protection:
Table 3.1: Import turnover and share of steel, automobile and motorcycle in 2003
Items Turnover (USD million) Share per total import (%)
Total import 25,255.8 100.00
Steel 1,695.3 6.71
Automobile 738.2 2.51
Motorcycle 328.7 1.30
Source: MOT (2006), GSO (2006).
The purposes of trade protection are to encourage consuming domestic products to help domestic
producers compete external ones and government gets a source of revenue to cover government
expenditure.
3.2. The elasticities of selected goods
In order to facilitate computation to elasticities, it is assumed that the demand structure is of the
CES form. The elasticity of substitution between domestic and imported goods (
σ) and the price
elasticity of total demand (E
dt
), which are needed to calculate elasticities, were estimated by
Phan Huu Nhat Minh (2002) for two industries as Steel and Automobile. For the Motorcycle,
with availability level of data of domestic production and import, interval elasticities of own-
price demands are used as the best approximates.
Table 3.2: The elasticities of selected goods
E
dd
E
mm
E
md
E
dm
E
s
Steel
- 3.04 - 1.56 1.56 3.04 0.57
*
Automobile
- 0.20 - 0.22 0.22 0.20 0.71
*
Motorcycle
- 0.12 - 4.20 4.20 0.12 0.26
Source: Calculation of Author; figures with (*) are from Phan Huu Nhat Minh (2002).
3.3. Changes in of domestic and imported quantities and prices following liberalization
In 2003, Steel industry was protected by computed average ad valorem tariff rates imposed on
imported steel of 17.6%, Automobile was imposed an average tariff of 90% on imports. Motorcycle
was imposed an average tariff of 50% on imports. Suppose a rationale scenario of trade
liberalization to calculate cost of protection in Vietnam for selected goods as presented in Table 3.3:
Table 3.3: Hypothesis of trade liberalization
Goods Actual restriction Hypothesis
Steel Average tariff of 17.6 % Tariff of 5 %
Automobile Tariff of 90 % Tariff of 30 %
Motorcycle Tariff of 50 % Tariff of 5 %
These hypotheses are referenced from the AFTA and WTO commitments. Beside that, the
competitiveness and substitution between domestic and imported goods are also considered. In the
process of applying the regulations of AFTA and WTO, Vietnamese government cannot completely
eliminate all tariff imposed on imported goods. Because, if doing that, the imported goods will be
predominant compare to domestic ones, resulting to suffer domestic industries. By following these
assumptions, we are able to calculate the changes in quantities and prices due to protection reduction:
Table 3.4: The changes in quantities and prices due to protection reduction
Prices/Quantities Unit Steel* Automobile Motorcycle
P
d
1000 USD 0.289 29.614 1.530
P
d’
1000 USD 0.263 27.164 1.330
P
d
- P
d’
1000 USD 0.026 2.450 0.200
Q
d
Pieces 3,545.00 47,701 957,107
Q
d’
Pieces 3357.40 44,864 923,370
Q
d
- Q
d’
Pieces 187.60 2,837 33,737
P
m
1000 USD 0.431 43.732 2.610
P
m’
1000 USD 0.385 29.922 1.830
P
m
- P
m’
1000 USD 0.046 13.810 0.780
Q
m
Pieces 4,622.80 32,072 21,950
Q
m’
Pieces 4,754.04 34,116 54,962
Q
m
- Q
m’
Pieces - 131.24 - 1,856 - 33,012
Source: GSO (2006), and author’s calculation;
Note: (*) The quantity unit of steel is thousand tons
3.4. The Static Costs of Trade protection
3.4.1. Steel industry
In 2003, Steel industry was protected by four lines of tariff rate 5%, 20%, 30% and 35% (GRIPS
Development Forum 2003). Basing the import data of each kind of steel in 2003, the average ad
valorem tariff rate of steel was estimated as 17.6%.
According to the AFTA commitments all tariff rates are scheduled to reduce to 0-5% by 2006, and
the final tariff rate will come down to zero by 2015. Suppose that the average tariff rate would
reduce to 5%, trade liberalization would bring to the domestic consumer a surplus of USD 307.5
million, meanwhile the domestic producers and government would lose producer surplus and tax
revenue as USD 90.86 million and USD 211.6 million, respectively (Table 3.5). The efficiency gain
of the economy would be USD 3.03 million. By assuming number of workers proportional to
domestic quantity produced, the reduction in employment due to the effect of the trade
liberalization can be estimated:
Reduction in employment due to the trade liberalization (%) = %100)1(
'
×−
d
d
Q
Q
(3.1)
Table 3.5: Effects of trade liberalization on Steel industry (Millions of dollars unless noted)
Consumer surplus gain
Producer surplus loss
Tariff revenue loss
Efficiency gain
Reduction in employment (%)
307.500
90.857
213.611
3.032
5.3%
Base-year data (2003)
Post-liberalization estimates
Import price (P
m
)
(Thousand dollars/ton)
0.431
Import price (P
m
)
(Thousand dollars/ton)
0.385
Import volume (Q
m
)
(Thousand tones)
4,622.8
Import volume (Q
m
)
(Thousand tones)
4,754
Domestic price (P
d
)
(Thousand dollars/ton)
0.289
Domestic price (P
d
)
(Thousand dollars/ton)
0.263
Domestic output (Q
d
)
(Thousand tones)
3,545
Domestic output (Q
d
)
(Thousand tones)
3,357
PARAMETERS
Elasticities
Constants
Price effects of barrier
E
dd
- 3.04
Lna
6.96
E
mm
- 1.56
Lnb
8.88
Average ad valorem tariff (%) 17.6
E
md
1.56
Lnc
9.06
E
dm
3.04
E
s
0.57
Total tariff assumed eliminated
(%)
12.6
Source: GSO (2006) and author’s calculation
3.4.2. Automobile industry
Automobile industry has been protected by a very high tariff rate (in 2003, it was of 90%).
Assume that the tariff rate of imported automobile was reduced by 60%. Compare to the fact of
protection, trade liberalization would bring to the domestic consumer a surplus of USD 570.4
million, the domestic producers and government would lose producer surplus and tax revenue as
USD 113.4 million and USD 442.9 million, respectively. The efficiency gain of the economy
would be USD 14.1 million. By also assuming the number of workers is proportional to quantity
of domestic production, the reduction in employment of the Automobile industry due to the
trade liberalization would be 6%.
Table 3.6: Effects of trade liberalization on Automobile industry (Millions of dollars unless noted)
Consumer surplus gain
Producer surplus loss
Tariff revenue loss
Efficiency gain
Reduction in employment (%)
570.449
113.420
442.912
14.117
6%
Base-year data (2003)
Post-liberalization estimates
Import price (P
m
)
(Thousand dollars/unit)
43.732
Import price (P
m
)
(Thousand dollars/unit)
29.922
Import volume (Q
m
)
(Pieces)
32,072
Import volume (Q
m
)
(Pieces)
34,116
Domestic price (P
d
)
(Thousand dollars/unit)
29.614
Domestic price (P
d
)
(Thousand dollars/unit)
27.164
Domestic output (Q
d
)
(Pieces)
47,701
Domestic output (Q
d
)
(Pieces)
44,864
PARAMETERS
Elasticities
Constants
Price effects of barrier
E
dd
- 0.20
Lna
10.69
E
mm
- 0.22
Lnb
8.37
Average ad valorem tariff (%) 90
E
md
0.22
Lnc
10.46
E
dm
0.20
E
s
0.71
Total tariff assumed eliminated
(%)
60
Source: GSO (2006) and author’s calculation.
3.4.3. Motorcycle industry
Motorcycle industry is one of key industries promoted in the industrialization process of Vietnam.
Up to 2003, , it had been highly protected with tariff rate of 50%. According to the tariff reduction
schedule, Vietnam has to gradually reduce the tariff rate imposed on imported motorcycle. The
import tariff rate of motorcycle in terms of AFTA regulations is 0-5%. So, in this case, suppose
that Vietnam reduced tariff rate of imported motorcycle down to 5% from 50%. This would bring
to the domestic consumer a surplus of USD 215.7 million, meanwhile the domestic producers and
government would lose producer surplus and tax revenue as USD 185.6 million and USD 17.2
million, respectively. The efficiency gain of the economy as a whole would be USD 14.1 million.
The reduction in employment due to the trade liberalization would be 3.6%.
Table 3.7: Effects of trade liberalization on Motorcycle industry (Millions of dollars unless noted)
Consumer surplus gain
Producer surplus loss
Tariff revenue loss
Efficiency gain
Reduction in employment (%)
215.720
185.603
17.190
12.927
3.6%
Base-year data (2003)
Post-liberalization estimates
Import price (P
m
)
(Thousand dollars/unit)
2.61
Import price (P
m
)
(Thousand dollars/unit)
1.83
Import volume (Q
m
)
(Pieces)
21,950
Import volume (Q
m
)
(Pieces)
54,962
Domestic price (P
d
)
(Thousand dollars/unit)
1.53
Domestic price (P
d
)
(Thousand dollars/unit)
1.33
Domestic output (Q
d
)
(Pieces)
957,107
Domestic output (Q
d
)
(Pieaces)
923,370
PARAMETERS
Elasticities
Constants
Price effects of barrier
E
dd
- 0.16
Lna
13.68
E
mm
- 4.20
Lnb
13.66
Average ad valorem tariff (%) 50
E
md
4.20
Lnc
12.24
E
dm
0.16
E
s
0.26
Total tariff assumed eliminated
(%)
45
Source: GSO (2006) and author’s calculation.
3.6. Brief on dynamic effects of trade protection
Findings in the preceding sections are just static effects of trade protection. This section briefly refers
some dynamic effects of trade liberalization based on the static findings. One of computable
dynamic effects of trade liberalization is the effect on employment. Basing on the change in
domestic production, the reduction on employment of the automobile, motorcycle and steel
industries were estimated as around 6%, 3.6% and 5.3%, respectively. These effects may be not
good for the economy. However, following trade liberalization, the competitiveness of domestic
products could be improved thank to changing in management toward better situation and increasing
in research as well as applying advanced technologies to enhance productivity. This is very
important, particularly in the long run and in the context of speeding up industrialization and
modernization, to make domestic products stronger in competing as Vietnam integrates into the world
economy. High protection might not create motivations for domestic producers to increase their
productivities in some cases. This is also considered as a cost of protection that is difficult to
measure.
What have been mentioned so far are just the effects of protection occurring within a given industry.
The trade protection does not only have simply intra-industrial effects but also inter-industrial ones.
For instance, steel is primary input for other industries such as construction, ship building,
automobile , mmotorcycle nad so on If the imported steel is imposed with a high tariff, the costs of
production of some related industries would increase, which in turn would hamper competitiveness
of domestic products and have adverse impacts on their export as well as domestic consumption.
These adverse impacts are surely taken into account as costs of protection that are also difficult to
measure. One of the adverse effects of high trade protection is that it always withstand with
smuggling as well as possible illegal trade activities and entail additional costs to combat these
problems. This has been big problem, particularly in the context of rampant corruption in
Vietnam and governance system, the execution and administration of the nation’s law of
Vietnam is still weak in enforcement. This should be considered the dynamic costs of protection.
4. Brief on Vietnamese foreign trade during two past decades and structure of protection
4.1. Vietnamese foreign trade during two past decades
In 1986, Vietnam initially launched its transition from centrally - planned economy to market
economy. The innovation of “private production and business” was generally a break-through for
private sector development since 2000. With the application of “market price structure” economic
sectors or “Vietnam would like to be friend of all nations and territories in the world” in foreign
policy, Vietnam has gradually established and expanded import – export markets in the direction
of multilateral relationships. The average of total merchandise trade during 1986 – 2005 was USD
20.7 billion (a seven-fold increase over 1985). The annual average growth rate of exports was
21.2%. Export value increased near forty-fold, from USD 789 million in 1986 to USD 32.4 billion
in 2005. The share of exports in total trade increased steadily from 35.7% in the 1986 – 2000 up to
46% in the 2001 – 2005. The annual average growth rate of import was 16.1%. The import value in
2005 (USD37 billion) was sixteen-fold increase compared to one in 1986 (GSO, 2006).
Table 4.1: Total merchandise trade and the annual average growth rate
1986 – 90 1991 – 95 1996 – 2000 2001 – 05
Total merchandise trade (Million USD) 19,717 39,940 113,440 240,981
Five-year growth index (%) 115.1 123.4 117.9 118.5
Annual growth rate (%) 15.1 21.4 17.2 18.2
Exports (Million USD) 7,032 17,156 51,825 110,830
Five-year growth index (%) 130.7 119.3 122.1 117.9
Annual growth rate (%) 28 17.8 21.6 17.5
Imports (Million USD) 12,685 22,784 61,615 130,151
Five-year growth index (%) 108.5 127.3 115 119.1
Annual growth rate (%) 8.2 24.3 13.9 18.8
Balance of Trade (Million USD) - 5,653 - 5,628 - 9,789 -19,321
Source: GSO (2006).
4.2. Structure of protection
4.2.1. Import tariffs
Table 4.2: Import tariff structure in Vietnam – 1995, 1997, 2001, 2003, 2004 and 2006
1995 1997 2001 2003 2004
*
2006
*
Year
Tariff lines
Number
% Number
% Number
% Number
% Number
% Number
%
0 976 31.1
978 31.3
2,049 32.5
1,620 31.7 3,087 28.8
1,349 12.9
1 – 5 645 20.5
697 22.3
1,170 18.7
878 17 1,919 18 2,197 21.1
5 – 10 299 9.6 301 9.6 540 8.6 412 7.9 1,054 9.9 1,869 17.9
10 – 15 66 2.1 96 3.1 0 0 103 2 176 1.6 922 8.8
15 – 20 572 18.2
317 10.2
0 0 418 8.2 857 8 1457 14
20 – 25 40 1.3 46 1.4 3 0 43 0.8 122 1.1 169 1.6
25 – 30 215 6.9 244 7.8 649 10.3
487 9.5 1,164 10.9
1,108 10.6
30 – 40 193 6.1 279 8.9 667 10.6
601 11.8
986 9.2 836 8
40 – 60 104 3.2 152 4.8 586 9.3 513 10 1,001 9.3 183 17.5
60 – 80 10 0.3 7 0.3 2 0 9 0.1 28 0.3 66 0.63
80 – 100 1 0 2 0.1 50 0.8 16 0.3 292 2.7 268 2.62
> 100 14 0.5 6 0.2 8 0.1 7 0.1 12 0.1 5 0.05
Total tariff line 3,135 100 3,126 100 5,724 90.9
5,170 100 10,689 100 10,429 100
Total tariff bands
36 35 15 60 17 33
Range 0 to 200% 0 to 200% 0 to 120% 0 to 113% 0 – 150 % 0 – 150 %
Mean tariff rate 12.8 13.4 15.7 16.65 16.39 % 15.24 %
Coefficient of
Variation (CV)
131 128 116.3 114.77 124.4 115.3
Note: Coefficient of Variation = (standard deviation/mean) × 100%.
Sources: Athukorala (2005), figures with (
*
) are calculated by the author from the tariffs
reduction schedules provided by MOF (2004, 2006).
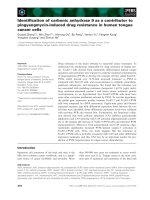
The non-weighted average tariff has remained unchanged much since 2001 (in the range 15.2%
– 16.65%). The dispersion of tariff rates (measured by coefficient of variance) fluctuated over
time, after declining persistently from 1995 to 2003, it increased again to 124.4% by 2004, then
declined at 115.3% by 2006. Thus, compared to previous years, the level of trade protection of
Vietnam after 2003, in general, there have been virtually no reductions in terms of tariffs.
Figure 4.1: Evolution of tariff structure in Vietnam during the past decade
115.3
15.24
16.39
16.65
15.7
13.4
12.8
131
128
116.3
124.4
114.77
0
20
40
60
80
100
120
140
1995 1997 2001 2003 2004 2006
year
%
mean of tariff rates coefficient of variance
According to WTO accession commitments,, Vietnam has to reduce tariff rates by from 5% to
40%, and time for implementation will be mainly taken from 2008 to 2015. For the automobile
industry, the implementation dates will be by 2017 and 2019. Thus, for some products, there is
still a long time of high protection.
4.2.2. Non-tariff barriers
By 2006, protection by quotas was mainly applicable to agriculture products such as sugarcane,
eggs, salt, and so on. According to WTO commitment, most of them will be eliminated by 2009.
Compared to products subject to Quantitative Restriction (QR) before 2003, which were
manufactured and processed products, products subject to QR by 2006 are agriculture ones with
low value added. So, the objects to be protected after 2003 were producers in agriculture sector.
Table 3.4: Products subject to Quantitative Restriction (QR)
1998 1999 2000 2001 2002 2003
Petroleum Petroleum Petroleum Petroleum Petroleum Petroleum
Sugar Sugar Sugar Sugar Sugar Sugar
Fertilizer Fertilizer Steel Steel Cement
Steel Steel Cement/Clinker Cement/Clinker Motorcycles
Cement/Clinker Cement/Clinker Glass Motorcycles
Glass Glass Motorcycles Cars
Motorcycles Motorcycles Cars Vegetable oil
Cars Cars Paper
Paper Paper Vegetable oil
Electric fan
Ceramic tiles
Porcelain
Caustic soda
Bicycles
Vegetable oil
Plastics
Plastic packaging
Source: Parker and Riedel (2002); Athukorala (2005).
4.3. Protection for the Steel, Automobile and Motorcycle industries after 2003
4.3.1. The steel industry
In fact, in 2004, 2005 and 2006 the tariff imposed on the steel products did not change much
compared to 2003. The tariff ranges were from 0 to 35%. The changes in the tariff rates were
accordant with the scenario of tariff reduction which was recommended by GRIPS Development
Forum (2003). According to this scenario, there were some steel to be reduced tariff rate by 5%
to 10% beginning in 2004 and to be kept constant until year 2009. Some products even will be
reduced tariff rate by 2013. There will have been long period of protection for this industry.
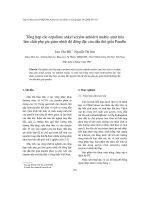
The quantity and value of both domestic production and import increased over year since 2003.
The growth rates of import values are greater than ones of import quantities implying the
average price of steel increased. Meanwhile the tariff rate lines imposed on the Steel unchanged
much in 2004, 2005 and 2006 compared to 2003. So, it can be predicted that the cost of
protection for the Steel industry after 2003 were even greater than in year 2003. Under the
commitment to WTO, most of tariff rates imposed on steel will be reduced by 5 to 15% mainly
implemented by 2014. So, the protection policy for this industry should be reconsidered.
Figure 4.2: Import and domestic production in the Steel industry
3545
3949.1
4616.9
4622.8
5186.1
5524
0
1000
2000
3000
4000
5000
6000
2003 2004 2005
Year
Quantity (1000 tonnes)
Domestic production Import
Source: GSO (2006)
4.3.2. The Automobile industry
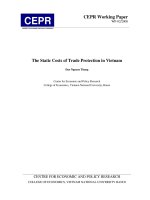
Figure 4.3: Import and domestic production in the Automobile industry
47701
50954
64033
32072
30684
34538
0
10000
20000
30000
40000
50000
60000
70000
2003 2004 2005
Year
Quantity (Unit)
Domestic production Import
Source: GSO (2006)
So far, the tariff imposed on the Automobiles has been still 90% (MFN rate). The tariff on the
Automobile will be reduced at the rate of 52% implementing by 2017 and 2019. By 2006, the
imported automobile, besides imposing on high import tax and VAT, it also be imposed special
sale tax. Also since 2006, Vietnamese Government has permitted to import used car. To protect
the domestic producers, the imported used cars have been imposed a fixed amount before
imposing other taxes. There have been three levels as USD 7,000, USD 10,000 and USD 15,000
(applicable to different kinds of cars). These levels of protection are considered rather high. In
early year 2007, the MOF approves to reduce these fixed amounts. The levels of reduction are
10%, 15% and 20% applicable to cars with engine cylinder capacity of 1000 – 1500cc, over 1500
– 2,000cc and over 2000 – 3000cc, respectively. The used automobiles with engine cylinder
capacity of over 3000cc will be not reduced the tariff rate. For ones with cylinder capacity of over
5,000 even will be more strictly protected by increasing the fixed amount by 5% (MOF, 2007).
4.3.3. The Motorcycle industry
Figure 5.4: Domestic production in the
motorcycle industry
975.11
2019.70
1828.40
0.00
500.00
1000.00
1500.00
2000.00
2500.00
2003 2004 2005
Year
Quantity (Thousand units)
Figure 4.5: Import value in the Motorcycle
industry
38.2
45.2
54.1
0
10
20
30
40
50
60
2003 2004 2005
Year
Value (Million USD)
The domestic production in this industry sharply increased over years, particularly in year 2004.
Meanwhile the import volume did not increase much in terms of absolute value. This shows that
the protection in this industry was rather efficient in the context the motorcycle demand sharply
increased. Since the domestic production increased sharply compared to import value, it can be
predicted from the findings of year 2003 that the domestic producers would gain the most from
protection after 2003. According to the commitment to be a member of the WTO, Vietnam will
reduce the tariff rate imposed on imported motorcycle at 35% implemented by 2012. So, after
2003, there has been a long period of high protection for this industry. The cost of protection for
this industry in 2003 was rather high (USD 215.720 million), and it would still high by years after
2003. This requires a re-consideration for the protection policy for this industry.
5. Policy Recommendations and conclusion remarks
5.1. Policy Recommendations
5.1.1. Steel industry
• Keep on the plan of reduction in tariff
The capacity of domestic production of this industry is not strong enough to meet the demand.
Some steel products even have not been able to be produced in local areas. Importing steel
definitely increase along with economic development. The figures presented in the previous
sections show that gradual elimination of tariff would not affect unemployment. Trade
liberalization should not be so fast as to destroy potential domestic producers and also not be so
slow to allow inefficient producers surviving. So, reducing tariff along with the plan of the
requirement of AFTA to expand import and limit the dead-weight loss is very necessary.
• Strengthen the productivities and improve the economic of scale
In order to improve the competitiveness of domestic steel and increase the capacity of domestic
production, the government should initiatively organize large scales of production to get the
economies of scale. So, the structure of production should be revised, reconstructed and
reinvested to increase productivity. In addition, the domestic distribution system should be
developed to reduce the costs of distribution, which will contribute to increase the
competitiveness of domestic products. Simultaneously, while we are doing that, a large number
of jobs will be created, solving the problem of unemployment in the trade liberalization process.
5.1.2. Automobile and Motorcycle industries
• Gradually eliminate the protection
So far, the Automobile and Motorcycle industries have brought large amount of tax from import.
So the immediate complete elimination of all tariff imposed on these importables would not be
relevant. In addition, complete elimination of tariff will certainly increase unemployment
causing bad effects on the society such as poverty and social problems. So, elimination of tariff
in these industries should be carried out gradually and should be planned in detail.
• Develop supportive industries and post-sale service activities
Under the effects of the trade liberalization, unemployment in these industries is likely to
increase since domestic production would decrease due to the stronger competition from
imported products. To offset this effect, the government should initiatively develop the
supportive industries and enhance post-sale service activities. Furthermore, this will possibly
makes the domestic products become more competitive.
• Strengthen the alliance among domestic enterprises
It is very important that domestic enterprises share their experience and technology so that
productivity will go up and the quality of the products will be improved. In the process of trade
liberalization, protection of selected goods will no longer exist; these industries will face with
stronger competition with high quality products from international enterprises. So, strengthening
the cooperation among domestic enterprises including the assemblers and supportive enterprises
is an urgent mission to ensure the development of these industries.
5.2. Conclusion remarks
The findings of this research, considered as empirical results, as well as the theory both come
to the conclusion that trade liberalization is an indispensable mission and deterministic trend in
Vietnam in terms of the aspects of the costs and benefits analysis of trade protection. However,
keep in mind that the trade liberalization process should be carried out gradually and be planned in
detail to limit possible negative effects from liberalization. This process is also required to be
combined and coordinated with other detail actions and policies to solve problems due to trade
liberalization such as the unemployment, the competitiveness of domestic products, etc.
References
1. Athukorala, P. (2005), Trade Policy Reforms and the Structure of Protection in Vietnam,
Research School of Pacific and Asian Studies, Australian National University.
2. Auffret, P. (2003), Trade Reform in Vietnam: Opportunities with Emerging Challenges, The
World Bank, East Asia and Pacific Region, Poverty Reduction and Economic Management
Sector Unit.
3. Bhagwati, J.N. and Panagaria, A. and Srinivasan, T.N. (1998), Lectures on
International Trade – Second edition, Massachusetts Institute of Technology.
4. Department General of Vietnam Customs (2003), The 2003 Customs Yearbook on
Foreign Merchandise Trade, Nam Hai Publisher - Department General of Vietnam
Customs, Hanoi.
5. Elena I. and Will M. and Wood C. (2001), Economic Effects of the Vietnam – US
Bilateral Trade Agreement, The World Bank.
6. Goulder, L.H et al. (1998), The Cost-effectiveness of Alternative instruments for environmental
protection in a second-best setting, [
www.rff.org/Documents/RFF-DP-98-22.pdf, accessed 25
th
April, 2006].
7. GRIPS Development Forum (2003), A Proposal for the Steel Industry in Vietnam
Realistic Policy Options for an Import-Substitution Industry,
, accessed 25
th
August 2006].
8. GSO. (2006), The Vietnamese International merchandise Trade for twenty years
Renovation 1986 – 2005, Statistical Publishing House, Hanoi.
9. Hufbauer, G.C. and Elliott, K.A. (1994), Measuring the Costs of Protection in the
United States, Institute for International Economics, Washington DC.
10. IMF (2001), Vietnam: Selected issues and Statistical Appendix, IMF Staff Country Report No
SM/01/334.
11. John, C.W. (2001), The Mineral Industry of Vietnam,
[
accessed 1
st
September 2006]
12. Messerlin, P.A. (2001), Measuring the Costs of Protection in Europe: European
Commercial Policy in the 2000s, Institute for International Economics, Washington DC.
13. Mishima, K. (2005), The Supplier System of Motorcycle Industry in Vietnam, Thailand and
Indonesia – Localization, Procurement and Cost Reduction Processes,
[
www.vdf.org.vn/IndustrialBook05/10-MISHIMA-Motorbike%20Suppliers.pdf , accessed
25
th
August 2006]
14. MOI. (2006), Six Weaknesses of Vietnamese Automobile industry,
[
accessed 6
th
September,
2006]
15. MPI. (2004), Vietnam – Japan Joint Initiate to improve Business Environment with a view
to strengthen Vietnam’s Competitiveness,
[ accessed 6
th
September 2006]
16. Panagariya, A. (2002), Alternative approaches to Measuring the Costs of Protection,
[
:8089/eps/it/papers/0308/0308002.pdf, accessed 25
th
April,
2006]
17. Phan Huu Nhat Minh. (2002), Measuring the Costs of Protection in Vietnam, National
Economics University, Hanoi.
18. Riedel, J. and Parker, S. (2002), An Assessment of the Economic Impact of the United
States – Vietnam Bilateral Trade Agreement, The National Political Publishing House,
Hanoi.
19. Sazanami, Y. and Urata, S. and Kawai, H. (1995), Measuring the Costs of Protection in
Japan, Institute for International Economics, Washington DC.
20. Tarr, D.G. and Morkre M. (1984), Aggregate Costs to the United States of Tariffs and
Quotas on Imports: General Tariffs Cut and Removal of Quotas on Automobile, Steel,
Sugar, and Textiles, Bureau of Economics Staff Report, Washington DC.
21. The International Customs Journal (2005), Bulletin International Des Douanes –
Vietnam, Journal No.185 (1
st
Edition), ISSN 1378 – 4048.
22. Vietnam Economic News Online (2005), Cracking down on Smuggling,
[
accessed 7
th
September 2006]
23. Vousden, N. (1990), The Economics of Trade Protection, Cambridge University Press.
24. Wall, H.J. (1999), Using the Gravity Model to estimate the Costs of Protection, Review –
February 1999, Federal Reserve Bank of St. Louis.
25. Yansheng, Z. and Zhongxin, W. and Shuguang, Z. (1998), Measuring the Costs of
Protection in China, Institute for International Economics, Washington DC.