capillary electrophoresis guidebook
Bạn đang xem bản rút gọn của tài liệu. Xem và tải ngay bản đầy đủ của tài liệu tại đây (19.7 MB, 340 trang )
CHAPTER1
Fundamentals
of Capillary
Electrophoresis
Theory
Kevin D. Altria
1. Introduction
This section will describe the fundamental theory, equations, and definitions necessary to comprehend the concepts involved in capillary electrophoresis (CE). This is not an exhaustive treatment, but is considered
sufficient to comprehend and appreciate the principles of CE. More
detailed theoretical background can be obtained from a number of reference books (I-6). Developments in the field of CE are reviewed in detail
annually in the journal Analytical Chemistry. For example, the 80 1 papers
published in 1992-l 993 were recently reviewed (7).
CE can be broadly described as high-efficiency separations of sample
ions in a narrow bore (25-100 pm) capillary tube that is filled with an
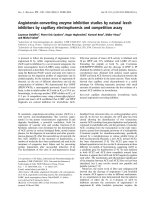
electrolyte solution. A typical schematic of an instrument setup is shown
in Fig. 1.
The principal components are a high-voltage power supply, a capillary that passes through the optical center of a detection system connected to a data acquisition device, a sample introduction system, and an
autosampler. Typically, the CE instrument is controlled by a personal
computer.
The capillary is first filled with the required buffer solution. Sample
solution (typically l-20 nL) is then introduced at the end of the capillary
away from the detector (usually the anode). The capillary ends are then
dipped into reservoirs containing high-voltage electrodes and the
required buffer solution. One electrode is connected to a cable leading to
From
Methods
m Molecular
Bology,
Vol 52 Capdary
Electrophoresrs
Ed&d by K Altrla CopyrIght
Humana Press Inc , Totowa, NJ
3
Altria
4
n
High voltage supply
Empty vial
0
Fig. 1. Typical instrumental setup.
the high-voltage output, whereasthe other (situatedat the detector end of
the capillary) is connectedto an earthing cable. Electrodesare composed
of an inert material, such as platinum. Application of a voltage (for
example, 10-30 kV) across the capillary causes electrophoretic and
electroendosmoticmovements(discussedlater in this chapter) resulting
in the ionic speciesin the samplemoving along the capillary and passing
through the on-line detector. A plot of detector response(usually UV
absorbance) time is generated,
with
which is termedan electropherogram.
1.1. Electrophoresis
This processis the movementof sampleions under the influence of an
applied voltage. The ion will move toward the appropriateelectrodeand
passthrough the detector. The migration rate, or mobility, of the solute
ion is governed largely by its size and number of ionic charges. For
instance, a smaller ion will move faster than a larger ion with the same
number of charges.Similarly, an ion with two chargeswill move faster
than an ion with only one charge and similar size. The ionic mobility
(pE) is therefore related to the charge/mass
ratio (Eq. [ 11).
(1)
Fundamentals
of CE Theory
5
Detector response
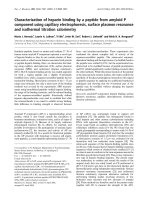
Fig. 2. Theoretical separation of a range of catrons.
where PE = electrophoretic mobility, CJ number of charges, IJ = solu=
tion viscosity, and r = radius of the ion.
Therefore, when we separate a hypothetical mixture of ions havmg
different charges and sizes, the smaller, more highly charged ions will be
detected first (Fig. 2).
The actual electrophoretic velocity, or speedof the solute ions, is related
to their mobilities and the magnitude of the applied voltage (Eq. [2]).
v=pEE
(2)
where v = velocity of the ion and E = applied voltage (volts/cm).
1.2. Electra-Osmotic
Flow (EOF)
Application of voltage across a capillary filled with electrolyte causes
a flow of solution along the capillary. This flow effectively pumps solute
ions along the capillary toward the detector. This flow occurs because
of ionization of the acidic silanol groups on the inside of the capillary
when m contact with the buffer solution. At high pH, these groups are
dissociated resulting in a negative charged surface. To maintain electroneutrality, cations build up near the surface. When a voltage is applied,
these cations migrate to the cathode (Fig. 3). The water molecules solvating the cations also move, causing a net solution flow along the capillary (Fig. 3). This effect could be considered an “electric pump.”
The extent of the flow is related (Eq. [3]) to the charge on the capillary, the buffer viscosity, and dielectric constant of the buffer:
pEOF=(&&/q)
(3)
where pEOF = “EOF mobility,” IJ = viscosity, and 6 = Zeta potential
(charge on capillary surface).
6
Altria
Ftg. 3. Schematicof electroendosmoticflow.
The level of EOF is highly dependent on electrolyte pH, since the &,
potential is largely governed by the ionization of the acidic silanols.
Below pH 4, the ionization is small (8), and the EOF flow rate is therefore not significant. Above -pH 9, the silanols are fully ionized and EOF
is strong. The pH dependence of EOF is shown in Fig. 4. The level of
EOF decreases with increased electrolyte concentration as the 6 potential is reduced.
The presence of EOF allows the separation and detection of both
cations and anions within a single analysis, smce EOF is sufficiently
strong at pH 7, and above, to sweep anions to the cathode regardless of
their charge. Analysis of a mixture of cations, neutral compounds, and
anions would result in the electropherogram shown in Fig. 5. The migration times correspond to the time the individual peaks pass through the
detector.
The smaller anions fight more strongly against the EOF and are therefore detected later than anions with a lower mobility. Multiply charged
anions will migrate more strongly against the EOF and will be detected
later. Therefore, pH is clearly identified as the major operating parameter affecting the separation of ionic species, smce it governs both the
solute charged state and the level of EOF.
The overall migration time of a solute is therefore related to both the
mobility of the solute and EOF. The term apparent mobility @A) is
measured from the migration time, and is a sum of both yE and pEOF:
PA = pE + JJEOF= (ZL/ tV)
(4)
where I= length along the capillary (cm) to detector, V = Voltage,
and L = total length (cm) of the capillary.
Fundamentals
of CE Theory
7
15
1
05
0
3
4
5
6
I
9
PH
Fig. 4. Varlatron of EOF with pH.
Mobility values can be calculated from migration times when both
ionic and neutral components are measured. For instance, in the separation of a five-component mixture shown in Fig. 5, the mobility values for
the peaks are calculated and given in Table 1.
Example peak 2 =
IA = (1L/ Vt) = (50 x 57 / 30,000 x 500) = 1.9 x lOA
vEOF (from peak 3) = (IL / Vt) = (50 x 57 / 30,000 x 600) = 1.58 x 10q
j~E=pA-pEOF=0.32x
IO4
The negative values of PE for peaks 4 and 5 indicate that they are anions.
The separation of ions is the simplest form of CE and is often termed
Free Solution Capillary Electrophoresrs (FSCE). The separations rely
Altria
8
Frg. 5 Theoretical
separation
Calculated Mobility
of a range of ionic and neutral solutes.
Table 1
Values for the Peaks m Fig. 5
Peak no
Mlgratlon time, s
PA cm2/Vs
1
2
3
4
5
400
500
600
750
900
2.38 x lo”
190x1@
1.58 x 1W’
1.27 x lo”
1.06 x lti
PE
080x lOA
0 32 x lOA
0
-031 x lOA
-052 x 10“
I = 50 cm, L = 57 cm, and V = 30,000 V
principally on the pH-controlled dissociation of acidic groups on the solute or the protonation of basic functions on the solute.
In FSCE, all neutral compounds are swept, unresolved, through the
detector together (Fig. 5). Separation of neutrals is generally achieved by
incorporation of anionic surfactant, at sufficient concentration to form
micelles. These anionic micelles migrate against the EOF and can chromatographically interact with neutral solutes. Solutes having a large
interaction will migrate later than those having little or no interaction.
Use of micellar solutions is known as micellar electrokinetic capillary
chromatography (also called micellar electrokinetic chromatography)
and is covered in depth in Chapter 12, which is coauthored by the originator of the technique.
When dealing with large biomolecules, such as nucleic acids, their
electrophoretic mobilities may be very similar, and FSCE is often insufficient for adequate resolution. In this case, separations are performed in
Fundamentals
of CE Theory
capillaries filled with gel solutions. In Capillary Gel Electrophoresis
(CGE), a sieving effect occurs as solutes of various sizes migrate through
the gel filled capillary toward the detector. Chapter 13 describes the exceptional, efficient separations that can be obtained in gel filled capillaries.
The separation and quantitation of chiral samples are an important area
in many industries. Highly efficient chiral CE separations (Chapter 14)
can be obtained by the addition of chirally selective substances, such as
cyclodextrins, into the electrolyte.
Capillary electrochromatography (CEC), which is a hybrid between
CE and HPLC, has been developed. In this technique, CE equipment is
used to generate HPLC-type separations. Capillaries are filled with
HPLC packing material, and the application of a voltage results in the
EOF pumping the mobile phase through the capillary. The full details of
this technology and some applications are given in Chapter 15, which is
written by one of the initial developers of the technique.
1.3. Sample
Introduction
Sample can be introduced into the capillary by three techniques, all of
which involve immersing the capillary end into the sample solution and
exerting a force to inject sample into the capillary. The three mechanisms for introduction of sample solution into the capillary are hydrodynamic, gravity, and electrokinetic. All these methods are quantitative,
and equations describing the volumes injected have been derived. Figure
6 shows the principles of operation for the three methods.
1.3.1.
Pressure Differential
In this method, the sampling end of the capillary is immersed in the sample
solution and a pressure difference applied (positive pressure or vacuum).
The volume of sample solution injected onto the column can be calculated:
Volume = AP d411t / 128 q L
(5)
where AP = pressure difference (mbar), q = buffer viscosity, L = total
capillary length, and d = capillary diameter (pm).
Table 2 gives injection volumes (9) for l-s injections using 65-cm
capillaries of varying bore, TJ= 1, and various AP values. These volumes
generally correspond to sample plug lengths of
is important to match the viscosities of the samples and standards. Temperature, therefore, has a large influence on injection volume, since vis-
10
Al tria
Hydrodynamic
Pre
Siphoning
Electrokinetic
Fig. 6. Diagram
of the three sample mtroduction
methods.
Table 2
Inlectlon Volumes / s for Various Capillary Bores
AP
50 pm
75 pm
100 pm
50 mbar
75 mbar
100 mbar
1 OnL
1 5 nL
2.0 nL
5 2 nL
7 8 nL
104nL
164nL
246nL
32.8 nL
cosity is inversely proportional to temperature. For example, raising the
temperature from 20 to 25°C causesthe viscosity of water to change from
1.00 to 0.89 (IO). Therefore, it is essential to employ a constant temperature during routine operation to ensure reproducible injection volumes.
The sampling pressure or vacuum setting is generally instrument-specific with the sampling variable being time. Lists are available from
Fundamentals
of CE Theory
instrument suppliers that equate a sampling time to the respective volume of sample (on the order of l-20 nL) introduced into the capillary.
1.3.2. Gravity Injection
In this method (II), the capillary, while dipping into the sample vial,
is mechanically raised above the height of the detector electrolyte vial.
Typically, the sample vial may be raised 5 cm for 10 s. The volume
injected (12) may be calculated:
Volume = (pgAH d41YI/ 128 q 15)
t
(6)
where AH = height difference (cm), g = gravitational constant, and p =
density of the liquid.
An injection volume of 6.35 nL can be calculated for a 10-s injection
at 5 cm using a capillary length of 67 cm and capillary diameter of 75 urn.
The following values are employed in this calculation assuming water as
the buffer at 20°C density is 0.99707g/mL, viscosity is 0.8904 x 1O-2
g/cm/s, g is 980 cm/s2. The sampling variables with this technique are
time and the height the sample is raised.
1.3.3. Electrokinetic
In this method, the sampling end of the capillary and the high-voltage
electrode are inserted into the sample solution. A voltage is then applied,
causing solute ions to enter the capillary by electrophoretic migration and
EOF. A greater number of more mobile ions enter the capillary, which
can lead to sample bias effects. This effect can be turned to advantage
(1.3), especially when attempting to quantify trace levels of small ions.
The amount introduced during electrokinetic sampling is related to a
variety of factors (Eq. [6]).
Q=[(~E+uEOF)VlY-Ir*Ct/L]
(7)
where Q = amount injected, C = concentration of sample, and r = capillary radius.
The sampling variables are the level and polarity of voltage, and sampling time.
Various modifications to these sample introductory procedures can be
used to increase the volume of sample solution introduced onto the capillary dramatically. This has considerable benefit in terms of increased
sensitivity. The various schemes reported are reviewed in Chapter 16 by
the two most active developers of these techniques.
12
Altria
1.4. Peak EfCciency
The capillary format employed in CE minimizes most sources of band
broadening that occur in conventional electrophoresis or m HPLC.
l
l
l
Joule heating-the heat generated within the capillary during the voltage
appllcatlon IS effectively dlsslpated through the capillary walls, which
reduces convection-related band broadening encountered m conventional
electrophoresrs;
On-column detection-a portion of the capillary is used asthe detector, which
ehmmates postseparation broadening effects owing to connections, and
EOF flow dynamics-the flow profile of EOF is plug-like m nature,
which mmlmlzes sample dispersion during solute transport along the capillary, compared to the lammar flow encountered m pumped systems,
such as HPLC.
The major dispersive effect remaimng in CE is that of molecular diffusion of the solute as it passesalong the capillary. This diffusion IS lowest for large molecules, such as proteins, which have small diffusion
coefficients. Therefore, it is possible to obtain theoretical plate counts
(N) of several million for biomolecules, such as nucleotldes and proteins
(Chapters 17 and 19, respectively). The theoretical plate count can be
calculated:
N= pEV/2D
(8)
where D = diffusion coefficient.
References
1 Ll, S F. Y , ed (1992) Capillary Electrophoresls, Prmclples, Practice and Applecatzons Elsevler.
2 Kuhn, R and Hoffstetter-Kuhn, eds. (1993) Capillary Electrophoresls
Prznclples
and Practzce. Springer-Verlag, Berlin.
3. Wernberger, R , ed ( 1993) Practical Capdlary Electrophorew. Acadermc, London
4. Grossman, P. D. and Colburn, J C., eds. (1992) Capillary Electrophoreszs’ Theory
and Practice Academic, London
5 Vmdevogel, J. and Sandra, P., eds, (1992) Introduction to Mlcellar Electrobnetrc
Chromatography
Huthlg, Heidelberg
6. Camllleri, P., ed. (1993) m Capillary Electrophoresls
Theory and Practrce CRC,
Boca Raton, FL
7. Monmg, C A. and Kennedy, R T. (1994) Capillary electrophoresls Anal Chem
66,28OR-3 14R
8 Altna, K. D. and Simpson,C. F (1987) High voltage capillary zoneelectrophoresis: operating parameter effects upon electroendosmotlc flows and electrophoretic
mobllities. Chromatographla, 24, 527-530
Fundamentals
of CE Theory
9 Heiger, D N. (1994) m High Performance
10
11
I2
13
13
Capdaly Electrophoresu,
Hewlett
Packard, Waldbronn
Rush, R S and Karger, B. L. (1990) Beckman Techmcal Bulletm TIBC 104
Rose, D. J and Jorgenson, J. W. (1988) Characterisation and automation of sample
mtroduction methods for capillary electrophoresis. Anal Chem 60,642-648
Olechno, J D , Tso, J M Y , Thayer, J , and Wamwright, A (199 1) Znt Lab May,
42-48.
Jackson, P E and Haddad, P R. (1993) Optimisatron of inJection technique m
capillary electrophoresis for the determination of trace levels of anions m environmental samples J Chromatogr 640,48 l-487
CHAPTER2
Standard
Commercial
Description
Kevin
Instrument
D. Altria
1. Introduction
Commercial instruments have been available since 1988, and systems
are currently available from over 20 suppliers. Recent survey papers have
considered the relative performance and features of these commercial
systems (1,2). Systems are available in both single bench-top units or in
modular form. Figure 1 shows a photograph of a commercial unit. Currently the CE equipment market is dominated by the major HPLC instrument supply companies, such as Beckman (Fullerton, CA), Hewlett
Packard (Waldbronn, Germany), Perkin Elmer (Foster City, CA), and
Waters (Milford, MA).
2. High-Voltage
Supply
Separations are normally performed employing voltages in the region
of 5-30 kV. Electrolyte ionic strengths are generally selected during
method development, such that application of these voltages generates
currents of 10-100 p-IA. Operations with currents above this level may
lead to unstable, irreproducible operating conditions. On many instruments, it is possible to operate by applying constant voltage (most common), constant current, or constant power across the capillary. However,
constant voltage is the most commonly employed operational mode.
3. Capillaries
Generally, these are composed of fused silica with typical dimensions
25-100 pm wrde and 25-100 cm long. The exact length and bore of the
From
Methods
III Molecular
B/ology, Vol 52 CapNary
Electrophoresls
Edtted by K Altna Copyright
Humana Press Inc , Totowa, NJ
15
16
Altria
Fig. 1. Photographof commercial instrument.
capillary are optimized during method development.The capillaries are
covered with a protective layer of polyimide, which is strongly UV
absorbent. sectionof this polyimide coatingis removedto allow on-capilA
lary detection. Details regarding capillary treatment are given later in
Section 7.4. of Chapter3. Capillaries can also have an internal coating to
alter selectivity, and thesemay have specific handling requirements.
Capillary volumes are on the order of a few microliters. For example,
the approximate volume of a 50-pm wide, 50-cm long capillary is 1 pL.
The volume can be calculated:
Volume = (7c S / 4)
L
(1)
4. Capillary Cartridge
Many commercial instrumentshave a cartridge-like device in which
the capillary is retained. This arrangementgives improved mechanical
Standard
Commercial
Instrument
17
support and guarantees consistent alignment of the capillary m the optical center of the detector. The ends of the capillary protrude from the
cartridge and dip into the autosampler vials. The cartridge is manually
inserted into the instrument and is then clamped into place to ensure
optical alignment. Cartridges are used in conjunction with cooling systems. The cartridge may be either filled with a coolant fluid, or cooled air
may be blown through the cartridge. In instruments with liquid coolant,
the cartridge is filled with a fluorocarbon liquid that is maintained at the
required temperature. Longer lengths of capillary are coiled on a spool
within the cartridge. Capillaries are located and held by screws in
noncartridge-based instruments. Particular attention should be paid to
the alignment of the capillary in the optical center of the detector (see
Section 7.4. of Chapter 3).
If the capillary becomes blocked or broken, the cartridge should be
fitted with a new capillary. Detailed specific instructions for this procedure are given in the instrument manuals.
5. Air Supply
The majority of instruments employ a regulated air supply that is used
to perform rinses and hydrodynamic sample injection. Individual instruments have specific requirements (detailed in the operating manuals) m
terms of the type of gas required and the pressure settings.
6. Temperature
Control
Both the sample volume injected and solute migration times are
strongly dependent on temperature. Therefore, it is important that a consistent temperature be maintained throughout an analytical sequence to
ensure good migration time and peak area precision. Approaches to this
are instrument-specific and involve the use of Peltier cooling devices,
forced air cooling, and heating ovens. Temperature ranges typically
employed are 20-50°C. Several instruments also offer the option of
cooled autosamplers, which may be of benefit when analyzing temperature-sensitive samples.
7. Commercial
Detection
Systems
All commercial instruments have W absorbancedetection as standard,
and several now have diode array detection. The majority of CE methods
employ UV absorbance detection. A few selected instruments also offer
the possibility of fluorescence or laser-induced fluorescence detection.
18
Altria
The UV absorbance detectors are srmilar in format to those routmely
encountered in HPLC. Operating wavelengths range between 190 and
760 nm, depending on the mstrument. The UV lamps employed are similar to those employed in HPLC. Some instruments are fitted with filters,
which limits the choice of wavelengths. The typical portion of capillary
exposed for detection purposes is 200 x 50 pm. These tmy dimensions
require excellent focusing of light from the UV lamp through the capillary. This focusing is achieved through appropriate use of high-quality
lens and/or fiber optics.
8. Safety
Given the possible hazards associated with voltages of this level, particular attention is paid to ensuring adequate safety precautions by electrical interlocks. Inadvertent attempts to access the autosampler during
operation will cause shutdown of the instrument.
9. Data Acquisition
Device
The output from a standard CE instrument is similar to that of an HPLC
detector, i.e., plot of UV absorbance with time. Peak integration is the
preferred method of quantitatton.
10. Personal Computer
Controller
The majority of CE systems are controlled by an external PC that
externally controls all functions of the instrument. The operating parameters for each injection are preprogrammed into the PC controller. For
routine analysis, an identical set of parameters can be applied to a number of samples.
The flexibility of a PC controller is of great benefit during method
development, where the instrument can be preprogrammed to evaluate
several operating parameters m an unattended sequence. Less elaborate
systems are available that are manually programmed from a front panel
on the instrument.
11. Autosampler
Typical autosampler capacity ranges from 20-50 samples. Sample
volume requirements range from as little as 10 pL to 5 mL. Numerous
injections can be made from a single vial, since the injection volumes are
on the order of a few nanoliters. Autosamplers can also be preprogrammed to perform mrcropreparative fraction collection (see Chapter 9).
Standard
Commercial
Instrument
19
12. Consumables
Autosampler vials and caps are instrument-specific and may only be
available from the equipment suppliers. However, suitable alternatives
may be available from other sources. Several reagent suppliers, such
as Fluka, and CE equipment suppliers are now developing reagent ranges
specifically purified and certified for use as CE reagents. Reagents available include prepared buffers, SDS solutions, and electrolyte systems for
performing inorganic anion and cation determinations.
References
1 Oda, R P., Spelsberg, T C , and Landers, J P (1994) Commercial capillary electrophoresis mstrumentatlon. LC-GC 12, 50,5 1
2 Watzlg, H. and Dette, C (1993) Precise quantitatwe capillary electrophoresls.
Methodological and instrumental aspects. J Chromatogr 636,3 l-38
CI-I.~PTER
Typical
Operating
Kevin
3
Procedures
D. Altria
1. Introduction
The CE instrument is controlled by a PC. The instrument settings are
defined on the PC in method files. Settings, such as temperature, autosampler vial positions, injection parameters, and rinse cycles, are defined
in the steps within the method. A typical method is given below. The
exact settings for the parameters are determined during method development. A method can be run for a single sample. To analyze several
samples, a sequence is created in which the method, number of
samples, and injection repetitions are defined. A typical method listing is given below. Additional information concerning each process
is then described.
Set temperature:Select appropriatetemperature
Rinse 1: 1-min 0. 1MNaOH (or equivalent to regenerate capillary surface)
Rinse 2: 2-min operating electrolyte
Set detector: autoselection of selected h and AUFS range
Injection: selected time and mode of injection
Separate:selectedtime and applied voltage level, detectorautozero, and
integrator autostart
2. Set Temperature
It is important to set an operating temperature, since both injection
volume and migration time are temperature-related. Typical operating
ranges are 20-50°C.
From
Methods
m Molecular
Brology, Vol 52 Capillary
Electrophoresls
Ed&d by K Altrla CopyrIght
Humana Press Inc , Totowa, NJ
21
Al tria
22
3. Rinse
1 (Regenerating
Rinse)
In this step, the capillary is flushed with a solution to clean the
capillary surface. This may be performed to remove unquantified
components of the previous injection, adsorbed materials, or to rehydrate
surface silanols on the capillary. The settings will be defined durmg
the method development. Typically, a 2-min rmse with O.lMNaOH may
be performed with the drops of liquid displaced from the capillary
collected into an empty vial. The rinse time and autosampler positions for the empty vial and regenerating solution vial are entered
into the method.
4. Rinse
2 (Electrolyte
Rinse)
The capillary is rinsed and filled with the run electrolyte. This allows
the capillary to adjust to the pH of the electrolyte. A typical rinse time
may be 3 min with the displaced drops from the capillary again being
collected in an empty vial. The rinse time and autosampler posittons for
the empty vial and electrolyte vial are entered.
5. Set Detector
The wavelength, absorbance range, detector rise time, and autozero
details are set during this step. If indirect detection is employed, then this
option is selected at this stage.
6. Injection
The time and mode of injectron are designated in this step along with
the autosampler position of the sample vial. See Chapter 1 for a description of the various sample injection techniques available. Hydrodynamic injection is routinely employed, although electrokinetic injection
may be selected for sample matrix or sensitivity reasons. Since different instruments have varied hydrodynamic sampling settings, it may be
appropriate to define an mjection volume, in nanoliters, in addition to
sampling time.
7. Separate
Details regarding analysis time, autosampler positions of electrolyte
vials, and the operating voltage are specified in thts step. It is normal to
operate with a constant voltage. However, it is possible to perform analysis employing constant power or current.
23
Typical Operating Procedures
8. Preanalysis
Procedures
1. Install capillary and turn lamp on to warm up for 20 min.
2. Filter the electrolyte, If appropriate, using a 0.45~pm filter or eqmvalent.
3. Fill autosampler vials with electrolyte, regeneration solution, and sample
as required. Ensure vials are adequately filled and that air bubbles are
avoided.
4. Place the vials m the positions designated in the method and/or sequence.
5. Assign integrator to collect detector signal.
6. Perform a test separation to ensure appropriate performance. This may
involve reference to systemsuitability criteria detailed in a specific method.
9. Postanalysis
Procedures
1. Rinse the capillary, typically using a 2-min rinse from a vial contammg
distilled water.
2. Flush the capillary with air, typically employmg a 2-min rinse from an
empty vial.
3 Remove the capillary and store. If the instrument 1sto be used again with
the same capillary, it 1sbest to leave the Instrument setup, since this avoids
the possibility of damage to the capillary ends.
4. Turn off the lamp and instrument.
5. Remove vials and dispose of accordingly.
10. Good Working
Practices
The following points are noted, which, if adopted, will maximize the
quality of the data.
1. Reagent quality-Use only AnalaR-grade reagents or better. Specific
reagents are available in specially purified form, specifically for electrophoresis. Water should be doubly distilled or HPLC grade to minimize
background UV absorbance and ionic strength. Prepared electrolytes are
now available from suppliers (see Chapter 2, Section 12.).
2. Electrolyte preparation and storage--Electrolyte should be prepared and
stored in plastic bottles. If pH adjustment of the electrolyte is reqmred, the
pH should be checked prior to use. Alternatively, the pH-unadjusted electrolyte should be stored and pH adjusted immediately prior to use. Glass
storage bottles should be avoided since material (principally metal ions)
leaches from the glass with time, causing an increase m pH. A suitable
shelf life may be assigned as 1 mo, unless specifically determined.
3. Capillary storag+Following use,the capillary should be rinsed with dlstllled
water and flushed with air. To flush with air, an empty autosampler vial is
placed on the autosampler and a rinse step performed from the empty vial.
24
Altria
4. Conditionmg analyses-It is useful to conduct analyses of blanks or
equtvalent at the start of a sequence to allow the system to settle.
5. Electrolyte filtration-Electrolyte
should be filtered through a 0.45~pm
filter or simrlar to remove particulates. Particulates would appear as apparent noise spikes on the detector baseline. Samples should also be filtered if
particulate matter is presented. If sample filtration is performed, adequate
recovery should be demonstrated during method validation.
6 Lamp warm-up-It is advisable to allow 15 mm for the lamp to achieve a
steady baseline. If a filter mstrument 1s employed, the appropriate filter
should be selected to allow the titter to reach the operating temperature.
7. Sample warm-up-The temperature within the autosampler tray can be
significantly higher than room temperature. Therefore, it 1s advisable to
place the samples on the instrument prior to the mltiation of the sequence
This allows samples to reach a constant temperature, which is needed for
consistent inlection volumes. This requirement can be avoided if conditioning analyses are conducted (see step 4).
8. Maintenance-To reduce the likelihood of instrument failure owing to
voltage leakage, the instrument should be regularly cleaned with cotton
wool or tissue dampened with water to remove traces of electrolyte.
9. Blanks-Blanks of dissolvmg solvent and/or matrix should be analyzed at
the start of each sequence to allow the system to equilibrate.
10. Contammation-The cleanlmess of glassware and purity of dissolvmg solvent or water should be checked, especially if attempting to quantify trace
levels of ions.
11. Buffer depletion-Electrolysts ofthe electrolyte during electrophorests can
significantly alter the concentratton and nature of the electrolyte, This
effect, termed “buffer depletton,” will be exhibited by shifts m migration
time and peak area. Buffer replenishment, or the use of different buffer
vials during a sequence, will mimmtze the effect of buffer depletion. Buffers should be used within their buffering pH range.
12. Capillary dedication-Separate capillaries should be reserved for each
method to avoid cross contamination effects.
11. Capillary
Preparation
The following points should be considered during the preparation of a
capillary prior to commencing use. These are essential to ensure that a
repeatable separation is possible when switching between capillaries.
11 .l. Capillary
Dimensions
The internal and external diameter and the length (L) of the capillary
should be specified in the method (see Fig. 1). A length of capillary
25
Typical Operating Procedures
I
L
where
I = length to detector
L = total length
Fig. 1. Capillary lengths.
should be measured and cut to a length slightly over that required. This
allows some excess for trimrning to the exact length required. The length
to the detector window (1) should also be marked prior to polyimide
removal. Capillaries coated with a UV transparent material are available from Supelco (Bellefonte, PA) and do not require polyimide
removal. However, these are unsuitable for use with liquid coolant-based
cartridges.
11.2. Capillary
Coating
Removal
The fused silica capillaries generally used in CE are coated with
polyimide to provide mechanical strength, because the exposed capillary
is fragile. This coating strongly absorbs UV light and it is therefore necessary to remove the coating in the area of capillary that is to be used as
the window for on-column detection. The exact distance along the capillary to the window (I) is instrument-specific and will be given in the
instrument manual.
The coating can be removed by several methods. The simplest method
is to place the window area of the capillary briefly (ml s) in a low-heat
flame from a burner or match. Avoid unnecessary time in the flame
because this may cause the capillary to bend. The coating will char and
the burned material can be gently removed employing a tissue dampened
with methanol. If all the coating is not removed, further exposure to the
flame is required. Alternatively, the coating can be removed by gently scraping the window area with a scalpel blade. An eyepiece or
lens should be used to ensure that all the coating has been removed
from the window, Commercial capillary window burning units have
recently become available that employ a wire resistor. Application of
a current across the resistor causes it to heat, which is sufficient to
26
Altria
Fig. 2. Capillary cartridge assembly.
burn off the coating material. Use of these, or similar units, is recommended because these produce a reproducible capillary window with
minimal effort. It is recommended that you carefully wipe the window area with a methanol-dampened tissue to remove any remaining
burned polyimide.
The capillary window is fragile following removal of the coating and
should be handled as little as,possible to avoid breakage. In addition, the
window area should not be touched, because grease will get onto the
capillary window thereby reducing light throughput.
11.3. Capillary
Installation
The capillary housing is different for individual equipment manufacturers. In several instruments, the capillaries are held in cartridges
whereas in others the capillary is held by retaining devices. The cartridges often incorporate a spool around which the capillary is spooled
(Fig. 2). In all cases it is essential to align the window area of the
capillary in the optical centre of the capillary housing device. Exact
details of this aligning process will be given in the instrument manual.
27
Typical Operating Procedures
The alignment should be checked wherever possible using an eyepiece or lens.
The ends of the capillary should be trimmed to the required length
using a cutting stone to ensure a neat edge. The cutting stone should
be used to lightly score the capillary and cut through the polyamide
protection. Use of excessive force will result in the capillary end
being crushed. If the capillary end is not cut correctly, peak tailing
and poor precision may be obtained because sample solution can
become irreproducibly trapped in the jagged end of the capillary.
Depending on the instrument, this trimming may be needed prior to
window alignment.
Careful measurements of the capillary length are required to ensure
correct alignment of the capillary during installation. Use of too long a
length can result m the capillary becoming broken during operation. If
the capillary is too short, it will not dip into the electrolyte reservoirs or
sample solution.
11.4. Capillary
Surface
Rehydration
The majority of capillaries employed in CE are composed of uncoated
fused silica. Fused silica is treated in a high-temperature oven and the
surface therefore has no residual silanols. To rehydrate this surface, a
rinse with a high pH solution is required (I). Following this rinse the
surface silanols are restored and a consistent electroendosomotic flow
(EOF) is possible. It is recommended that a rinse with O.lMNaOH for at
least 20 min should be used to regenerate the capillary prior to its initial
use. The capillary should then be filled with the method-specific electrolyte. A voltage should be applied across the capillary for 20-30 min prior
to injection of the first sample. This procedure is to allow time for the
capillary to stabilize and to achieve a consistent EOF level. This stabilization period could alternatively be accomplished by incorporation of
appropriate blank injections at the beginning of a sequence. Use of
rehydration steps for capillary coatmgs should be avoided unless prescribed in the instructions supplied with the capillary.
Once the capillary is regenerated, it is not necessary to rehydrate it
with an extended NaOH rinse before each subsequent use, providing that
it is stored correctly. The capillary should be labeled and reserved for use
solely for a selected electrolyte. Failure to do this may result in severe
problems with irreproducible separations.