Capillary electrochromatography
Bạn đang xem bản rút gọn của tài liệu. Xem và tải ngay bản đầy đủ của tài liệu tại đây (3.75 MB, 251 trang )
Preface
Preface
Due to their versatility and resolution, chromatographic separations of complex
mixtures of biologicals are used for many purposes in academia and industry. If
anything, recent developments in the life sciences have increased the interest
and need for chromatography be it for quality control, proteomics or the downstream processing of the high value products of modern biotechnology. However, the many “challenges” of present day chromatography and especially of the
HPLC of biomacromolecules such as proteins, are also present in the mind of
any practitioner. In fact, some of these latter were such hindrances that much
research was necessary in order to overcome and circumvent them. This book
introduces the reader to some of the recently proposed solutions. Capillary electrochromatography (CEC), for example, the latest and most promising branch of
analytical chromatography, is still hindered from finding broader application by
difficulties related to something as simple as the packing of a suitable column.
The latest solutions for this but also the state of art of CEC in general are discussed in the chapter written by Frantisek Svec. The difficulty of combining
speed, resolution and capacity when using the classical porous bead type stationary phases has even been called the “dilemma of protein chromatography”.
Much progress has been made in this area by the advent of monolithic and related continuous stationary phases. The complex nature of many of the samples to
be analyzed and separated in biochromatography often requires the use of some
highly specific (“affinity”) ligands. Since they can be raised in a specific manner
to many bioproducts, protein ligands such as antibodies have allowed some very
selective solutions in the past. However, they also are known to have some disadvantages, including the immunogenicity (toxicity) of ligands contaminating
the final products, or the low stability of such ligands, which prevents repeated
usage of the expensive columns. This challenge may be overcome by “molecular
imprinting”, a techniques, which uses purely chemical means to create the
“affinity” interaction. Finally we were most happy to have two authors from
industry join us to report on their experience with chromatography as a continuous preparative process. Readers from various fields thus will find new ideas
and approaches to typical separation problems in this volume. Finally, I would
like to thank all the authors for their contributions and their cooperation
throughout the last year.
Lausanne, April 2002
Ruth Freitag
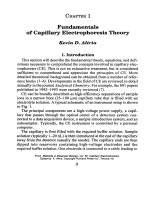
CHAPTER 1
Capillary Electrochromatography:
A Rapidly Emerging Separation Method
Frantisek Svec
F. Svec, Department of Chemistry, University of California, Berkeley, CA 94720-1460, USA.
E-mail:
This overview concerns the new chromatographic method – capillary electrochromatography
(CEC) – that is recently receiving remarkable attention. The principles of this method based
on a combination of electroosmotic flow and analyte-stationary phase interactions, CEC instrumentation, capillary column technology, separation conditions, and examples of a variety
of applications are discussed in detail.
Keywords. Capillary electrochromatography, Theory, Electroosmotic flow, Separation, Instrumentation, Column technology, Stationary phase, Conditions, Applications
1
Introduction
. . . . . . . . . . . . . . . . . . . . . . . . . . . . .
2
2
2.1
Concept of Capillary Electrochromatography . . . . . . . . . . .
Electroosmotic Flow . . . . . . . . . . . . . . . . . . . . . . . . .
3
4
3
CEC Instrumentation . . . . . . . . . . . . . . . . . . . . . . . . .
8
4
4.1
4.1.1
4.2
4.3
4.4
4.5
4.5.1
4.5.2
Column Technologies for CEC .
Packed Columns . . . . . . . .
Packing Materials . . . . . . . .
Open-Tubular Geometry . . . .
Replaceable Separation Media .
Polymer Gels . . . . . . . . . .
Monolithic Columns . . . . . .
“Monolithized” Packed Columns
In Situ Prepared Monoliths . . .
.
.
.
.
.
.
.
.
.
.
.
.
.
.
.
.
.
.
.
.
.
.
.
.
.
.
.
.
.
.
.
.
.
.
.
.
.
.
.
.
.
.
.
.
.
.
.
.
.
.
.
.
.
.
.
.
.
.
.
.
.
.
.
.
.
.
.
.
.
.
.
.
.
.
.
.
.
.
.
.
.
.
.
.
.
.
.
.
.
.
.
.
.
.
.
.
.
.
.
.
.
.
.
.
.
.
.
.
.
.
.
.
.
.
.
.
.
.
.
.
.
.
.
.
.
.
.
.
.
.
.
.
.
.
.
11
11
14
16
22
24
24
25
26
5
5.1
5.1.1
5.1.2
5.2
5.3
Separation Conditions . . . . . . . . . .
Mobile Phase . . . . . . . . . . . . . . .
Percentage of Organic Solvent . . . . . .
Concentration and pH of Buffer Solution
Temperature . . . . . . . . . . . . . . . .
Field Strength . . . . . . . . . . . . . . .
.
.
.
.
.
.
.
.
.
.
.
.
.
.
.
.
.
.
.
.
.
.
.
.
.
.
.
.
.
.
.
.
.
.
.
.
.
.
.
.
.
.
.
.
.
.
.
.
.
.
.
.
.
.
.
.
.
.
.
.
.
.
.
.
.
.
.
.
.
.
.
.
.
.
.
.
.
.
.
.
.
.
.
.
32
34
34
36
39
41
6
Conclusions and Future Outlook
7
References . . . . . . . . . . . . . . . . . . . . . . . . . . . . . . . 43
.
.
.
.
.
.
.
.
.
.
.
.
.
.
.
. .
.
.
.
.
.
.
.
.
.
.
.
.
.
.
.
.
.
.
. . . . . . . . . . . . . . . . . . 42
Advances in Biochemical Engineering/
Biotechnology, Vol. 76
Managing Editor: Th. Scheper
© Springer-Verlag Berlin Heidelberg 2002
2
F. Svec
1
Introduction
The recently decoded human genome is believed to be a massive source of information that will lead to improved diagnostics of diseases, earlier detection of
genetic predispositions to diseases, gene therapy, rational drug design, and pharmacogenomic “custom drugs”. The upcoming “post-genome” era will then target the gene expression network and the changes induced by effects such as disease, environment, or drug treatment. In other words, the knowledge of the exact
composition of proteins within a living body and its changes reflecting both
healthy and sick states will help to study the pharmacological action of potential
drugs at the same speed as the candidates will be created using the methods of
combinatorial chemistry and high throughput screening. This approach is assumed to simplify and accelerate the currently used lengthy and labor-intensive
experiments with living biological objects. To achieve this goal, new advanced
very efficient and selective multidimensional separation methods and materials
must be developed for “high-throughput” proteomics [1, 2]. The limited speed
and extensive manual manipulation required by today’s two-dimensional gel
electrophoresis introduced by O’Farrell 25 years ago [3] is unlikely to match the
future needs of rapid screening techniques due to the slow speed and complex
handling of the separations, and the limited options available for exact quantification [4]. Therefore, new approaches to these separations must be studied [5].
Microscale HPLC and electrochromatography are the top candidates for this mission since they can be included in multidimensional separation schemes while
also providing better compatibility with mass spectrometry, currently one of the
best and most sensitive detection methods [6].
After several decades of use, HPLC technology has been optimized to a very
high degree. For example, new columns possessing specific selectivities, drastically reduced non-specific interaction, and improved longevity continue to be developed. However, increases in the plate counts per column – the measure of column efficiency – have resulted almost exclusively from the single strategy of
decreasing the particle size of the stationary phase. These improvements were
made possible by the rapid development of technologies that produced well-defined beads with an ever-smaller size. Today, shorter 30–50 mm long column
packed with 3 µm diameter beads are becoming the industry standard while
150–300 mm long columns packed with 10-µm particles were the standard just
a few years ago [7]. Although further decreases in bead size are technically possible, the lowered permeability of columns packed with these smaller particles
leads to a rapid increase in flow resistance and a larger pressure drop across the
column. Accordingly, only very short columns may be used with current instrumentation and the overall improvement, as measured by the efficiency per column, is not very large. In addition, the effective packing of such small beads presents a serious technical problem. Therefore, the use of submicrometer-sized
packings in “classical” HPLC columns is not practical today and new strategies
for increasing column efficiency must be developed.
Another current trend in HPLC development is the use of mini- and microbore columns with small diameters, as well as packed capillaries that require
Capillary Electrochromatography: a Rapidly Emerging Separation Method
3
much smaller volumes of both stationary and mobile phases. This miniaturization
has been driven by environmental concerns, the steadily increasing costs of solvent disposal, and, perhaps most importantly, by the often limited amounts of
samples originating from studies in such areas as proteomics. The trade-off between particle size and back pressure is even more pronounced in these miniaturized columns. For example, Jorgenson had to use specifically designed hardware that enabled operating pressures as high as 500 MPa in order to achieve an
excellent HPLC separation of a tryptic digest in a 25 cm long capillary column
packed with 1-mm silica beads [8].
In contrast to mechanical pumping, electroendoosmotic flow (EOF) is generated by applying an electrostatic potential across the entire length of a device,
such as a capillary or a flat profile cell.While Strain was the first to report the use
of an electric field in the separation of dyes on a column packed with alumina [9],
the first well documented example of the use of EOF in separation was the “electrokinetic filtration” of polysaccharides published in 1952 [10]. In 1974, Pretorius
et al. realized the advantage of the flat flow profile generated by EOF in both thinlayer and column chromatography [11]. Although their report did not demonstrate an actual column separation, it is frequently cited as being the foundation
of real electrochromatography. It should be noted however that the term electrochromatography itself had already been coined by Berraz in 1943 in a barely
known Argentine journal [12].
The real potential of electrochromatography in packed capillary columns
(CEC) was demonstrated in the early 1980s [13–15]. However, serious technical
difficulties have slowed the further development of this promising separation method [16, 17]. A search for new microseparation methods with vastly
enhanced efficiencies, peak capacities, and selectivities in the mid 1990s revived the interest in CEC. Consequently, research activity in this field has expanded rapidly and the number of published papers has grown exponentially.
In recent years, general aspects of CEC has been reviewed several times [18–24].
Special issues of Journal of Chromatography Volume 887, 2000 and Trends in
Analytical Chemistry Volume 19(11), 2000 were entirely devoted to CEC and a
primer on CEC [25] as well as the first monograph [26] has recently also been
published.
2
Concept of Capillary Electrochromatography
Capillary electrochromatography is a high-performance liquid phase separation
technique that utilizes flow driven by electroosmosis to achieve significantly improved performance compared to HPLC. The frequently published definition that
classifies CEC as a hybrid of capillary electrophoresis (CE) and HPLC is actually
not correct. In fact, electroosmotic flow is not the major feature of CE and HPLC
packings do not need to be ionizable. The recent findings by Liapis and Grimes
indicate that, in addition to driving the mobile phase, the electric field also affects
the partitioning of solutes and their retention [27–29].
Although capillary columns packed with typical modified silica beads have
been known for more then 20 years [30, 31], it is only now that both the chro-
4
F. Svec
Fig. 1. Flow profiles of pressure and electroosmotically driven flow in a packed capillary
matographic industry and users are starting to pay real attention to them. This
is because working with systems involving standard size columns was more
convenient and little commercial equipment was available for the microseparations. This has changed during the last year or two with the introduction
of dedicated microsystems by the industry leaders such as CapLC (Waters),
UltiMate (LC Packings), and 1100 Series Capillary LC System (Agilent) that
answered the need for a separation tool for splitless coupling with high resolution mass spectrometric detectors. Capillary µHPLC is currently the simplest
quick and easy way to clean up, separate, and transfer samples to a mass spectrometer, the feature valued most by researchers in the life sciences. However,
the peak broadening of the µHPLC separations is considerably affected by the
parabolic profile shown in Fig. 1 typical of pressure driven flow in a tube [32].
To avoid this weakness, a different driving force – electroosmotic flow – is employed in CEC.
2.1
Electroosmotic Flow
Robson et al. [21] in their excellent review mention that Wiedemann has noted
the effect of electroosmosis more than 150 years ago. Cikalo at al. defines electroosmosis as the movement of liquid relative to a stationary charged surface under an applied electric field [24]. According to this definition, ionizable functionalities that are in contact with the liquid phase are required to achieve the
electroosmotic flow. Obviously, this condition is easily met within fused silica
capillaries the surface of which is lined with a number of ionizable silanol groups.
These functionalities dissociate to negatively charged Si–O– anions attached to
the wall surface and protons H+ that are mobile. The layer of negatively charged
functionalities repels from their close proximity anions present in the surrounding liquid while it attracts cations to maintain the balance of charges. This
leads to a formation of a layered structure close to the solid surface rich in
Capillary Electrochromatography: a Rapidly Emerging Separation Method
5
Fig. 2. Scheme of double-layer structure at a fused silica capillary wall. (Reprinted with per-
mission from [24]. Copyright 1998 Royal Chemical Society)
cations. This structure consists of a fixed Stern layer adjacent to the surface covered by the diffuse layer. A plane of shear is established between these two layers. The electrostatic potential at this boundary is called z potential. The doublelayer has a thickness d that represent the distance from the wall at which the
potential decreases by e–1. The double-layer structure is schematically shown in
Fig. 2. Table 1 exemplifies actual thickness of the double-layer in buffer solutions
with varying ionic strength [33].
After applying voltage at the ends of a capillary, the cations in the diffuse layer
migrate to the cathode. While moving, these ions drag along molecules of solvating liquid (most often water) thus producing a net flow of liquid. This phenomenon is called electroosmotic flow. Since the ionized surface functionalities
are located along the entire surface and each of them contributes to the flow, the
overall flow profile should be flat (Fig. 1). Indeed, this has been demonstrated in
several studies [32, 34] and is demonstrated in Fig. 3. Unlike HPLC, this plug-like
flow profile results in reduced peak broadening and much higher column efficiencies can be achieved.
Table 1. Effect of buffer concentration c on thickness
of the electrical double layer d [33]
c, mol/l
d, nm
0.1
0.01
0.001
1.0
3.1
10.0
6
F. Svec
a
b
Fig. 3 a, b. Images of: a pressure-driven; b electrokinetically driven flow. (Reprinted with permission from [32]. Copyright 1998 American Chemical Society). Conditions: (a) flow through
an open 100 µm i.d. fused-silica capillary using a caged fluorescein dextran dye and pressure
differential of 5 cm of H2O per 60 cm of column length; viewed region 100 by 200 µm; (b) flow
through an open 75 mm i.d. fused-silica capillary using a caged rhodamine dye; applied field
200 V/cm, viewed region 75 by 188 mm. The frames are numbered in milliseconds as measured
from the uncaging event
The plug flow profile would only be distorted in very narrow bore capillaries
with a diameter smaller than the thickness of two double-layers that then overlap. To achieve an undisturbed flow, Knox suggested that the diameter should be
10–40 times larger than d [15]. This can easily be achieved in open capillaries.
However, once the capillary is packed with a stationary phase, typically small
modified silica beads that carry on their own charged functionalities, the distance
between adjacent double-layers is only a fraction of the capillary diameter. However, several studies demonstrated that beads with a submicrometer size can be
used safely as packings for CEC columns run in dilute buffer solutions [15, 35].
7
Capillary Electrochromatography: a Rapidly Emerging Separation Method
Table 2. Comparison of parameters for capillary columns operated in pressurized and electri-
cally driven flow a [37]
Packing size, mm
Column length, cm
Elution time, min
Pressure, MPa
a
b
Pressurized flow
Electroosmotic flow
3
66
33
40
3
35
18
0
1.5
18
n.a.
120 b
1.5
11
6
0
Column lengths, elution times, and back pressures are given for a capillary column affording 50,000 plates at a mobile phase velocity of 2 mm/s.
The back pressure exceeds capabilities of commercial instrumentation (typically 40 MPa).
In columns with thin double layers typical of dilute buffer solution, the electroosmotic flow, ueo , can be expressed by the following relationship based on the
von Smoluchowski equation [36]:
ueo =er eo zE/h
(1)
where er is the dielectric constant of the medium, eo is the permittivity of the vacuum, z is the potential at the capillary inner wall, E is the electric field strength
defined as V/L where V is the voltage and L is the total length of the capillary column, and h is the viscosity of the bulk solution. The flow velocity for pressure driven flow u is described by Eq. (2):
u=dp2 DP/fhL
(2)
where dp is the particle diameter, DP is the pressure drop within the column, and
f is the column resistance factor that is a function of the column porosity (typically f=0.4). In contrast to this, Eq. (1) does not include a term involving the
particle size of the packing. Therefore, the lower limit of bead size in packed CEC
columns is restricted only by the requirement of avoidance of the double-layer
Table 3. Comparison of efficiencies for capillary columns packed with silica particles operated
using pressurized and electrically driven flow [37]
dp , mm a
5
3
1.5
a
b
c
Pressurized flow, HPLC
Electroosmotic flow, CEC
L, cm b
Plates/column
L, cm
Plates/column
50
30 c
15 c
45,000
50,000
33,000
50
50
50
90,000
150,000
210,000
Particle diameter.
Column lengths.
Column length is dictated by the pressure limit of commercial instrumentation (typically
40 MPa).
8
F. Svec
overlap. However, a more important implication of this difference is the absence
of back pressure in devices with electrically driven flow. Table 2 demonstrates
these effects on conditions that have to be met to achieve an equal efficiency of
50,000 plates in columns packed with identical size beads run in both HPLC and
CEC modes. Obviously, CEC requires much shorter column length and the separation is faster. Table 3 shows that the decrease in particle size leads to an increase in the column efficiency per unit length for both HPLC and CEC. However,
the actual efficiency per column in HPLC decreases as a result of the shorter column length that must be used to meet the pressure limits of the instrumentation.
In contrast, the use of the CEC mode is not limited by pressure, the columns remain equally long for beads of all sizes in the range of 1.5–5 mm, and the column
efficiency rapidly increases [37].
3
CEC Instrumentation
The simplest CEC equipment must include the following components: a highvoltage power supply, solvent and sample vials at the inlet and a vial to collect
waste at the outlet of the capillary column, a column that simultaneously generates EOF and separates the analytes, and a detector that monitors the component
peaks as they leave the column. Figure 4 shows a scheme of an instrument that
Fig. 4. A simplified schematic diagram of CEC equipment
Capillary Electrochromatography: a Rapidly Emerging Separation Method
9
in addition to the basic building blocks also includes a module that enables pressurization of the vials to avoid bubble formation within the column. The column
itself is then placed in a temperature-controlled compartment that helps to dissipate the Joule heat created by the electric field. All these elements are built in
more sophisticated commercial instruments such as the Capillary Electrophoresis System (Agilent Technologies).
Pressurization of the vials at both the inlet and the outlet ends of the CEC capillary column packed with particles to about 1.2 MPa is required to prevent formation of bubbles that lead to a noisy baseline. Typically, equal pressure of an inert gas such as nitrogen is applied to both vials to avoid flow that would otherwise
occur resulting from the pressure difference. Hydraulic pressure applied only at
the inlet end of the capillary column is occasionally used in pressure-assisted
electrochromatography [38, 39].
The number of dedicated commercial instruments for CEC is very limited.
Large manufacturers such as Agilent Technologies (Wallbron, Germany) and
Beckmann/Coulter (Fullerton, CA, USA) implemented relatively minor adjust-
Fig. 5. Capillary electrochromatograph with gradient elution capability. (Reprinted with per-
mission from [153]. Copyright 1997 American Chemical Society): 1, high-voltage power supply; 2, inlet reservoir with electrode; 3, outlet reservoir with electrode; 4, packed capillary column; 5, on-line sensing unit (UV detector); 6, detector output, 0–1 V; 7, sample injection valve;
8, purge valve; 9, restrictor; 10, syringe for introduction of sample or buffer; 11, capillary resistor; 12, static mixing tee; 13, grounding; 14, pumps; 15, pump control panels and readouts;
16, manometer; 17, eluent reservoirs; 18, switching valve; 19, syringe for buffer introduction;
20, waste reservoir at the inlet; 21, waste reservoir at the outlet; 22, thermostated inlet compartment; 23, detector compartment; 24, outlet compartment; 25, CEC instrument control
panel; 26, gas pressure control; 27, gas inlet, 1.4 MPa nitrogen; 28, temperature control; 29, data
acquisition. Line symbols: ···, electric wiring; –, liquid lines; –·–, gas lines; –––, separating lines
between instrument compartments
10
F. Svec
ments to their well-established instrumentation for capillary electrophoresis.
Smaller companies such as Microtech Scientific, Inc. (Sunnyvale, CA, USA) and
Unimicro Technologies, Inc. (Pleasanton, CA, USA) have developed instruments
that can be used for mHPLC, CE, CEC, and pressurized CEC. Although this type
of equipment addresses some of the weaknesses of the adapted CE instrumentation, the current market still lacks a reliable instrument for CEC that enables
gradient elution, electrical fields higher than 1 kV/cm, or that includes a column
compartment with well-controlled heating and accommodates even short capillaries. Current instrumentation is also not compatible with 96 or 384 well plate
formats for direct sampling [40].
Since the commercial instrumentation does not satisfy the needs of specific
CEC research, a number of groups described their home-built equipment. For example, Dittmann et al. developed an additional module that, once attached to HP
Fig. 6. Schematic of the solvent gradient elution CEC apparatus with ramping voltage accessory.
(Reprinted with permission from [204] Copyright 1996 American Chemical Society)
Capillary Electrochromatography: a Rapidly Emerging Separation Method
11
3DCE
instrument, allows operation in a gradient mode [41]. Horváth’s group developed equipment for gradient CEC shown in Fig. 5 that allowed for combination of several chromatographic modes. These two and some other groups used
a standard gradient HPLC system for the preparation of a mobile phase gradient
that is delivered to the inlet of the capillary column through an interface. In contrast, Zare’s group used electroosmotic pumping from two eluent reservoirs
(Fig. 6). The gradient was obtained by ramping the voltage between these two
reservoirs.A detailed description of CEC instrumentation has been published recently by Steiner and Scherer [39].
4
Column Technologies for CEC
CEC is often inappropriately presented as a hybrid method that combines the
capillary column format and electroosmotic flow employed in high-performance
capillary electrophoresis with the use of a solid stationary phase and a separation mechanism, based on specific interactions of solutes with the stationary
phase, characteristic of HPLC. Therefore CEC is most commonly implemented by
means typical of both HPLC (packed columns) and CE (use of electrophoretic instrumentation). To date, both columns and instrumentation developed specifically for CEC remain scarce.
Although numerous groups around the world prepare CEC columns using a
variety of approaches, the vast majority of these efforts mimic in one way or another standard HPLC column technology. However, aspects of this technology
have proven difficult to implement on the capillary scale. Additionally, the stationary phases packed in CEC capillaries are often standard commercial HPLCgrade beads. Since these media are tailored for regular HPLC modes and their
surface chemistries are optimized accordingly, their use incorrectly treats CEC as
a subset of HPLC. Truly optimized, CEC packings should play a dual role: in addition to providing sites for the required interactions as in HPLC, they must also
be involved in electroosmotic flow. As a result, packings that are excellent for
HPLC may offer limited performance in the CEC mode. This realization of the basic differences between HPLC and CEC [33] has stimulated the development of
both specific particulate packings having properties tuned for the needs of CEC
as well as alternative column technologies. Generally, column technology remains
currently one of the “hottest” issues in CEC and the progress in this area has been
summarized in several recent review articles [42–46].
4.1
Packed Columns
The influence of HPLC on the development of separation media for CEC is rather
obvious. For example, HPLC-like “hardware”, such as frits and packed columns,
are employed.A number of various packing technologies have been reported that
enable packing particles into narrow bore capillary columns. The solvent slurry
packing appears to be the most popular technique that has been transferred di-
12
F. Svec
Step 1)
Step 2)
Step 3)
Step 4)
Step 5)
Step 6)
Step 7)
Fig. 7. Scheme of a typical process used for packing CEC columns with beads
rectly from the HPLC. In contrast to relatively simple procedures widely used in
HPLC, slurry packing of columns for CEC is more complex. The scheme in Fig. 7
shows as an example the individual steps required to fabricate an efficient column
[47]. These include:
1. Attaching an in-line end-frit and packing the column by pumping a slurry of
beads and solvent into the capillary under high pressure. Sonication is recommended to achieve better quality.
2. Flushing the packed column with water at high pressure to replace the solvent.
3. Preparing the outlet end-frit at the desired distance from the column end by
sintering the silica beads using heating to a temperature of over 550 °C.
4. Removing the in-line end-frit and flushing out the extra-column packing materials using reversed flow direction.
5. Sintering of the packing materials to create the inlet end-frit at a distance representing the desired packed segment length followed by the removal of the
polyimide coating from the detection window close to the outlet frit.
6. Cutting off the excess capillary close to the inlet frit.
7. Washing the packed capillary with the desired mobile phase
Since the general concept in CEC is to use packing materials with a beads size as
small as possible, the viscosity of the liquid used for slurring the beads is critical. Equation (2) rearranged to
DP=u f h L/dp2
(3)
13
Capillary Electrochromatography: a Rapidly Emerging Separation Method
Table 4. Retention factors k¢ and column efficiencies N for an unretained thiourea and retained
compound amylbenzene in columns packed by different methods [53]
Packing method
Analyte
k¢
N, plates/m
Pressurized slurry
Thiourea
Amylbenzene
Thiourea
Amylbenzene
Thiourea
Amylbenzene
Thiourea
Amylbenzene
–
2.4
–
2.1
–
2.2
–
2.3
86,600
104,100
143,200
179,400
181,800
181,800
98,800
136,700
Supercritical CO2
Centripetal force
Electrokinetic
clearly shows that the pressure required to push a liquid through the packed capillary exponentially increases with the decrease in bead diameter. Although use
of slower flow velocity could be the solution to this problem, it would lead to excessively long packing times and the uncontrolled sedimentation of particles
would reduce the homogeneity of the bed, thus negatively affecting the efficiency.
Therefore, the use of liquids with lower viscosity is more convenient and enables
packing columns at reasonable pressures. Several groups have reported the use
of supercritical CO2 , a liquid that has very low viscosity and is easy to handle, in
slurry packing of CEC columns [48, 49].
Yan developed a method that employs electrokinetic migration of charged silica beads [50]. The capillary is attached to a reservoir filled with slurry and the
electric field is applied. The beads then move towards the anode in a stagnant
liquid phase thus substituting the typical pumping of a liquid through the capillary. This remarkably simple method requires beads of very narrow size distribution since their surface area and consequently their net charge and migration
rate increase with the decreasing bead diameter. If a polydisperse mixture of particles is used, the smaller beads migrate faster and this leads to the formation of
inhomogeneous beds.
Colón and Maloney demonstrated another packing method that also avoids
pumping the slurry through the column [51]. They used centripetal force to drive
beads, which have a higher density than the liquid contained in solvent slurry,
through the capillary. Their packing equipment enables a rotation speed of up to
3000 rpm at which the packing time is only 5–15 min.
Since the packing process always includes several steps, it requires specific
skills to prepare highly efficient capillaries reproducibly. Obviously, the procedures described above are not trivial and the results obtained with each of
them may differ substantially [52]. Table 4 compares data obtained for capillaries packed using four different methods [53]. The major challenge appears to be
the in situ fabrication of retention frits. Tapered ends of the capillary columns
introduced recently may help to solve this serious problem [54, 55]. The other
problem is rearrangement of beads in the bed affected by their electromigration.
14
F. Svec
4.1.1
Packing Materials
The correct choice of the packing material, typically functionalized silica beads,
is extremely important to achieve the best performance in CEC. Since specialized
CEC packings are emerging only slowly [7], typical HPLC separation media are
being frequently used to pack CEC columns. Figure 8 demonstrates the effect of
the stationary phase in the separation of polyaromatic hydrocarbons (PAHs)
[56]. The results are simple to interpret: the base deactivated BDS-ODS-Hypersil contains the lowest surface coverage with silanol groups that are the driving
force for flow. Therefore, the separation requires a long time. The magnitude of
electroosmotic flow produced by the packings largely depends on the extent of
endcapping of residual silanol groups that is required to avoid peak tailing in
HPLC. In contrast, the specifically developed CEC Hypersil C18 affords both good
flow and fair selectivity. Table 5 summarizes properties and electroosmotic mobilities for a selected group of commercial packings [57].
In order to increase the electroosmotic flow, a number of studies used beads
with specifically designed surface chemistries that involved strong ion-exchange
functionalities. The famous yet irreproducible separations of basic compounds
with an efficiency of several millions of plates has been achieved with silica based
Fig. 8. Separation of polyaromatic hydrocarbons using commercial stationary phases. (Reprinted with permission from [56]. Copyright 1997 VCH-Wiley). Conditions: voltage 20 kV, capillary column 100 µm i.d., total length 33.5 cm, active length 25 cm, isocratic separation using
80:20 acetonitrile-50 mmol/l TRIS buffer pH=8. Peaks thiourea (1), naphthalene (2), and fluoranthrene (3)
15
Capillary Electrochromatography: a Rapidly Emerging Separation Method
Table 5. Properties of commercial stationary phases used in CEC [53]
Stationary phase
End-capping
Carbon content
%
Surface area a
m2/g
µEOb
104 · cm2 V–1 s–1
Nucleosil 5 C18
LiChrospher RP-18
Spherisorb Diol
Spherisorb S5 ODS2
Zorbax BD-ODS
Hypersil ODS
Partisil 5 ODS3
Purospher RP-18
Fully capped
Uncapped
Uncapped
Fully capped
Fully capped
Fully capped
Fully capped
Chem. treated
13.6
21.7
1.9
14.5
10.8
11.0
10.9
17.8
350
450
220
350
220
170
350
500
1.56
1.45
0.80
0.68
0.50
0.14
<0.01
<0.01
a
b
Values published by manufacturers.
Electroosmotic mobility.
strong cation exchanger [58]. El Rassi and Zhang developed “layered” chemistries
with sulfonic acid ion exchange functionalities attached to the silica surface
forming a sub-layer covered with a top layer of C18 alkyl chains [59, 60]. These
materials afford much higher electroosmotic flow than their non-sulfonated
counterparts and exhibit an interesting selectivity in the separation of nucleosides and other families of compounds.
The majority of CEC-studies in the early 1990s have been carried out with
columns packed with the then state-of-the-art 5-mm octadecyl silica (ODS) beads
[15, 61, 62]. Later in the decade, 3-µm beads became the HPLC industry standard
and found their way rapidly to CEC. Their use enabled easy separation of hydrocarbons in the CEC mode with an efficiency of up to 400,000 plates/m [48, 58].
Even better results were obtained with experimental particles having a diameter
of 1.5 mm [63–67]. Unger’s group prepared and used even smaller beads with diameters in the submicrometer range [35, 68, 69]. Indeed, they achieved a further
increase in efficiency to over 650,000 plates/m at a flow velocity of 3 mm/s. However, this was three time less than the value predicted by theory. This was explained by the effect of axial diffusion that does not depend on the particle size
and becomes the dominating contribution to the peak broadening under these
conditions, especially at the typical flow rates. Since an increase in the flow velocity of the magnitude required to minimize the effect of axial diffusion is difficult to achieve with the current instrumentation, the submicron sized packings
do not offer any considerable advantage over the more common somewhat larger
beads that are also easier to pack.
The effect of pore size on CEC separation was also studied in detail [70–75].
Figure 9 shows the van Deemter plots for a series of 7-µm ODS particles with
pore size ranging from 10 to 400 nm. The best efficiency achieved with the large
pore packing led to a conclusion that intraparticle flow contributes to the mass
transfer in a way similar to that of perfusion chromatography and considerably
improves column efficiency. The effect of pore size is also involved in the CEC
separations of synthetic polymers in size-exclusion mode [76].
16
F. Svec
22
100 Å
500 Å
20
300 Å
18
1000 Å
16
14
12
4000 Å
10
8
0
0.5
1
1.5
2
2.5
3
3.5
4
Fig. 9. Effect of pore size on the efficiency of CEC columns. (Reprinted with permission from
[70]. Copyright 1997 VCH-Wiley). Conditions: field strength 100–500 V/cm, capillary column
75 mm i.d., total length 30 cm, active length 25 cm, isocratic separation using 20:80 acetonitrile100 mmol/l phosphate buffer pH =6.9, marker acetone
4.2
Open-Tubular Geometry
In order to avoid tedious procedures required to prepare packed CEC columns,
some groups are studying the use of empty capillaries. Since solute-stationary
phase interactions are key to the CEC process, appropriate moieties must be
bound to the capillary wall. However, the wall surface available for reaction is severely limited. For example, a 100 µm i.d. capillary only has a surface area of
3¥10 –4 m2 per meter of length, with a density of functional sites of approximately 3.1¥1018 sites/m2, which equals 0.5 mmol sites/m2. Moreover, surface
modification cannot involve all of the accessible silanol groups, since some must
remain to support the EOF.As a result, the use of bare capillaries in CEC has been
less successful.
In contrast, chemical etching of the inner wall of the fused-silica capillaries
was used to increase the surface area. This enables achievement of a higher phase
ratio since more alkyl functionalities can be attached to the surface, thus improving both the separation process and loadability of the column. The surface
morphology of the etched capillary depends on the time the methanol solution
of ammonium hydrogen difluoride is left in contact with the capillary and temperature at which the reaction is carried out (Fig. 10) [77]. The surface features
have been described by Pesek to range “from spikes of silica material extending
Fig. 10. Reaction path to etched and surface modified fused silica capillaries (modified from [78])
Capillary Electrochromatography: a Rapidly Emerging Separation Method
17
18
F. Svec
Scanning Electron Micrographs of Etched Capillary Surfaces
A
B
C
Fig. 11 A – C. Scanning electron micrographs of fused silica capillary surfaces etched with
methanolic ammonium hydrogen difluoride solution. (Reprinted with permission from [78].
Copyright 2000 Elsevier). Etching process was carried out for: A 3 h at 300 °C; B, 2 h at 300 °C
and 2 h at 400°C; C 2 h at 300°C and 1 h at 400°C
3–5 mm from the surface (Fig. 11A), to a series of hills or sand dunes (Fig. 11B),
to large uniform boulder-like pieces of silica on the surface (Fig. 11C)” [78]. Each
of these structures easily survives conditions typical of the CEC separations. This
group also used their silanization/hydrosilation process to attach the alkyl moieties shown in Fig. 10. First, the surface is treated with a triethoxysilane to afford
hydride functionalities. The desired alkyl is then attached by a catalyzed hy-
Capillary Electrochromatography: a Rapidly Emerging Separation Method
19
Fig. 12 A– D. Separation of a mixture of cyctochromes C from various sources in 20 mm i.d. capillary columns. (Reprinted with permission from [78]. Copyright 2000 Elsevier). Conditions:
A bare capillary; B unetched C18 modified capillary; C,D etched C18 modified capillary, total
column length 50 cm, active length 25 cm, voltage 30 kV (A,B,C) and 15 kV (D), mobile phase
60 mmol/l a-alanine and 60 mmol/l lactic acid pH 3.7, detection at 211 nm, pressurized injection for 2 s using vacuum
drosilylation reaction. The bonded phase was characterized using a number of
analytical methods such as diffuse reflectance infrared Fourier transform
(DRIFT), solid-state cross-polarization magic-angle spinning (CP-MAS) NMR,
photoelectron spectroscopy (ESCA) and optical methods such as UV-visible and
fluorescence spectroscopy. Figure 12 demonstrates the significant effect of the
surface treatment on the CEC separation of very similar proteins [79].