expression of recombinant genes in eukaryotic systems
Bạn đang xem bản rút gọn của tài liệu. Xem và tải ngay bản đầy đủ của tài liệu tại đây (10.92 MB, 405 trang )
Preface
The ability to express recombinant proteins in eukaryotic cells has
greatly increased our ability to study protein function in a variety of settings.
Initial work in this field focused on gaining an understanding of the cis-acting
sequences necessary for mRNA expression, processing, and translation. As
the field has matured, the more sophisticated task of finely regulating gene
expression has taken center stage. Researchers want to be able to limit
expression to particular tissues and to determine the timing and level of
expression. In addition, exciting new technologies are being developed that
use small RNA molecules to regulate expression of endogenous genes. In
this volume of
Methods in Enzymology,
we have brought together a number
of exciting new techniques for regulated gene expression in eukaryotic cells.
We hope that this volume will prove to be a valuable resource for
those who are looking for new methods to express recombinant proteins
in eukaryotic systems. We realize that no single volume can be complete,
and certainly there are methods for recombinant protein expression not
represented here. However, we have tried to bring together many novel
and creative methods currently being used in many top laboratories.
We thank the authors for the time and effort they devoted to describing
the current methods for recombinant protein expression in use in their labo-
ratories.
JOSEPH C. GLORIOSO
MARTIN C. SCHMIDT
xiii
[ l ] MICROARRAY-BASED EXPRESSION MONITORING
3
[ 11 Fluorescence-Based Expression Monitoring
Using Microarrays
By
ELIZABETH A. WINZELER, MARK SCHENA, and RONALD W. DAVIS
Introduction
The amount of DNA sequence available to researchers, along with the
need to access this great wealth of information experimentally, has been
increasing exponentially. Miniature nucleic acid arrays, often called "DNA
chips" or "microarrays," offer opportunities to collect much of the same
data that can be obtained with standard molecular biology hybridization
methods but in a highly parallel fashion. These microarrays contain dense
collections of nucleic acids [either polymerase chain reaction (PCR) prod-
ucts or oligonucleotides] that are either synthesized or deposited at fixed
spatial locations on specially prepared glass slides. When labeled DNA or
RNA samples are hybridized to the microarrays, the abundance of specific
target sequences in the sample can be estimated based on the observed
signal intensity at the physical position of the complementary probe or
probes. Pico- to femtomoles of thousands of different nucleic acid probes
can be arranged at densities of 400 to 250,000 elements/cm 2. With this
miniaturization and through the use of fluorescence the simultaneous analy-
sis of entire genomes becomes possible.
Although microarrays show great promise as tools for genotyping, map-
ping, and resequencing, 1,2 an equally important application for the microar-
ray is measuring transcript abundance. 3,4 Microarrays have been used to
simultaneously measure the mRNA expression levels for every gene in
Saccharomyces cerevisiae
under several different growth conditions, 5-v to
characterize the differences between normal and metastatic tissues, 8 and
M. Chee, R. Yang, E. Hubbell, A. Berno, X. C. Huang, D. Stern, J. Winkler, D. J. Lockhart,
M. S. Morris, and S. P. Fodor,
Science
274, 610 (1996).
2 j. G. Hacia, L. C. Brody, M. S. Chee, S. P. Fodor, and F. S. Collins,
Nature Gener
14,
441 (1996).
3 M. Schena, D. Shalon, R. W. Davis, and P. O. Brown,
Science
270, 467 (1995).
4 D. J. Lockhart, H. Dong, M. C. Byrne, K. T. Follettie, M. V. Gallo, M. S. Chee, M. Mittmann,
C. Wang, M. Kobayashi, H. Horton, and E. L. Brown,
Nature Biotechnol.
14, 1675 (1996).
5 L. Wodicka, H. Dong, M. Mittmann, M H. Ho, and D. J. Lockhart,
Nature Biotechnol.
15,
1359 (1997).
6 j. L. DeRisi, V. R. Iyer, and P. O. Brown,
Science
278, 680 (1997).
7 R. J. Cho, M. J. Campbell, E. A. Winzeler, L. Steinmetz, A. Conway, L. Wodicka, T. G.
Wolfsberg, A. E. Gabrielian, D. Landsman, D. J. Lockhart, and R. W. Davis,
Mol. Cell
(1998).
8 j. DeRisi, L. Penland, P. O. Brown, M. L. Bittner, P. S. Meltzer, M. Ray, Y. Chen, Y. A.
Su, and J. M. Trent,
Nature Genet.
14, 457 (1996).
Copyright © 1999 by Academic Press
All rights of reproduction in any form reserved.
METHODS IN ENZYMOLOGY, VOL. 306 0076-6879/99 $30.00
4 ANALYSIS OF GENE EXPRESSION [ 1 ]
as a vehicle for gene discovery. 9,1° They can also be used to probe genome
content when DNA instead of RNA or cDNA is hybridized. 5,11 Global
gene expression profiles will be used in diagnostics and to look for drug
targets. 12 Data generated by array-based expression experiments will be
essential for understanding genetic regulatory networks and integrated
cellular responses.
As the availability of fluorescence-based microarray technology grows,
more applications for these tools will be discovered and new methods for
generating microarrays will be developed. The different types, their differ-
ent manufacturing processes, and different applications have been reviewed
extensively elsewhere. 13-15 This article describes the two basic types of
microarrays, protocols for fluorescently labeling messenger RNA from eu-
karyotic cells for hybridization to microarrays, and considerations involved
in experimental design and data analysis.
Nomenclature
The term DNA microarray (sometimes called cDNA microarray) will
be used to describe ordered collections of plasmid clones or DNA fragments
that have been attached to glass at densities of greater than 100 probe
elements/cm 2. Oligonucleotide microarrays will be distinguished from DNA
microarrays, not because their manufacture is necessarily different, but
because hybridization conditions are generally different. Oligonucleotide
or DNA arrays may also be fabricated on porous materials, such as nitrocel-
lulose or nylon membranes, but the spot density is generally lower. Al-
though these filter arrays can also be used to monitor expression using a
large number of probes, the target is usually radiolabeled and discussion
of such is outside the scope of this article. In addition, the word "target"
will describe the molecule whose characteristics are unknown, in this case
the messenger RNA or cDNA in solution, and the word "probe" will
describe the molecules that are affixed to the microarray. Unlike conven-
tional Southern or Northern methods, the target, not the probe, bears
the label.
9 M. Schena, D. Shalon, R. Heller, A. Chai, P. O. Brown, and R. W. Davis,
Proc. Natl. Acad,
Sci. U.S.A.
93, 10614 (1996).
10 R. A. Heller, M. Schena, A. Chai, D. Shalon, T. Bedilion, J. Gilmore, D. E. Woolley, and
R. W. Davis,
Proc. Natl. Acad. Sci. U.S.A.
94, 2150 (1997).
11 D. Lashkari, J. DeRisi, J. McCusker, A. Namath, C. Gentile, S. Hwang, P. Brown, and R.
Davis,
Proc. Natl. Acad. Sci. U.S.A.
94, 13057 (1997).
12 L. H. Hartwell, P. Szankasi, C. J. Roberts, A. W. Murray, and S. H. Friend,
Science
278,
1064 (1997).
13 A. Marshall and J. Hodgson,
Nature Biotechnol.
16, 27 (1998).
14 M. Johnston,
Curt. Biol.
8, R171 (1998).
15 G. Ramsay,
Nature Biotechnol.
16, 40 (1998).
[ 1 ]
MICROARRAY-BASED EXPRESSION MONITORING 5
To construct DNA microarrays, nucleic acid probes (usually 500 to 2000
bases in size) are generated by PCR-amplifying plasmid library inserts
(using primers complementary to the vector portion of the library) or
portions of genomic DNA (using primers designed specifically for the open
reading frames or genes of interest). The PCR products are then deposited,
usually using a robotic microspotting device, at defined locations on a glass
slide. 16 The robotic spotting device is equipped with a set of tips that pick
up small amounts of PCR products (~0.2 tzl) from a microtiter plate by
capillary action and then sequentially dispense the product at specific loca-
tions on multiple slides by touching the tips to the slide surface in a way
that is equivalent to the mechanism by which ink is released from a quill
pen when the tip touches paper. When fine spotting pins are used, spots
containing as little as 1 ng of nucleic acid can be arrayed at densities of up
to 5000 elements/cm 2. Because each PCR reaction may produce a few
micrograms of probe, thousands of microarrays may be produced from a
single set of PCR reactions. Other robotic microfabrication technologies.
such as ink jetting, in which the probe solution is placed in a piezoelectric
controlled print head that can release microscopic droplets, are under devel-
opment. ,7
After the PCR products are spotted on the microarray, they are fixed
covalently to the surface and denatured. Fluorescently labeled mRNA,
cDNA, or cRNA is hybridized to the microarray. The fluorescence intensity
at each location on the slide is determined with a confocal microscope that
has been modified to scan the slide surface or with a charge-coupled device
(CCD) camera. 18 Detection by mass spectrometry or radioisotope is also
possible, but will not be considered here. The scanned image is then ana-
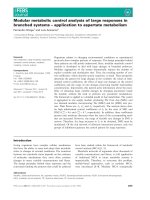
lyzed. An example of a scanned image of a DNA microarray is shown in
Fig. 1 (see color insert). Messenger RNA was prepared from human Jurkat
cells and hybridized to an array containing 248 human and
Arabidopsis
cDNAs using the procedures described here. As the amount of probe on
the array exceeds the amount of target, the observed signal at any given
position is a good estimate of the abundance of cognate target in the sample.
Oligonucleotide Microarrays
Oligonucleotide microarrays consist of shorter (less than 50 bases) nu-
cleic acid fragments of known sequence, covalently attached to a derivatized
glass slide at defined locations. The oligonucleotides can be either prefabri-
cated and then attached using microdeposition technology (robotic printing
16 D. Shalon, S. J. Smith, and P. O. Brown,
Genome Res.
6, 639 (1996).
17 A. M. Castellino,
Genome Res.
7, 943 (1997).
18 M. Schena and R. Davis,
in
"PCR Methods Manual" (M. Innis, D. Gelfand, and J. Sninsky,
eds.), p. 445. Academic Press, San Diego, 1999.
6
ANALYSIS OF GENE EXPRESSION [ 1 ]
or ink jetting) or synthesized in situ using techniques such as photolithogra-
phy or ink jetting of the individual dA, dC, dG, or dT phosphoramidite
monomersJ 7 Affymetrix (Santa Clara, CA) manufactures high-density oli-
gonucleotide microarrays using a light-directed combinatorial method. 19,2°
With this method, photoreactive (versus chemically reactive) phosphor-
amidite monomers are used in oligonucleotide synthesis. A series of physical
photomasks that protect portions of the glass surface is designed based on
the sequences of the oligonucleotides that will be synthesized. By shining
a mercury light through the different photomasks [no more than 100 (4 x
25) masks are need to make 25-mers], the synthesis can be controlled in a
spatially addressable fashion, allowing the production of microarrays whose
sequence diversity is limited only by the resolution of the mask (up to
400,000 different 25-mer probes in a 1.6-cm 2 area). Each element on the
array contains ~107 molecules of a particular probe sequence in a 50-/xm 2
area. One of the chief advantages of in situ methods over amplification/
microdeposition methods is that the sequences are selected from databases
using software, and no physical handling of the probes is required, reducing
the probability of probe cross-contamination or mix-up significantly.
As with DNA microarrays, the mRNA (or cDNA) is labeled and hybrid-
ized to the microarray. Hybridization occurs at lower temperatures, and
protocols usually call for the fragmentation of the labeled material before
hybridization to reduce the amount of secondary structure that forms at
the lower temperatures. The microarrays are washed and scanned, and
hybridization is detected by fluorescence.
Analysis of Gene Expression Using Microarrays
Preparation of Microarrays
Microarrays designed to use fluorescence detection and containing
probe sequences from different organisms can be purchased from suppliers
such as Affymetrix (Santa Clara, CA) or Synteni (Fremont, CA) and many
new producers are entering the market. The manufacture of certain types
of microarrays may be technically inaccessible to most laboratories. How-
ever, if a robotic spotting device is available, DNA microarrays can be
fabricated in the laboratory. These instruments can be built using commer-
cially available parts (see or can be pur-
chased from companies such as Molecular Dynamics (Sunnyvale, CA) or
19 S. P. A. Fodor, J. L. Read, M. C. Pirrung, L. Stryer, A. T. Lu, and D. Solas,
Science
251,
767 (1991).
20 A. C. Pease, D. Solas, E. J. Sullivan, M. T. Cronin, C. P. Holmes, and S. P. Fodor,
Proc.
Natl. Acad. Sci. U.S.A.
91, 5022 (1994).
FIo. 1. Scanned image of a gene expression microarray. A fluorescent scan of a microarray
prepared by mechanical microspotting is shown. A total of 240 human blood cDNAs and 8
Arabidopsis
controls were amplified by PCR, purified, and arrayed on silylated microscope
slides in duplicate at 200-t~m spacing. The 496 element microarray was then hybridized with
a fluorescent probe prepared by enzymatic incorporation of Cy3-dCTP into cDNA by single-
round reverse transcription of poly(A) + mRNA from cultured Jurkat cells, essentially as
described in Table III. The microarray was scanned at 10-~m resolution with a confocal laser
detection system. Fluorescent data are depicted in a rainbow pseudocolor palette for ease of
visualization. Elements complementary to abundant messages are red, whereas black/dark
blue elements correspond to genes having low or undetectable transcript levels.
[ 1] MICROARRAY-BASED EXPRESSION MONITORING 7
Telechem International (Sunnyvale, CA). Generating arrays with a spotting
device, although repetitive, is not prohibitively difficult (Tables I and II).
An example of a scanned image of an array generated with a robotic
spotting device is shown in Fig. 1. Hundreds or thousands of PCR reactions
need to be performed using either a large number of different templates
or a large number of different primers. Clones from any plasmid library
(ordered or unordered cDNA, genomic DNA, etc.) can be used as tem-
plates. In principle unamplified plasmid DNA could also be spotted, but
the presence of vector sequence present in all elements could increase back-
ground.
If the genomic DNA is to be used as template, different pairs of oligonu-
cleotide primers need to be designed and synthesized for each element
TABLE I
PCR AMPLIFICATION OF CLONES FROM GENOM1C DNA
OR cDNA LIBRARIES
1. Assemble PCR reactions in 96-well plate
Reagent Volume (/xl)
10x PCR buffer (15 mM Mg 2+) 10.0
dNTP cocktail (2 mM each) 10.0
Primer 1 (100 pmol/tzl)" 1.0
Primer 2 (100 pmol//xl) 1.0
Genomic or plasmid DNA (10 ng//xl) b 1.0
H20 76.0
Taq
DNA polymerase (5 U/tzl) 1.0
100/~1
2. Amplify targets in 96- or 384-well format using 30 rounds of PCR (94 °,
30 sec; 55 °, 30 sec; 72 °, 60 sec)
3. Purify using PCR product purification kit and elute products with 100
~1 of 0.1× TE (pH 8.0)
4. Dry products to completion in Speed-Vac
5. Resuspend each PCR product in 7.5 txl 5× SSC (0.3-1.0 mg/ml DNA)
6. Transfer to flat bottom 384-well plate (Nunc) for arraying
Suggested materials
PCR primers modified with a 5'-amino modifier C6 (Glen Research)
96-well thermal cycler (PCR system 9600-Perkin Elmer, Norwalk, CT)
96-well PCR plates (MicroAmp 96-well Perkin Elmer)
Taq
DNA polymerase (Stratagene, La Jolla, CA)
PCR product purification kit (Telechem International)
Flat-bottom 384-well plates (Nunc, Naperville, IL)
" Use of generic primer pairs (-21-mers) to vector sequences allows high-
throughput processing.
h Plasmid DNA can be prepared by alkaline lysis and purified. The 96-
well REAL prep (Qiagen) facilitates rapid preparation.
8 ANALYSIS OF
GENE EXPRESSION
[ 1]
TABLE II
MICROARRAYING AND SLIDE PROCESSING
1. Obtain silylated (free aldehyde) microscope slides (CEL Associates, Houston, TX)
2. Print cDNAs using microspotting device according to manufacturer's instructions
3. Allow printed arrays to dry overnight in slide box a
4. Soak slides twice in 0.2% (w/v) sodium dodecyl sulfate (SDS) for 2 min at room tem-
perature with vigorous agitation b
5. Soak slides twice in doubly distilled H20 for 2 min at room temperature with vigorous
agitation
6. Transfer slides into doubly distilled H20 at 95-100 ° for 2 min to allow DNA denatur-
ation
7. Allow slides to dry thoroughly at room temperature (~5 min)
8. Transfer slides into a sodium borohydride solution c for 5 min at room temperature to
reduce free aldehydes
9. Rinse slides three times in 0.2% SDS for 1 min each at room temperature
10. Rinse slides once in doubly distilled H20 for l min at room temperature
11. Submerge slides in doubly distilled H20 at 95-100 ° for 2 sec d
12. Allow the slides to air dry and store in the dark at 25 ° (stable for >1 year)
Suggested materials
Microspotting device (Telechem International, Molecular Dynamics, Cartesian)
Microscope slides (CEL Associates)
a Drying increases cross-linking efficiency. Several days or more is acceptable.
b This step removes salt and unbound DNA.
c Dissolve 1.0 g NaBH4 in 300 ml phosphate-buffered saline. Add 100 ml 100% ethanol
to reduce bubbling. Prepare just prior to use!
d Heating the slides aids greatly in the drying process.
on the microarray. The Whitehead Institute Primer program (http://www.
genome.wi.mit.edu/genome software/), which uses a nearest neighbor algo-
rithm to calculate melting temperatures, has been used successfully to
pick primers for the amplification of open reading frames from the yeast
genome. 1L21 Using this program, greater than 94% of PCR reactions gener-
ated useable products, 11 as detected by analyzing a small amount of product
on a gel. Ideally, primer pairs should be chosen so that they have similar
melting temperatures and so that the resulting PCR products are of similar
sizes. When possible, primers should be synthesized in the same format as
used for the PCR reactions (microtiter plates, either 96 or 384 well). Com-
puter scripts can be written that automate the process of primer selection
for groups of sequences or for an entire genome.
The success of PCR reactions can be checked by analyzing the products
on an agarose gel or by examining the microarray elements once they
have been spotted: fluorescein-labeled dNTPs can be included in the PCR
21 W. Rychlik, W. J. Spencer, and R. E. Rhoads, Nucleic Acids Res. 18, 6409 (1990).
[ 1] MICROARRAY-BASED EXPRESSION MONITORING 9
reactions and the array can be scanned for fluorescein to determine the
reaction success. PCR reactions that fail are noted and repeated, although
failures are generally arrayed along with successes in order to ease handling
and documentation (if space is not an issue). It is generally not necessary
to quantitate the amount of product if two-color hybridization (described
later) will be performed. In addition, it is assumed that even with inefficient
reactions, the amount of product will exceed the amount of target. PCR
reactions are spotted onto glass that is derivatized chemically by treatment
with reactive aldehydes (Table II) or polycations, such as polylysine. 6
Preparation of Polyadenylated mRNA
Small differences in the environmental conditions to which a cell is
exposed can have a profound impact on the global pattern of transcription. 5
If two growth conditions are to be compared, extreme caution should be
taken to ensure that the cells from which the mRNA is isolated are treated
equivalently. For example, cells should ideally be grown in the same batch
of media, in tissue culture-treated plasticware, and should be harvested at
similar densities if possible. Various methods can be used to rapidly isolate
total RNA from cells, depending on the organism. Following isolation, the
polyadenylated RNA is usually purified from total RNA on oligo(dT) resin.
The amount of polyadenylated RNA needed will depend on the particular
microarray, the labeling method, and the size of the hybridization chamber,
but is generally between 0.5 and 10/zg. With 10/zg of labeled material,
transcripts that are present at one copy per mammalian cell or one copy
per every 20 yeast cells can be detected. If mRNA quantities are limited
(0.5 tzg or less), the mRNA sample can be amplified by an in vitro transcrip-
tion step as described later.
Two-Color Analysis
Because microarrays have typically been manufactured using relatively
simple instruments, ensuring that identical amounts of DNA are deposited
at different locations has been difficult. This theoretical limitation can be
overcome by using a two-color labeling strategy. 16 Here target derived from
mRNA from one condition is labeled with one fluor, whereas target from
a different condition is labeled with a second fluor. Similar amounts of
labeled material (usually eDNA) from the two samples are cohybridized
to the microarray and the fluorescence intensity at the two appropriate
emission wavelengths is determined. A good estimate of the relative differ-
ences in abundance of a target in the two samples can be obtained by
comparing the ratio of the fluorescence intensities at the two wavelengths.
By always using the same reference sample, microarrays produced using
10 ANALYSIS OF GENE EXPRESSION [1]
different sets of PCR products and by different individuals can be compared.
Two-color strategies have been employed for mutation screening with oligo-
nucleotide microarrays 2 and could theoretically be used in expression analy-
sis, reducing the number of hybridizations that would need to be performed.
Array Design
The design of arrays for gene expression experiments should include
appropriate controls for signal linearity and specificity. Probes to targets
whose abundance is well characterized and probes to genes from different
organisms should be included on the microarray, for example, human
probes on an
Arabidopsis
microarray or bacterial genes on a yeast microar-
ray. Target for these control probes can be generated by cloning the probe
into a vector containing a phage promoter, and a poly(A) tract, and then
generating polyadenylated mRNA by runoff
in vitro
transcription using
the phage polymerase. This target can be added at various concentrations
or at various times during the mRNA isolation and hybridization. Probes
to ribosomal genes and to nontranscribed regions of the genome may also
be included. In addition, controls that allow different scans to be normalized
(as described later) should be arrayed. These may include multiple probes
to genes whose expression is not expected to vary in the experiment (in
yeast, probes complementary to the genes encoding actin and the
TATA-
binding protein have been used) or spots of total genomic DNA (for mi-
croarray experiments)) 1
Direct Labeling of Messenger RNA for Hybridization
to Oligonucleotide Microarrays
One of the simplest methods for generating target is to label mRNA
directly. At least two different methods have been reported: the mRNA
is first fragmented to 30-50 base sizes by precipitating the RNA, resus-
pending the sample in a buffer containing magnesium ions [40 mM Tris-
acetate (pH 8.1), 100 mM potassium acetate, 30 mM magnesium acetate]
and then heating the sample to 94 ° for 35 min. The RNA fragments are
then kinased by diluting the fragmentation reaction 2-fold and adding ATP
to 8/xM, dithiothreitol (DTr, to 3 mM), bovine serum albumin (BSA, 10
tzg/ml), and polynucleotide kinase. The reaction is incubated for 2 hr at
37 °. Then a biotinylated oligoribonucleotide (5'-biotin-AAAAAA 3') is
ligated directly to fragmented, kinased mRNA using T4 RNA ligase in a
buffer [50 mM Tris-HCl (pH 7.6), 10 mM DTT, and 1 mM ATP] containing
a 10-fold molar excess of
5'-biotin-AAAAAA
3'. 4
Heat-denatured mRNA (or total RNA) can also be incubated with a
biotinylated psoralen derivative (35 tzM, from Schleicher and Schuell,
[ 1 ] MICROARRAY-BASED EXPRESSION MONITORING 11
Keene, NH) in diethyl pyrocarbonate (DEPC)-treated
H20. 22
Psoralen will
intercalate RNA and can be cross-linked to the mRNA by exposing the
RNA-containing solution to ultraviolet light (350 nm) for 3 hr. After cross-
linking, the excess psoralen is removed by three extractions with water-
saturated n-butanol. The RNA is ethanol precipitated and fragmented in
a magnesium buffer as described earlier. This method has been used to
label prokaryotic transcripts that are difficult to purify away from ribo-
somal RNA. 22
The biotin-labeled fragments are hybridized to the microarray. After
washing, the label can be visualized by staining for 15 rain with a solution
containing 6× SSPE-T [0.9 M NaC1, 60 mM NaH2PO4 (pH 7.6), 6 mM
EDTA, 0.005% Triton], 1 mg/ml acetylated BSA, and 2/xg/ml streptavidin
R-phycoerythrin conjugate (Molecular Probes, Eugene, OR). The major
disadvantages of these approaches are that larger quantities of mRNA are
needed, that ribosomal RNA is labeled along with the messenger RNA,
possibly creating higher backgrounds, and that solutions need to be kept
RNase free at all steps.
Direct Labeling of cDNA for Hybridization
to Oligonucleotide Microarrays
Another simple method that can be used when significant amounts of
mRNA are available is direct labeling of cDNA. 7 Approximately 10-20
/~g polyadenylated RNA is first converted to single-stranded cDNA using
reverse transcriptase and an oligo(dT)21-primer essentially as described in
Table III, but scaling everything proportionally and using unlabeled dCTP
nucleotides. The cDNA is then phenol:chloroform extracted and precipi-
tated by the addition of 0.5 volumes of 7.5 M ammonium acetate and
2 volumes of ethanol. The pellet is washed with 70% (v/v) ethanol and
resuspended in 35/zl of a buffer (10 mM Tris-acetate (pH 7.5), 10 mM
magnesium acetate, and 50 mM potassium acetate) containing 1.5 mM
CoCI2.
The single-stranded cDNA is fragmented by adding -0.75 units
DNase I to the sample and incubating for 5 rain at 37 °. Following digestion,
the DNase I is inactivated by transferring the microfuge tube to a boiling
water bath for 15 min. It is important that the fragment sizes be checked
by analyzing i tzl of the reaction on a 2% agarose gel* as different batches
of DNase I may vary in potency, and underdigestion or overdigestion may
produce a poor signal. Optimally, the digested fragments should be about
50 bases in size. DNase I is also very sensitive to contaminants; for a clean
22 A. de Saizieu, U. Certa, J. Warrington, C. Gray, W. Keck, and J. Mous,
Nature Biotechnol.
16, 45 (1998).
* For maximum sensitivity, SYBR-II green (Molecular Probes), a dye that binds single-
stranded nucleic acids, is recommended instead of ethidium bromide.
12
ANALYSIS OF GENE EXPRESSION
Ill
digestion, the starting material should be relatively free of salts, particularly
EDTA.
The fragmented cDNA is then end labeled with biotin by the
addition of 25 units (U) terminal transferase and 1/zl (1 mM) biotin-N6-
ddATP (NEN, Boston, MA). The entire sample is hybridized to the array
(usually overnight at 42°). The hybridization kinetics are slightly different
than when RNA is hybridized and less stringent washes (15 min at 42 °
versus 50 ° in 0.5x SSPE-T) may be necessary. After hybridization, the
samples are stained with a phycoerythrin-streptavidin conjugate as de-
scribed earlier. This same method can be used to label genomic DNA
whose hybridization pattern can serve as an excellent control for the cDNA
hybridization pattern. Difficulties with this method include obtaining a
reproducible DNase I cutting pattern, verifying that all mRNA has been
converted to cDNA, and that large amounts of cDNA are required.
TABLE III
TARGET PREPARATION
2. Assemble following mix in microcentrifuge tube:
Reagent Volume (/zl)
Total mRNA (1.0/zg//zl) a 5.0
Control mRNA cocktail (0.5 ng//zl) b 1.0
Oligo(dT) 21-mer (2.0/zg//~l) 4.0
HzO (DEPC treated) 17.0
27.0/zl
2. Denature mRNA for 3 min at 65 °. Anneal oligo(dT) to mRNA for 10 min at 25 °. Add
5x First strand buffer c 10.0
10X Dithiothreitol (DTF, 0.1 M) 5.0
RNase block (20 U//zl) 1.5
dATP, dGTP, dTTP cocktail (25 mM each) 1.0
dCTP (2 raM) 2.0
Cy3-dCTP (1
raM) d 2.0
SuperScript II reverse transcriptase (200 U//~I) 1.5
50.0 ~1 total
3. Reverse transcribe polyadenylated RNA for 2 hr at 37 °
4. Add 5.0/zl of 2.5 M sodium acetate and 110/zl 100% ethanol at 25 °e
5. Centrifuge for 15 min at 25 ° in microfuge to pellet cDNA/mRNA hybrids f
6. Remove and discard supernatant and carefully wash pellet with 0.5 ml 80% (v/v) eth-
anol g
7. Dry pellet in Speed-Vac and resuspend in 10.0/zl lX TE (pH 8.0) h
8. Boil sample 3 man to denature cDNA/mRNA hybrids. Chill on ice immediately
9. Add 2.5 pA 1 N NaOH and incubate for 10 min at 37 ° to degrade mRNA
10. Neutralize cDNA mixture by adding 2.5/zl 1 M Tris-HC1 (pH 6.8) and 2.0/zl 1 M
HCI
[ 1] MICROARRAY-BASED EXPRESSION MONITORING 13
TABLE III
(Continued)
11. Add 1.7 tzl 2.5 M sodium acetate and 37 tzl 100% ethanol
12. Centrifuge for 15 rain at full speed in microfuge to pellet cDNA
13. Remove and discard supernatant and wash pellet with 0.5 ml 80% ethanol i
14. Dry pellet in Speed-Vac and resuspend in 6.5/~l H20
15. Add 2.5/zl 20× SSC j and 1.0 p.l 2% SDS
16. Heat at 65 ° for 0.5 rain to dissolve target mixture
17. Centrifuge for 2 min in microfuge at high speed to pellet trace debris k
18. Transfer supernatant to new tube
19. Final target concentration should be ~0.5 tzg//~l per fluor in 5x SSC with 0.2% SDS
Suggested materials
StrataScript RT-PCR kit (Stratagene)
Oligo(dT) 21-mer (treated with 0.1% DEPC to inactivate ribonucleases)
100 mM dATP, dCTP, dGTP, dTrP (Pharmacia, Piscataway, N J)
1 mM Cy3-dCTP (Amersham, Piscataway, NJ)
1 mM Cy5-dCTP (Amersham)
1 mM fluorescein-12-dCTP (DuPont, Boston, MA)
SuperScript II RNase H-reverse transcriptase (GIBCO-BRL, Gaithersburg, MD)
Total mRNA purified from total RNA using Oligotex-dT (Qiagen)
b Control mRNAs from
in vitro
transcription are chosen, based on the experiment.
" 5×
first strand buffer: 250 mM Tris-HC1 (pH 8.3), 375 mM KC1, 15 mM KCI.
d To label mRNA with other fluors, substitute F112- or Cy5-dCTP in the reaction.
e Chilling or use of >2 volumes of ethanol results in the unwanted precipitation of free label.
f Pellet product on one side of the tube, then remove supernatant from the other side.
To prevent loss of pellet, centrifuge 1 rain before removing 80% ethanol.
h To prevent loss of pellet, centrifuge 1 rain before removing 80% ethanol. The product
often smears up the side of the tube.
i To prevent loss of pellet, centrifuge 1 rain before removing 80% ethanol.
J 20× SSC buffer: 3 M NaC1, 0.3 M sodium citrate (pH 7.0).
k Tiny particles interfere with hybridization, which is carried out under a coverslip.
Generating Labeled Target by in Vitro Transcription
When only limited amounts of eDNA are available, amplification steps
may be necessary? First strand eDNA synthesis is performed essentially
as described in Table III, except that the polyadenylated messenger RNA
is primed for reverse transcription with an oligo(dT) primer that contains
a phage T7 promoter sequence at its 5' end. 23,24 The second strand of the
eDNA is then synthesized with Escherichia coli DNA polymerase I. 4,25
Approximately 0.5 tzg of the double-stranded eDNA is used as template
23 j. Eberwine, H. Yeh, K. Miyashiro, Y. Cao, S. Nair, R. Finnell, M. Zettel, and P. Coleman,
Proc. Natl. Acad. Sci. U.S.A.
89, 3010 (1992).
24 R. N. Van Gelder, M. E. von Zastrow, A. Yool, W. C. Dement, J. D. Barchas, and J. H.
Eberwine,
Proc. Natl. Acad. Sci. U.S.A.
87, 1663 (1990).
25 U. Gubler and B. J. Hoffman,
Gene
25, 263 (1983).
14
ANALYSIS OF GENE EXPRESSION
[ll
for an in vitro transcription reaction using T7 RNA polymerase in a buffer
containing 7.5 mM ATP and GTP, 5.6 mM UTP and CTP, and 1.875 mM
biotin-6-UTP and biotin-ll-CTP. The in vitro-transcribed RNA is then
ethanol precipitated and fragmented using magnesium ions as described
earlier before hybridization to the microarray. It is important that the T7
promoter-oligo(dT) primer be high-performance liquid chromatography
(HPLC) purified to ensure that it is full length, as oligonucleotide synthesis
is performed 3' to 5' and contamination with truncated oligonucleotides
will result in poor in vitro transcription yields. This method results in a
large amplification of the amount of starting material (up to 50-fold). Its
disadvantages are that it is more complex and time-consuming, that it
employs extra enzymatic steps, that regions toward the 3' ends of genes
may be overrepresented in the final product, and that all solutions must
be kept RNase free.
Microarray Target Preparation by Single-Round Reverse Transcription
All methods described previously have been used to prepare target for
hybridization to oligonucleotide microarrays, but should work just as well
for DNA microarrays. DNA microarray hybridization targets are commonly
generated by a single round of reverse transcription in the presence of any
of several fluorescently labeled nucleotides (Cy3, Cy5, fluorescein) using
an oligo(dT) primer (Table III). Less starting material is required for hy-
bridization because hybridization is generally performed in a very small
volume (under a coverslip). Random nonamers or hexamers can also be
used instead of oligo(dT) to prime cDNA synthesis, 11 permitting the detec-
tion of RNA species that are not polyadenylated.
Hybridization and Washing
The labeled target is hybridized to a microarray for times ranging from
2 to 20 hr. Arrays purchased from commercial suppliers may come enclosed
in a hybridization cassette. Custom water-tight hybridization chambers, just
large enough to enclose a microscope slide, can also be fabricated in a
machine shop or purchased (Telechem International). Oligonucleotide hy-
bridizations are typically performed between 42 ° and 50 °, whereas DNA
microarray hybridizations are performed between 55 ° and 70 °. The linear
range of the microarray can sometimes be extended by performing a second
hybridization for a longer or shorter time. Different buffers have been
used, including 6)< SSPE-T [0.9 M NaCI, 60 mM NaH2PO4 (pH 7.6), 6 mM
EDTA, 0.005% Triton] and 5× SSC [150 mM NaC1, 15 mM sodium citrate
(pH 7.0)]. Dedicated wash stations can be purchased from some microarray
[ ] ] MICROARRAY-BASED EXPRESSION MONITORING
15
suppliers. These instruments flush the arrays with buffers that have been
heated to the correct temperature, thus standardizing and easing the wash-
ing process. The DNA microarrays can also be washed by immersion in a
beaker containing a stir bar and a buffer at the appropriate concentration
and temperature (Table IV). Wash times, temperatures, and stringencies
will depend on the experiment (whether RNA or DNA is being hybridized)
and may need to be determined empirically. Some protocols call for a short,
low-stringency wash (15 min to 1 hr in 0.5x SSPE + 0.005% Triton X-
100). An example is given in Table IV. Blocking agents such as unlabeled
fragmented genomic (10/zg/ml) DNA may also be included.
Scanning Microarrays
Scanning systems can be purchased from manufacturers such as Hewlett
Packard, General Scanning, or Molecular Dynamics. Scanners generally
contain a motor for moving either the array or a mirror, a laser, confocal
TABLE IV
HYBRIDIZATION AND WASHING
1. Place microarray in hybridization cassette a
2. Add 5.0/.d of 5x SSC + 0.2% SDS to bottom of cassette for humidification b
3. Aliquot 5.0/zl of fluorescent target (see Table III) onto edge of microarray
4. Cover target droplet with 22-mm 2 glass eoverslip using forceps c
5. Seal cassette containing microarray
6. Submerge hybridization cassette in water bath set at 62 °
7. Hybridize for 6 hr at 62 °
8. Following hybridization, remove microarray from hybridization cassette and place mi-
croarray
immediately
into beaker containing 400 ml lX SSC and 0.1% SDS d
9. Wash microarray by gentle buffer agitation for 5 min at room temperature e
10. Transfer microarray to second beaker containing 400 ml 0.1× SSC and 0.1% SDS
11. Wash microarray by gentle buffer agitation for 5 min at room temperature
12. Rinse microarray briefly in third beaker containing 0.1 x SSC to remove SDS
13. Allow microarrays to air dryf
14. Scan microarrays for fluorescence emission
"Cassettes can be purchased from Telechem International.
b Prevents dessication of the fluorescent sample.
c Coverslips must be dust and particle free to allow even seating on the array. Air bubbles
trapped under the coverslip exit after several minutes at 62 °.
d Use a 600-ml Pyrex beaker containing a magnetic stir bar. Alternately, wash stations
can be purchased from Telechem International.
e Buffer agitation is accomplished by placing the beaker on a stir plate.
f Cy3 and Cy5 are scanned dry.
16
ANALYSIS OF GENE EXPRESSION [ II
lenses, filter sets, and a photomultiplier tube (PMT) for collecting the
fluorescent emission. Fluorescent microscopes can also be modified to scan
the surface of a slide. 16 The number of photons received by the photomulti-
plier at every position on the array is stored on a personal computer in
files that can be read into the various data analysis programs (Affymetrix
GENECHIP, Imagene microarray software, Biodiscovery, AIS/BMS).
These programs either use element coordinate information supplied by the
user or allow the user to place a grid over the scanned image. The programs
return an intensity value for every pixel in every array element in the
scanned image.
Data Analysis
The analysis of data from the scanned image is a challenging problem
associated with array-based experiments and one that is often given little
consideration. The more mundane questions are what constitutes signal
above background and what is the linear range for a particular hybridiza-
tion. Different fluors may give different levels of backgrounds. Variations in
scanner laser alignment may give different overall intensities. If background
values are not set correctly, errors in estimates of both relative and absolute
abundance may arise.
Several approaches have been used to calculate background levels.
Some users place a border around a particular element on the array in the
area where there is no bound nucleic acid and then average the intensity
values from the border region, n This should work well theoretically, except
that in some cases the immobilized nucleic acids work as a blocking agent,
such that regions on the array where there is no nucleic acid may have a
higher level of fluorescence than regions containing nonhybridizing nucleic
acids. Alternately, the pixel intensity values for the entire element can be
ranked from lowest to highest. The background level can be set to the
intensity of the pixel for which 95% of the values are higher. In both
cases, statistical methods are used to exclude outlying data points from
the analysis.
At Affymetrix, scientists synthesize a second oligonucleotide probe that
contains a single base mismatch at the central location on the probe relative
to the perfect match for every element on the microarray. This mismatch
probe is placed adjacent to the perfect match probe. 40ligonucleotide
probes are very sensitive to the presence of mismatches, and hybridization
at the mismatch position is usually reduced greatly. The mismatch signal
can then be subtracted as background from the perfect match signal.
Different methods also exist for calculating the signal for each element
on the array. After excluding outliers, one can compute the mean of all
[ 1] MICROARRAY-BASED EXPRESSION MONITORING
17
pixels for an element that are above background or one can rank the
intensities of all pixels in the array element and then use the intensity for
which 75% of the values are smaller.
Scan-to-Scan Normalization
Different scans may have higher or lower intensities, depending on the
scanner, the fluor being used, or any of a number of other different factors.
These differences can be normalized using at least two different methods.
First, the hybridization intensity from appropriate controls whose signal
is not expected to vary can be used to normalize the scan intensity. This
method works best when a large number of these controls is used. Second,
if the microarrays contain a very large number of elements and wholesale
differences in mRNA levels are not expected, the average overall hybridiza-
tion intensity for all the elements on the microarray can be calculated and
used to normalize signal strength.
Obtaining absolute estimates of target abundance by hybridization has
always been a difficult problem. Different DNA sequences may have differ-
ent melting temperatures and thus different hybridization properties, and
it has been difficult to ensure that identical amounts of probe are deposited
at all locations on the microarray. By using a two-color strategy for microar-
ray hybridizations, estimates of
relative
abundance can be obtained when
the hybridization signal is in the linear range. This is expected for most
probes, as in theory much more probe is on the microarray than target.
The experimental design should include a number of control probes whose
target can be added at different amounts in order to determine the linear
range for a series of hybridizations. More quantitative estimates could
theoretically be obtained by carefully selecting probes to have similar hy-
bridization properties and by improving the manufacturing process (e.g.,
by ensuring that equimolar amounts of probe are applied at each position
on the microarray).
Oligonucleotides are even more sensitive to sequence-specific differ-
ences in annealing behavior than longer PCR products, creating an even
larger barrier to measuring target abundance. Lockhart
et al. 4
have shown
that quantitative estimates of transcript abundance can be obtained by
using a number of different oligonucleotide probes chosen using a set of
heuristic rules. When fluorescently labeled target is hybridized, the fluores-
cent signal is quantitative (within a factor of two) when the background-
corrected signal from 20 oligonucleotide probes, of different sequence but
all complementary to an mRNA, is integrated. However, the number of
probes needed for a quantitative estimate of target abundance can be
expected to drop as algorithms for predicting melting temperatures and
"] 8 ANALYSIS OF GENE EXPRESSION [ 1 ]
hybridization behavior for particular probes are refined. Despite these
somewhat daunting considerations associated with data analysis, microar-
rays will probably have their widest application as a screening tool: most
researchers will be completely satisfied to learn which genes are induced
or repressed under their favorite growth condition or genetic background
and may not be too concerned about whether induction is 10- or 15-fold.
Discussion
The labeling protocols presented here have all been tested, but not
necessarily optimized. Many variations on the protocols given here are
feasible: poly(A) purification steps might be eliminated, different fluors
may work as well or better than those described here, and PCR amplifica-
tion of cDNA may be possible. If microarrays are purchased from a com-
mercial supplier, descriptions of methods will most likely be provided
along with the product.
A potential problem for all microarray experiments is cross-hybridiza-
tion. Because microarrays generally have longer probes than do oligonucle-
otide arrays, some have argued that their specificity is greater and that the
potential for cross-hybridization is lower. However, the probability that a
25-mer will be duplicated randomly in the human genome is very low
(p = 2.0 )< 10-6).
However, genome sequence is not a random collection
of A, C, G, and T. Coding regions that have very similar or identical
nucleotide sequence are distributed throughout the yeast genome, creating
some potential for cross-hybridization. Such duplications can be expected
or have been observed in the genomes of other organisms. The power of
microarrays is therefore enhanced when the complete genome sequence is
known and the specific sequences that may cross-hybridize can be known
a priori.
Sophisticated approaches to dealing with the large amount of data that
is produced in microarray-based experiments and novel ways to query the
data, particularly if microarrays are to be used for purposes other than for
screening, also need to be developed. An experiment using an array in
which probes to all of the genes in the yeast genome are present generates
a minimum of 6000 pieces of data.
Finally, it should be kept in mind that transcript abundance should not
be equated with protein abundance or even promoter strength. Different
mRNAs will have different half-lives and different decay directions (5' to
3', or vice versa). Even if the measured signal levels reflect the levels of a
translationally competent mRNA, the encoded proteins may be regulated
posttranslationally. Microarrays will have their widest application in con-
junction with other tools, such as mass spectrometry.
[2]
EXPRESSION SYSTEMS IN COMPARISON
19
[21 Protein Expression in Mammalian
and Insect Cell Systems
By
SABINE GEISSE and HANS P. KOCHER
Introduction
Almost three decades ago the first experiments of transfer of naked
DNA into mammalian cells were performed. Since then these techniques
have been explored thoroughly and refined into what is now called "eukary-
otic expression systems."
These transfer techniques actually cover a large diversity of systems,
which can be arbitrarily grouped into the following categories: (1) gene
transfer via transfection of plasmids, leading either to stably integrated
copies of the transgene into the host genome (stable expression) or to
episomally replicating plasmids, which are gradually lost, unless selective
pressure via antibiotics is applied (transient expression) and (2) gene trans-
fer via infection: Several systems based on recombinant DNA or RNA
viruses (including retroviruses) are available, which allow expression of
transgenes again on a stable or transient basis.
The transfer of genetic material into suitable recipient cells is used for
many purposes, ranging from expression cloning and mutational analysis
to gene or cell therapy. In this article the focus of discussion will be devoted
entirely to gene transfer to achieve recombinant protein production. Table
I summarizes the most frequently employed expression systems for this
purpose.
Prominent examples of the different types of systems will be described
in theoretical and practical detail later. A few general remarks should
precede the overview, however.
One of the key factors for success in recombinant protein expression
is optimal cell culture maintenance. The recipient cell lines should exhibit
logarithmic growth at the time point of transfection/infection, and the
absence of mycoplasma and other contaminating agents needs to be con-
trolled regularly. The use of antibiotics and antimycotics in the cell culture
medium is frequently recommended; however, we prefer to cultivate our
cell lines without antibiotics except for the selection of recombinants. Care
should also be taken with respect to the age of the culture; switching
routinely to younger passages from frozen stocks is certainly advisable.
Except for the insect cell lines kept at 28 ° , all other mammalian cells are
Copyright © 1999 by Academic Press
All rights of reproduction in any form reserved.
METHODS IN ENZYMOLOGY, VOL. 306 0076-6879J99 $30.01)
20 ANALYSIS OF GENE EXPRESSION [2]
TABLE I
EXPRESSION SYSTEMS FOR RECOMBINANT PROTEIN PRODUCTION
Transfection systems based Transfection systems Expression systems
on stable based on transient based on
integration of transgene expression of transgene viral infection
COS cells
HEK.EBNA cells
CHO, BHK, NIH 3T3,
HEK 293 cells
Myeloma cells (Sp2/0, J558L,
NS/O)
MEL cells
Drosophila
Schneider $2 cells
Baculovirus
Alphavirus: Sindbis
virus, Semliki
Forest virus
Vaccinia virus
cultivated at 37°/5% (v/v) CO2 in a humidified atmosphere and are subcul-
tured twice per week.
Finally, to enhance the frequency of stable integration events in Chinese
hamster ovary (CHO) and myeloma cells, the recombinant expression plas-
mid should be linearized by restriction enzyme digestion at an appropriate
site in the vector to facilitate integration.
Expression in Chinese Hamster Ovary Cells
Among all cell lines suitable for recombinant protein production, the
CHO cell line established in 1957 by Puck is by far the most popular. Many
features contribute to its popularity: good growth characteristics in serum-
free and serum-containing media, ease of transfectability, genetic stability,
and extensive characterization in terms of endogenous viral load and per-
missiveness for adventitious agents/viruses)
In addition, CHO cells were shown to be highly suitable for the induction
of gene amplification mechanisms with the aim of increasing productivity.
One such mechanism relies on the inhibition of dominant amplification
markers such as glutamine synthetase or adenosine deaminase by the addi-
tion of specific potent enzyme inhibitors such as methionine sulfoximine
or 2'-deoxyformycin, respectively. 2'3
Alternatively, recessive amplification markers can be employed; wild-
type dihydrofolate reductase (dhfr) is the most commonly used. 4 A deriva-
1 F. M. Wurm,
in
"Mammalian Cell Biotechnology in Protein Production" (H. Hauser and
R. Wagner, eds.), p. 87. W. de Gruyter Verlag, Berlin, New York, 1997.
2 M. I. Cockett, C. R. Bebbington, and G. T. Yarranton,
BioTechnology
8, 662 (1990).
3 R. J. Kaufman, P. Murtha, D. E. Ingolia, C Y. Yeung, and R. E. Kellems,
Proc. Natl. Acad.
Sci. U.S.A.
83, 3136 (1986).
4 R. E. Kellems,
Curr. Opin. Biotechnol.
2, 723 (1991),
[9,] EXPRESSION SYSTEMS IN COMPARISON
21
tive of the original CHO K1 cell line established in 1980 by Urlaub and
Chasin 5 by chemical mutagenesis harbors a nonfunctional dhfr gene (CHO
DUK X Bll cells). Due to mutation, these cells are unable to convert
folate to tetrahydrofolate, a biocatalyst required for the de novo synthesis
of purines and pyrimidines. Survival of cells is sustained if a supply of
precursors (adenosine, deoxyadenosine, and thymidine) is provided by me-
dia components for utilization in the salvage pathway of purine and pyrimi-
dine synthesis. Hence, cell culture medium devoid of these precursors is
used for the primary selection of cells after cotransfection of a functional
dhfr gene in conjunction with the gene of interest.
Gene amplification is induced by adding amethopterin (methotrexate,
MTX) in stepwise increments to the culture medium. This folic acid analog,
or antifolate, binds and inhibits dihydrofolate reductase stoichiometrically,
forcing the cells to undergo genomic rearrangements and subsequent gene
amplification for survival. Starting with low concentrations of MTX (in
the nanomolar range), the concentration can be increased sequentially to
several micromoles per liter of medium, giving rise to amplified stretches
of DNA containing several hundred copies of the originally transfected
plasmid(s) per cell. 6
The underlying mechanistic details of gene amplification have been
investigated and discussed for many year~ ~,'ithout a final, conclusive result
being reached. An in-depth overview on current knowledge can be found
in an article published by Wurm. 1
This article discusses only a few points of essential importance for
the success of experiments aiming at dhfr-linked, MTX-mediated gene
amplification. First of all, a carefully designed and constructed expression
plasmid is essential. It has been shown that the gene of interest and the
selectable marker can be cotransfected on two individual plasmids. 7 As the
amplified genomic locus is much larger in size than the original plasmids,
coamplification of the two plasmids is likely to
occur. 8'9
A more sophisti-
cated approach involves coexpression of the two genes from the same
plasmid via a bicistronic messenger RNA. If a promotorless selectable
marker gene, e.g., the dhfr gene is placed 3' of the gene of interest, transcrip-
tion is driven solely by the 5' upstream promotor. Initiation of translation
of the 3' gene is, however, very inefficient in comparison to the 5' gene of
5 G. Urlaub and L. A. Chasin, Proc. Natl. Acad. Sci. U.S.A. 77, 4216 (1980).
6 R. J. Kaufman, Methods Enzymol. 185, 537 (1990).
7 R. J. Kaufman, L. C. Wasley, A. J. Spiliotes, S. D. Gossels, S. A. Latt, G. R. Larsen, and
R. M. Kay, Mol. Cell, Biol. 5, 1750 (1985).
s M. Carroll, M. L. DeRose, P. Gaudray, C. M. Moore, D. R. Needham-Vandevanter, D. D.
von Hoff, and G. M. Wahl, Mol. Cell. Biol. 8, 1525 (1988).
9 E. Heard, S. V. Williams, D. Sheer, and M. Fried, Proc. Natl. Acad. Sci. U.S.A. 88, 8242 (1991).
22
ANALYSIS OF GENE EXPRESSION [2]
interest, resulting in a 40- to 300- fold difference in protein quantity between
the two gene products. As sufficient quantities of dhfr are the prerequisite
for the survival of cells in methotrexate-containing medium, drug resistance
is linked directly to enhanced protein production from the 5' transgene, a°'n
The strong selection forces applied favor and induce genetic instability,
however, frequently resulting in genomic rearrangements with concurrent
loss of the 5' transgene. For this reason, a new generation of bicistronic
vectors was created featuring an internal ribosomal entry site element
(IRES) upstream of the selectable marker to facilitate its translation. 1233
Second, the stepwise increase of MTX in the medium can be performed
either on cell pools or on individually selected clones. The latter procedure
is disadvantageous, however, because the vigorous gene amplification treat-
ment induces the heterogeneity of cells associated with loss of the clonal
phenotype during each round of amplification. 14
Once the highest degree of gene amplification, reflected in maximal
titers of recombinant protein, has been reached, it is essential to perform
a cloning experiment in order to retrieve a stable, homogeneous cell popula-
tion for further protein production.
Whether protein production, especially on large scale, can or should be
done under continued selective pressure or in the absence of methotrexate
is controversial. 15'16 The physical location of the amplified sequences and
the degree of amplification achieved have profound effects on the stability
of the production clone. Maintaining constant selective pressure requires
an empirical decision on a case-by-case basis.
Example 1: Expression Experiments Performed in CHO Cells
1. Maintenance of Cell Culture. CHO DUK X Bll cells should be kept in
MEM Alpha medium containing ribonucleosides and deoxyribonucleosides
[MEM Alpha (+), Life Technologies, Rockville, MD] supplemented with
10% (v/v) fetal calf serum (FCS). If CHO K1 cells are used, they can be
grown in either (1:1) Dulbecco's modified Eagle's medium (DMEM)/
Ham's F12 medium or Ham's F12 medium alone, both enriched by 10%
FCS. All these media contain proline, which eliminates the need for supple-
menting the media for growth of the proline-auxotroph CHO cells.
10 E. Boel, K. L. Berkner, B. A. Nexo, and T. W. Schwartz,
FEBS Lett.
219, 181 (1987).
~1 R. J. Kaufman, P. Murtha, and M. V. Davies,
EMBO
Z 6, 187 (1987).
a2 M. V. Davies and R. J. Kaufman,
Curr. Opin. Biotechnol.
37 512 (1992).
~3 p. S. Mountford and A. G. Smith,
Trends Genet.
117 179 (1995).
14 R. E. Kellems, "Gene Amplification in Mammalian Cells." Dekker, New York, 1993.
15 U. H. Weidle, P. Buckel, and J. Wienberg,
Gene 667
193 (1988).
16 M. G. Pallavicini, P. S. DeTeresa, C. Rosette, J. W. Gray, and F. M. Wurm,
Mol. Cell. Biol.
10, 401 (1990).
[2] EXPRESSION SYSTEMS IN COMPARISON
23
2. Transfection.
Several techniques are suitable for the transfection of
CHO ceils, e.g., calcium phosphate-mediated gene transfer, lipofection, and
electroporation. Whatever method is chosen, optimal transfection efficien-
cies, as judged by protein levels expressed and cell viability, need to be
determined empirically with respect to the quantity of plasmid used, the
quantity of reagent used for lipofection, and electroporation conditions.
Once optimal conditions have been defined, it is advisable to establish
several transfection pools in parallel to increase the probability of establish-
ment of a high-producer cell line.
3. Primary Selection.
Selection is usually started 48 hr after transfection.
IF CHO K1 cells are used, a selectable marker conferring antibiotic resis-
tance should be cotransfected to allow selection of positive transfectants
(e.g., neomycin, hygromycin, or puromycin resistance genes).
In the case of CHO DUK X cells intended for subsequent gene amplifi-
cation experiments, primary selection can be performed by selecting for
growth in MEM Alpha medium depleted of nucleosides [MEM Alpha ( -)],
i.e., for
dhfr
expression. Alternatively, an antibiotic resistance gene can
also be cotransfected for initial selection, followed by a switch to
dhfr
selection. It is also possible to pursue a simultaneous double-selection
strategy with different marker combinations, with the aim to enrich the
cell pools for high-level expressing cells. 17,1s
4. Gene Amplification.
Once the cell pools subjected to primary selec-
tion have resumed logarithmic growth, methotrexate is added to the me-
dium, usually at a starting concentration of 5-20 nM. This induces a severe
crisis associated with cell death, which can last 3-4 weeks, until by outgrowth
of cell islets resistant to this concentration the tissue culture flask is repopu-
lated. The MTX concentration should not be augmented before the cell
pools have fully recovered and are growing normally again, i.e., after two
to three passages. Repeating the same procedure, the MTX concentration
is increased in a stepwise fashion, e.g., in fivefold increments. During this
procedure it is important to monitor production titers at each level of MTX,
as these will vary because not all cell pools are equally amplifiable. It is
also advisable to freeze some vials of cells at each MTX concentration as
a backup.
5. Cloning.
During the process of MTX-induced gene amplification,
usually one cell pool will emerge producing the highest levels of recombi-
nant protein at a maximal MTX concentration. From this population homo-
geneous clones are derived, either by limiting dilution cloning or (faster,
but less well defined) by isolation of cell islets via cloning cylinders. Again
17 M. Wirth, J. Bode, G. Zettlmeissl, and H. Hauser,
Gene
73, 419 (1988).
18 M. J. Page and M. A. Sydenham,
BioTechnology
9, 64 (1991).
24
ANALYSIS OF
GENE EXPRESSION [2]
all clones require careful analyses of production titers, cell growth rates, and
also stability of production of the recombinant protein over several weeks.
Expression Using Myeloma Cells
The most frequently used cell lines for recombinant expression, i.e.,
CHO cells, BHK cells, and HEK 293 cells, grow adherently and require
tedious adaptation to suspension culture if large-scale production, for in-
stance in roller bottles, spinner culture, or bioreactors, is to be used. An
alternative as host cells are myeloma cell lines: they grow naturally in single
cell suspension and can be adapted easily to serum-free growth. Originally
used as the immortal fusion partner in the establishment of hybridomas,
these often nonsecreting B cells retain their potential as "professional"
secretory cells. The most commonly used myeloma cell lines for recombi-
nant protein production are J558L [secreting immunoglobulin (Ig) Zl light
chains19], nonsecreting Sp2/0 Agl42°,21 and NSO cells. 22-24
For expression of engineered chimeric or humanized antibodies, these
cell lines proved to be extremely useful. Other types of proteins were also
expressed successfully in myeloma cells. 19,25
Following cotransfection of dominant antibiotic selection markers such
as neomycin or hygromycin, positive transfectants can be selected in media
containing the corresponding antibiotic. Induction of gene amplification
using glutamine synthetase 22 or dihydrofolate reductase 21 genes as markers
is also possible.
Dhfr-mediated gene amplification is, however, complicated by the fact
that these cells harbor a functional
dhfr
gene. To overcome this problem,
a variant mouse
dhfr
gene carrying a point mutation with concomitant
amino acid exchange (leucine to arginine at position 22 of the enzyme) is
used. 26 If the mutant
dhfr
gene is introduced into myeloma cells, preferential
amplification over the endogenous
dhfr
gene on MTX treatment is induced,
19 A. Traunecker, F. Oliveri, and K. Karjalainen,
TIBTECH
9, 109 (1991).
20 H. Dorai and G. P. Moore, J.
Imrnunol.
139, 4232 (1987).
21 S. D. Gillies, H. Dorai, J. Wesolowski, G. Majeau, D. Young, J. Boyd, J. Gardner, and
K. James,
BioTechnology
7, 799 (1989).
22 C. R. Bebbington, G. Renner, S. Thomson, D. King, D. Abrams, and G. T. Yarranton,
BioTechnology
10, 169 (1992).
23 C. Rossmann, N. Sharp, G. Allen, and D. Gewert,
Protein Express. Purif.
7, 335 (1996).
24 W. Zhou, C C. Chen, B. Buckland, and J. Aunins,
Biotechnol. Bioeng.
55, 783 (1997).
25 p. Lane, T. Brocker, S. Hubele, E. Padovan, A. Lanzavecchia, and F. McConnell, J.
Exp,
Med.
177, 1209 (1993).
26 C. C. Simonsen and A. D. Levinson,
Proc. Natl. Acad. Sci. U.S.A.
80, 2495 (1983).
[21 EXPRESSION SYSTEMS IN COMPARISON 25
as the mutant enzyme displays a 270-fold lower affinity for methotrexate
than the wild-type dhfr. It should be noted that the starting concentration
of methotrexate required is higher than for dhfr-minus CHO cells in order
to silence the endogenous copies of the dhfr gene. Also, the maximal degree
of amplification achievable with respect to copy number will be lower due
to the insensitivity of the mutant dhfr toward
MTX. 6
Results expressed as product titers obtained using myeloma cells as
recipients are impressive. 19'22-24'27 Special emphasis should be placed again
on careful expression vector design to fully exploit the potential of these
cells. Apart from strong viral promotors, expression plasmids featuring
an immunoglobulin promotor/enhancer combination were shown to be
extremely powerful in driving transcription in myeloma cell systems. 19
Example 2: DHFR-Linked Expression in Sp2/O Cells
1. Cell Culture Maintenance. Sp2/0 cells are easy to cultivate in RPMI
1640-based media supplemented with 10% FCS and 5 x 10 -5 M 2-mercapto-
ethanol. They exhibit some sensitivity toward overgrowth and to too high
dilutions, thereby requiring routine subculturing on the basis of cell count
and viability determinations.
2. Transfection. The most suitable transfection method for suspension
cells is certainly electroporation. Electroporation conditions yielding opti-
mal transfection efficiencies need to be determined empirically. Again it
is recommendable to transfect several cell pools in parallel.
3. Primary Selection. If a chimeric antibody molecule is to be produced,
an antibiotic resistance gene can be linked to, e.g., the light chain sequences
on one plasmid and the dhfr mutant gene to the heavy chain sequences on
a second plasmid. Alternatively, if only a single chain molecule is desired,
a selection plasmid such as pSV2neo can be cotransfected. Depending on
the cotransfected antibiotic resistance marker, primary selection can be
performed using neomycin, hygromycin, or puromycin.
4. Gene Amplification Using Methotrexate. In essence, the gene amplifi-
cation protocol used for myeloma cells follows the outline of the procedure
for CHO cells, with two exceptions. The starting concentration of metho-
trexate is higher (200 nM) and usually maximal production titers are ob-
tained in three rounds of amplification.
5. Cloning. A limiting dilution cloning experiment is performed subse-
quently using the highest producing cell pool to derive stable production
clones.
27 D. K. Robinson, J. Widmer, and K. Memmert,
J. Biotechnol.
22, 41 (1992).