Mapping and validation of major quantitative trait loci for kernel length in wild barley (Hordeum vulgare ssp. spontaneum)
Bạn đang xem bản rút gọn của tài liệu. Xem và tải ngay bản đầy đủ của tài liệu tại đây (845.1 KB, 9 trang )
Zhou et al. BMC Genetics (2016) 17:130
DOI 10.1186/s12863-016-0438-6
RESEARCH ARTICLE
Open Access
Mapping and validation of major
quantitative trait loci for kernel length in
wild barley (Hordeum vulgare ssp.
spontaneum)
Hong Zhou1†, Shihang Liu1†, Yujiao Liu1†, Yaxi Liu1*, Jing You1, Mei Deng1, Jian Ma1, Guangdeng Chen1,
Yuming Wei1, Chunji Liu2 and Youliang Zheng1
Abstract
Background: Kernel length is an important target trait in barley (Hordeum vulgare L.) breeding programs. However,
the number of known quantitative trait loci (QTLs) controlling kernel length is limited. In the present study, we
aimed to identify major QTLs for kernel length, as well as putative candidate genes that might influence kernel
length in wild barley.
Results: A recombinant inbred line (RIL) population derived from the barley cultivar Baudin (H. vulgare ssp.
vulgare) and the long-kernel wild barley genotype Awcs276 (H.vulgare ssp. spontaneum) was evaluated at one
location over three years. A high-density genetic linkage map was constructed using 1,832 genome-wide diversity
array technology (DArT) markers, spanning a total of 927.07 cM with an average interval of approximately 0.49 cM.
Two major QTLs for kernel length, LEN-3H and LEN-4H, were detected across environments and further validated in a
second RIL population derived from Fleet (H. vulgare ssp. vulgare) and Awcs276. In addition, a systematic search of
public databases identified four candidate genes and four categories of proteins related to LEN-3H and LEN-4H.
Conclusions: This study establishes a fundamental research platform for genomic studies and marker-assisted selection,
since LEN-3H and LEN-4H could be used for accelerating progress in barley breeding programs that aim to improve
kernel length.
Keywords: Barley, Genetic linkage map, Kernel length, QTL, Validation, Candidate gene
Background
Barley (Hordeum vulgare L.) is one of the seven cereal
crops grown worldwide and widely used in the animal
feed and food industry. In 2012, barley was cultivated on
51.05 million hectares worldwide, resulting in the production of approximately 129.9 million metric tons (http://
www.fao.org/home/en/). Barley is diploid (2n = 14), and
its seven chromosomes share homology with those of
other cereal species such as wheat, rye, and rice; therefore,
* Correspondence: ;
†
Equal contributors
1
Triticeae Research Institute, Sichuan Agricultural University, Wenjiang,
Chengdu 611130, China
Full list of author information is available at the end of the article
it is an ideal species for genetic mapping and quantitative
trait locus (QTL) analysis [1].
Significant progress has been made since the advent of
molecular markers in genetic and QTL mapping. The
first genetic map in barley was constructed using restriction fragment length polymorphism (RFLP) markers [2],
whereas additional markers were used to build and improve barley linkage maps, including single nucleotide
polymorphisms (SNPs), diversity array technology (DArT)
markers, simple sequence repeats (SSRs), amplified
fragment length polymorphisms (AFLPs), and sequencetagged sites (STSs) [3–6]. Linkage maps enable general
scientific discoveries, such as genome organization, QTL
detection, and synteny establishment, whereas high-
© 2016 The Author(s). Open Access This article is distributed under the terms of the Creative Commons Attribution 4.0
International License ( which permits unrestricted use, distribution, and
reproduction in any medium, provided you give appropriate credit to the original author(s) and the source, provide a link to
the Creative Commons license, and indicate if changes were made. The Creative Commons Public Domain Dedication waiver
( applies to the data made available in this article, unless otherwise stated.
Zhou et al. BMC Genetics (2016) 17:130
density maps are a useful tool in crop improvement
programs to identify molecular markers linked to QTLs.
In barley, kernel length (LEN) is a major breeding
target, since it is significantly correlated with grain yield.
In previous studies, multiple QTLs for LEN have been
fine-mapped. Ayoub et al. [7] reported a QTL for LEN
in chromosome (Chr.) 3H; Backes et al. [8] reported two
QTLs for LEN in Chr. 4H and 7H; Walker [9] detected
QTLs for endosperm hardness, grain density, grain size,
and malting quality using rapid phenotyping tools, and
reported that 11 QTLs associated with LEN were significantly correlated with endosperm hardness, but not with
grain density, using digital image analysis. Major QTLs
for LEN have been also identified in rice, soybean [10],
and wheat [11]. In rice, several loci associated with seed
size and grain yield, including GS3 [12], GL7/GW7 [13],
qSW5/GW5 [14], TGW6 [15], An-1 [16], BG2 [17],
OsSIZ1 [18], and DST [19], have been cloned through
map-based cloning techniques. Of these, An-1 encodes a
bHLH protein and regulates awn development, kernel
size, and kernel number [16]; BG2 regulates kernelrelated traits, including kernel thickness, kernel width,
and thousand kernel weight [17]; OsSIZ1 encodes E3
ubiquitin-protein ligases and regulates the vegetative
growth and reproductive development [18]; and DST is a
zinc finger transcription factor that regulates the expression of Gnla/OsCKX2 and improves grain yield [19].
In the present study, a recombinant inbred line (RIL)
population derived from a cross between the barley cultivar Baudin (H. vulgare ssp. vulgare) and its wild relative Awcs276 (H.vulgare ssp. spontaneum) was evaluated
in one location over three years in order to: (a) construct
a high-density genetic linkage map using 1,832 DArT
markers; (b) identify QTLs for LEN; (c) validate major
QTLs for LEN in a second RIL population derived from
a cross between Fleet (H. vulgare ssp. vulgare) and
Awcs276; and (d) identify putative candidate genes that
may influence LEN. Although many loci/QTLs for LEN
have been identified previously in barley using markerassisted selection, the discovery of additional loci/QTLs
is necessary to enhance our understanding of the intricate genetic basis of kernel morphology and phenotype
variance. These findings will provide new insights to
improve barley yield in breeding programs.
Methods
RIL populations and phenotyping
The spring barley cultivars Baudin and Fleet (H. vulgare
ssp. vulgare) along with their wild relative Awcs276 (H.
vulgare ssp. spontaneum) were obtained from a collection assembled at the University of Tasmania and used
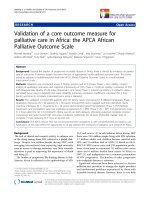
to generate two RIL populations (Fig. 1) as described by
Chen [20]. Awcs276, a long-kernel wild barley genotype
from the Middle East, was used as the common parent
Page 2 of 9
Fig. 1 Kernel phenotypes of Awcs276, Baudin, and Fleet used for
quantitative trait locus mapping in this study. Kernels in the upper
line belong to the long-kernel parent Awcs276, those in the lower
line belong to the short-kernel parent Fleet, and those in the middle
line belong to the short-kernel parent Baudin
in the two RIL populations (Baudin/Awcs276 and Fleet/
Awcs276). Baudin/Awcs276 (mapping population, 128
lines of F8, F9, and F10 generations) was evaluated in one
location over three years to detect QTLs for LEN,
whereas Fleet/Awcs276 (validation population, 94 lines
of F10 generation) was evaluated for one year to validate
putative QTLs identified in the mapping population.
Baudin/Awcs276 was planted in October 2012 (F8), 2013
(F9), and 2014 (F10) in duplicate rows of ten plants each
in a completely randomized design in Wenjiang,
Chengdu, China (30°36′N, 103°41′E). The length of each
row was 1.5 m with a row-to-row distance of 15 cm.
Field management was carried out according to common practices in barley production. Mixed seeds were
collected from mature plants in May 2013, 2014, and
2015, dried, and stored at 25 °C until analysis. Fleet/
Awcs276 was planted in October 2014 and harvested in
May 2015. Fully filled grains were used for measuring
LEN in June 2015. LEN was measured in millimeters
using a ruler and estimated by one measurement of 10
randomly selected kernels in 2013 or the average of
three measurements in 2014 and 2015. The average LEN
of each year was used for QTL analysis.
Phenotypic data analysis
LEN in a given environment was determined as the arithmetic average of three biological replicates. Student’s t-test
(P < 0.05) was used to identify the differences in LEN
between the parental lines. Summary statistics were
performed using Excel 2010 (Microsoft Corp., Redmond,
WA, USA), whereas analysis of variance (ANOVA) in
conjunction with Student’s t-test (P <0.001) using the
general linear model (GLM) in SPSS 17.0 (IBM SPSS,
Chicago, IL, USA). Broad-sense heritability (H2) for each
trait was estimated as H2 = σ2g/(σ2g + σ2ge/n + σ2e/nr), where
σ2g is the genetic variance, σ2ge is the genotype by environment (G × E) variance, σ2e is the error, n is the number
of environments, and r is the number of replicates
[21]. The σ2g , σ2ge, and σ2e values were calculated using
Zhou et al. BMC Genetics (2016) 17:130
ANOVA (P <0.001) in SAS 9.2 (SAS Institute Inc.,
Cary, NC, USA). The best linear unbiased prediction
(BLUP) method was used to estimate the random effects of mixed models. Phenotypic BLUP was calculated using the BLUP procedure in SAS 9.2.
Genotyping and construction of genetic linkage map
Total genomic DNA (gDNA) was isolated and purified
from fresh leaf tissue of one randomly selected plant in
each F8 line of Baudin/Awcs276 and F10 line of Fleet/
Awcs276 using the modified cetyltrimethylammonium
bromide (CTAB) method [22]. DArT sequencing was
conducted by Triticarte Pty Ltd. (Canberra, Australia),
selecting the corresponding predominantly active genes
of a genome fraction through the use of a combination
of restriction enzymes, which separate low copy sequences from the repetitive fraction of the genome
( />DArT sequencing generates two data types: 1) scores for
“presence/absence” (dominant) markers, known as SilicoDArT markers, as they are analogous to microarray DArT
markers, but are extracted in silico from sequences obtained from genomic representations; and 2) SNPs within
the available genomic fragments. DArT loci were named
according to their clone identification numbers as provided by Triticarte ( Polymorphic loci were
selected from a total of 62,216 DArT markers after
discarding those with a minor allele frequency of 0.4, a
missing value of more than 20 %, or a common position.
The linkage map was constructed using IciMapping
3.2/4.0 [23] and JointMap4 [24]. All unanchored markers
were properly grouped using IciMapping 3.2/4.0 with an
LOD threshold of 3. The linkage analysis was conducted
using JoinMap 4 (Kyazma, Wageningen, Netherlands)
with a recombination frequency of 0.25, and all markers
were grouped in the seven chromosomes.
QTL mapping
Phenotypic data of each trait were the means of three biological replications in a single environment. The phenotypic BLUP was used to detect QTLs from the combined
three-year data. QTL analysis for selected environments
was performed through the interval mapping (IM) using
MAPQTL6.0 (Kyazma, Wageningen, Netherlands) [25]. A
test of 1,000 permutations was used to identify the LOD
threshold that corresponds to a genome-wide false discovery rate of 5 % (P < 0.05). QTLs that were stable for a target trait across environments with clearly overlapping
positions on the same chromosome were assumed to be
the same. Stable QTLs that explained more than 10 % of
the phenotypic variance for the specific trait were considered major QTLs [26].
Page 3 of 9
QTLNetwork 2 [27] was used to determine QTLs with
additive effects at individual loci, epistatic interactions
between two different loci, and interactions between
QTLs and the environment (QTL × E). The analysis
was based on a mixed linear model (MLM) with 2 cM
walking speed and 2D genome scan, which maps
epistatic QTLs with or without single-locus effects
using 1,000 permutations in order to generate a threshold for the presence of QTLs and QTL × E interactions.
Marker development and QTL validation
Sequence information was obtained from the IPK Barley
Blast Server ( />index.php), and single-base differences were identified
by high-resolution melt (HRM) analysis [28]. Markers
were designed using Beacon Designer 7.9 and evaluated
by Oligo 6.0 [29]. The parameters for Primer Premier
(Premier Biosoft International, Palo Alto, CA, USA)
were as follows: inner product size of 60–100 bp, melting temperature of 55 ± 5 °C, primer length of 20 ± 3 bp,
and 3ʹ-end stability to avoid self-complementarity and
primer dimer formation.
To detect markers, amplification reactions were performed in a total volume of 10 μl, containing 100 ng of
template DNA, 5 μl of SsoFast EvaGreen mixture, 5
pmol of each forward and reverse primer, and DNase/
RNase-free water up to the final value. PCR conditions
were adjusted according to primer sets as follows: 4 min
at 94 °C, 50 cycles of 1 s at 94 °C, and 30 s at 55 °C. This
process is a precise warming of the amplicon DNA from
approximately 65 °C to 95 °C. At some point during this
process, the melting temperature of the amplicon is
reached, and the two strands of DNA separate or “melt”
apart [28].
The homozygous lines of Fleet/Awcs276 were used
to validate major QTLs using the developed markers.
Based on marker profiles, individuals were grouped
into two classes: genotypes with homozygous alleles
from AwcS276 and genotypes with homozygous alleles from Fleet. Student’s t-test (P < 0.05) was used to
calculate the differences in LEN between these two
classes of alleles and measure QTL effects within the
validation population.
Putative candidate gene identification
To identify putative coding gene regions, flanking candidate
loci, or trait-related gene products, we used the corresponding QTL marker contigs to blast search against the
WGSMorex database at the IPK Barley Blast Server (http://
webblast.ipk-gatersleben.de/barley/index.php). We obtained
QTL positions within the Morex reference map and putative trait-related proteins. According to the putative protein
categories, most genes controlling kernel traits were identified in rice. The sequences of identified genes in rice were
Zhou et al. BMC Genetics (2016) 17:130
used to perform a BLASTN search against the barley database of the National Center for Biotechnology Information
(NCBI, and the Phytozome
website ( in
order to identify homologous candidate genes in barley and
other cereal crops.
Page 4 of 9
Table 1 Basic information regarding the barley genetic map
Chr.
Linkage Marker number Map length (cM) Marker interval (cM)
1H
LG1
188
133.31
0.71
2H
LG2
289
196.24
0.68
LG3
109
65.36
0.60
3H
LG4
187
68.15
0.36
LG5
135
47.90
0.35
Phenotypic evaluation
4H
LG6
165
112.55
0.68
The parental lines Awcs276 and Baudin showed significant
differences in LEN (P <0.05) (Fig. 1, Additional file 1). The
LEN (range, 7.12–7.97 mm; mean, 7.62 mm) of Awcs276
was higher than that of Baudin (range, 6.75–7.68 mm;
mean, 7.28 mm). The trait variance over the three years
and the phenotypic variance among RILs were high as
shown by summary statistics, including range, mean,
standard deviation, and coefficient of variation (Additional
files 1, 2 and 3). The average LEN of 2013 was 8.11 mm
(confidence interval, 8.011–8.192 mm), of 2014 was
7.25 mm (confidence interval, 7.185–7.313 mm), and of
2015 was 7.87 mm (confidence interval, 7.787–7.949 mm).
The frequency of LEN and transgressive segregations were
observed over the three years, indicating the presence of
favorable alleles. The minimum LEN was 6.38 mm and
the maximum 9.4 mm. The broad-sense heritability of
LEN was low in 2013 (h2 = 0.122), owing to the lack of
biological replications, high in 2014 (h2 = 0.937, F = 16.33,
P < 0.0001) and 2015 (h2 = 0.870, F = 7.42, P < 0.0001),
and moderate (h2 = 0.622, F = 11.5, P < 0.0001) over
the three years, suggesting that genetic factors played
an important role in the formation of LEN (Additional
file 2). LEN showed normal or near-normal distribution with quantitative inheritance patterns suitable for
QTL identification (Additional file 4).
5H
LG7
129
66.32
0.51
LG8
87
22.10
0.25
Results
Genetic linkage map construction
A total of 1832 polymorphic markers (Additional file 5)
was selected and mapped on eleven linkage groups
(LGs) (Table 1, Additional file 6). The map spanned a
total of 927.07 cM with an average marker distance of
0.49 cM. The results showed that Chr. 1H contained
LG1 with a length of 133.31 cM, Chr. 2H contained LG2
and LG3 with a length of 261.6 cM, Chr. 3H contained
LG4 and LG5 with a length of 116.05 cM, Chr. 4H contained LG6 with a length of 112.55 cM, Chr. 5H contained LG7 and LG8 with a length of 88.42 cM, Chr. 6H
contained LG9 with a length of 93.21 cM, and Chr. 7H
contained LG10 and LG 11 with a length of 121.92 cM.
The largest LG was LG2, which contained 289 DArT
markers, and the smallest was LG8, which contained
only 87 markers. On average, each LG contained166.5
DArT markers and each Chr. contained 261.7 DArT
markers. The genetic distances of the 11 LGs ranged
from 22.10 cM (LG8) to 196.24 cM (LG2), and the
6H
LG9
230
93.21
0.41
7H
LG10
163
74.77
0.46
150
47.15
0.31
1832
927.07
0.49
LG11
Total
Chr chromosome, LG linkage group, cM centimorgan
average marker distance spanned from 0.25 cM (LG8) to
0.71 cM (LG1) (Table 1). Our genetic map was compared with other consensus maps [5] and the Morex reference map, and the results showed that the marker
order had a satisfactory correspondence across the seven
chromosomes.
QTL analysis and validation
Five significant QTLs were detected for LEN across the
three environments (Table 2). The phenotypic variance
explained by individual QTLs ranged from 10.4 %
(15LEN-2H) to 29.1 % (LEN-3H). We used interval mapping for QTL analysis, and identified QTLs on all the
chromosomes, except for 1H and 5H (Table 2). Two
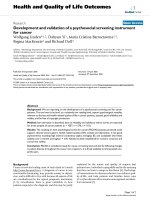
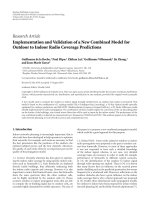
QTLs for LEN, LEN-3H and LEN-4H, were detected in
different environments (Figs. 2 and 3); LEN-3H was
identified in 2013 and 2014 and explained 29.1 and
22.3 % of the phenotypic variance, respectively, whereas
LEN-4H was identified in different environments, having
an LOD score of 3.17–5.06. Except for the two major
QTLs, the rest three were environment-specific. Using
BLUP, we identified four QTLs (15LEN-2H, LEN-3H,
LEN-4H, and 14LEN-6H) from the combined three-year
data, all of which had positions similar to QTLs associated with the non-combined data. However, no QTLs
were detected on 7H from the combined data (Table 2).
Among the five QTLs for LEN, LEN-3H had additive
main effects (a), whereas its interaction with the environment was not significant, showing high heritability
(Table 3), whereas the rest four QTLs did not have additive effects.
Based on the sequences of tightly linked DArT
markers, we BLAST-searched against the Ensembl Barley database at the Ensembl Plants Blast Server (http://
plants.ensembl.org) and found that LEN-3H was located
on Chr. 3HL, whereas LEN-4H on Chr. 4HL. Next, we
Zhou et al. BMC Genetics (2016) 17:130
Page 5 of 9
Table 2 Quantitative trait loci (QTLs) for LEN identified in the Baudin/Awcs276 recombinant inbred line (RIL) population
QTLa
Chr.
Linkage
Environment
Left Marker
Right Marker
Range (cM)
LOD
% Expl.
15LEN-2H
2H
LG3
15WJ
3254852|F|0–65:C > A
6270031|F|0–48:C > G-48:C > G
16.326–17.508
3.11
10.4
Combined
3254852|F|0–65:C > A
6270031|F|0–48:C > G-48:C > G
16.326-17.508
3.35
11.2
13WJ
6255968
3258624|F|0–41:C > A-41:C > A
23.405–25.611
5.07
29.1
14WJ
3931871
3258624|F|0–41:C > A-41:C > A
20.731–25.611
7.12
22.3
Combined
6249147
3258624|F|0–41:C > A-41:C > A
21.375–25.611
6.02
19.2
14WJ
5249122|F|0–25:G > A-25:G > A
3263178|F|0–25:C > A-25:C > A
68.431–69.947
3.17
10.6
15WJ
3910814
5249122|F|0–25:G > A-25:G > A
62.983–68.431
5.06
16.4
Combined
3396110
4007032|F|0–46:C > A-46:C > A
59.535-69.392
5.31
17.2
14WJ
4594605|F|0–25:A > G-25:A > G
3259546|F|0–62:A > T-62:A > T
56.031–59.463
5.47
17.6
Combined
4594605|F|0–25:A > G-25:A > G
3259546|F|0–62:A > T-62:A > T
56.031–59.463
3.92
13
14WJ
3429688|F|0–38:T > C
3256863|F|0–29:G > A-29:G > A
19.095–22.504
5.31
17.2
LEN-3H
LEN-4H
14LEN-6H
14LEN-7H
3H
4H
6H
7H
LG4
LG6
LG9
LG11
Chr chromosome, LG linkage group, cM centimorgan, Combined combined data over the three years of study, % Expl the percentage of variance explained by QTL
a
QTLs were identified by Interval Mapping (IM) using MAPQTL6.0, and a test of 1,000 permutations was used to identify the LOD threshold, corresponding to a
genome-wide false discovery rate of 5 % (P < 0.05)
BLAST-searched the sequences of tightly linked DArT
markers against the Morex reference map database and
converted DArT markers to HRM markers for tracking
QTLs using quantitative real-time PCR. Accordingly,
two primer pairs were designed and used to track LEN3H and LEN-4H (Additional file 7).
In this study, two major QTLs were validated in Fleet/
Awcs276 (Table 4). For LEN-3H, the average LEN of
genotypes with homozygous alleles from Awcs276 was
significantly higher (P < 0.05) than that of genotypes with
homozygous alleles from Fleet. Similarly, for LEN-4H, the
average LEN of genotypes with homozygous alleles from
Awcs276 was significantly higher (P < 0.05) than that of
genotypes with homozygous alleles from Fleet. Detailed
information is presented in Additional files 8 and 9.
Putative candidate genes
For the two major QTLs for LEN in Baudin/Awcs276,
we found several putative candidate genes for kernelrelated traits, and these genes could be divided into four
categories (Table 5): the first category included genes
related to defense response such as salt tolerance; the
second category included genes related to receptors
such as ethylene receptors; the third category included
genes related to transcription factors and promoters
such as basic helix-loop-helix (bHLH) DNA-binding
superfamily proteins and MADS-box transcription
factors; and the fourth category included genes related
to various enzymes such as zinc finger CCCH domaincontaining proteins, E3 ubiquitin-protein ligases, and
cytochrome P450.
Fig. 2 Linkage map of LEN-3H located on chromosome 3H, linkage group 4
Zhou et al. BMC Genetics (2016) 17:130
Page 6 of 9
Fig. 3 Linkage map of LEN-4H located on chromosome 4H, linkage group 6
Discussion
Awcs276 is a long-kernel wild barley genotype that has
been previously used in genetic studies, because of its
relatively long seeds, extensive environmental adaption,
and high genetic diversity that can provide abundant
germplasm resources for genetic variation and crop improvement [20, 30, 31]. Awcs276 was used in the present
study owing to its having genes that are superior for
LEN to those of the Australian barley cultivars Baudin
and Fleet. Therefore, two RIL populations were developed by crossing Awcs276 with Baudin and Fleet to
identify QTLs for LEN. Two major QTLs (LEN-3H and
LEN-4H) were identified from Awcs276 in two environments. LEN-3H was detected in 2013 and 2014 in
the interval of 20.731–25.611 cM on Chr. 3H using
MAPQTL6.0. A peak within this interval was also identified in 2015 with a maximum LOD of 1.19, explaining
4.1 % of the phenotypic variance (Additional file 10). Both
the environmental variation and G × E interaction were
highly significant (P < 0.0001) (Additional file 2). These results showed that the environment influenced the QTLs,
explaining the reason that none QTL was found in all the
experimental years. The effects of LEN-3H and LEN-4H
were evaluated in Fleet/Awcs276, and the results showed
that these two QTLs stably increase LEN in barley.
A QTL for kernel length was identified between 55.8 cM
and 84.3 cM on Chr. 3H in a previous study [7]. Furthermore, five markers (ABG462, PSR156a, ABG453, ABG499,
and M351316) were found within this interval, and information on the marker ABG453 was obtained from
GrainGenes ( Therefore,
we used the parental lines and some extreme phenotypes
in their progenies to confirm ABG453, and found that it
was polymorphic for the parental lines. Backes et al. [8] reported a QTL for kernel length on Chr. 4H in an interval
of 12 cM and identified four markers (MWG2033,
MWG0857, MWG0611, and MWG0921) within it. In the
present study, we found the nearby loci of MWG2033 in
the Hv-Consensus2006-Marcel-4H from GrainGenes and
used the parental lines to confirm the nearby markers. The
marker HVM40 was polymorphic for the parental lines
with a distance of 4.1 cM from MWG2033 in the consensus map. Thus, ABG453 and HVM40 were used for
genotyping the lines of Baudin/Awcs276 (Additional
file 11). Next, we used these two markers along with
DArT markers to construct a genetic map and found
that ABG453 (69.142 cM) and HVM40 (95.841 cM)
were mapped on LG4 and LG6, respectively (Additional
file 12). Using BLUP, we identified LEN-3H and LEN-4H in
the interval of 20.428–25.917 cM and 59.02–69.119 cM,
Table 3 Estimated additive and additive × environmental interactions of QTLs for kernel length (LEN) in barley
QTL name
LEN-3H
Flanking
interval
LOD
23.4–25.6
7.12
a effecta
−0.1599*
ae1
NS
ae2
NS
ae3
NS
QTL heritability
h2 (a)
h2 (ae)
h2 (ae1)
h2 (ae2)
h2 (ae3)
0.1217
0.0139
0.0056
0.0027
0.0129
ae1, ae2, and ae3, QTL × environment interaction effect in 2013, 2014, and 2015, respectively
NS non-significant, *, significant at P < 0.001
a
The analysis was based on a mixed linear model (MLM) with 1,000 permutations
The mixed linear model (MLM) was used to calculate the estimated additive (a) and additive × environment interactions (ae)
Zhou et al. BMC Genetics (2016) 17:130
Page 7 of 9
Table 4 Validation of two quantitative trait loci (QTLs) in the
Fleet/Awcs276 recombinant inbred line (RIL) population
P valuea
QTL
Chr.
AA
BB
LEN-3H
3H
8.79
9.05
0.01**
LEN-4H
4H
8.83
9.03
0.03*
AA homozygous alleles from Fleet, BB homozygous alleles from Awcs276,
Chr chromosome
a
Student’s t-test (P < 0.05) was used to identify differences between the
parental lines; **, significant at P < 0.01; *, significant at P < 0.05
respectively. ABG453 (69.142 cM) and HVM40
(95.841 cM) were not included in the QTL interval, thus
we speculated that the QTLs detected by Ayoub et al. [7]
and Backes et al. [8] were not the same as LEN-3H and
LEN-4H. In general, the two QTLs for kernel size that were
identified in this study were within a relatively small
interval, which makes them an ideal target for breeding
programs as well as for the characterization of gene(s)
underlying this locus.
Kernel size is a major determinant of grain weight and
an important yield component [32]. It refers to the space
bounded by the husks, measured by LEN and width, and
serves as a component of grain yield that determines
kernel weight [33]. LEN was an important trait for barley
domestication and has been a major target in barley
breeding, because of its direct influence on grain yield. In
the present study, according to four categories of putative
proteins that influence LEN and several homologous
candidate genes in Zea mays, Arabidopsis thaliana,
Brachypodium distachyon, Panicum hallii, and Sorghum
bicolor, we identified four putative candidate genes (NCBI
accession no. AK361814.1, AK365156.1, AK366345.1, and
AK374135.1) (Table 5). The putative candidate gene
(NCBI accession no. AK361814.1) for LEN-4H was homologous to An-1 in rice. And An-1 encodes a bHLH protein that positively regulates cell division, grain length, and
awn elongation, but negatively regulates the grain number
per panicle in rice [16]. The other three putative candidate
genes (NCBI accession no. AK365156.1, AK366345.1,
and AK374135.1) for LEN-3H were homologous to
DST, OsSIZ1, and BG2, respectively (Table 5). DST is a
zinc finger transcription factor that improves grain
yield and regulates the expression of Gnla/OsCKX2
[19]. Li et al. [34] reported that DSTreg1 enhances panicle branching and increases the grain number. And
OsSIZ1 encodes E3 ubiquitin-protein ligases that regulate the growth and development in rice [18]. Wang
et al. [35] reported that ossiz1 mutants have shorter primary and adventitious roots than wild-type plants, suggesting that OsSIZ1 is associated with the regulation of
root architecture and acts as a regulator of the Pi (N)dependent responses in rice. BG2 encodes OsCYP78A13,
which has a paralog in rice (Grain Length 3.2; GL3.2,
LOC_Os03g30420) with distinct expression patterns [17].
CYP78A13 is highly expressed in seeds at 5–8 day after
planting, whereas GL3.2 is specifically expressed in the
roots [17]. Analysis of transgenic plants harboring either
CYP78A13 or GL3.2 revealed that both genes can promote
Table 5 Putative genes or proteins of major quantitative loci (QTLs) for kernel length in barley
Stable
QTLs
Chr. Putative candidate
genes
LEN-3H 3H
Zinc finger CCCH
domain-containing
protein
Gene in
rice
Putative
genes in
barley
DST
AK365156.1 GRMZM2G089448 AT4G33660
Bradi1g06420
Pahal.I01451
AK366345.1 GRMZM2G155123 AT5G60410
Bradi2g38030
Pahal.C01170 Sobic.009G026500
GE; CYP78A13; AK374135.1 GRMZM2G138008 AT1G74110
BG2
Bradi4g35890
Pahal.B03875 Sobic.002G367600
Bradi5g06620
Pahal.G01160 Sobic.001G105000
E3 ubiquitin-protein
OsSIZ1
ligase BRE1-like protein
Cytochrome P450
Zea mays
Arabidopsis Brachypodium Panicum
thaliana
distachyon
hallii
Sorghum bicolor
Sobic.001G065500
Polyglutamine-binding protein 1
Ankyrin-repeat protein
FeS assembly protein
Calcium-dependent protein kinase
LEN-4H 4H
Basic helix-loop-helix
(bHLH) DNA-binding
Superfamily protein
An-1
AK361814.1 GRMZM5G828396 AT4G36540
Salt tolerant-related protein
LEA hydroxyproline-rich glycoprotein family
Seed maturation protein PM41
MADS-box transcription factor 1
Ethylene receptor
Chr chromosome
Zhou et al. BMC Genetics (2016) 17:130
Page 8 of 9
grain growth by positively affecting LEN, kernel thickness,
kernel width, and thousand kernel weight [17]. Overall, all
the four genes control seed length or grain yield in rice,
and the corresponding proteins are the putative candidate
proteins of LEN-3H and LEN-4H. Hence, the two major
QTLs, LEN-3H and LEN-4H, and the four putative candidate genes might play crucial and dynamic roles in the
control of LEN in barley and other grain crops.
Acknowledgements
Not applicable.
Conclusion
In this study, we identified two major QTLs for LEN
(LEN-3H and LEN-4H) derived from Baudin/Awcs276
and validated in Fleet/Awcs276. Additionally, four putative candidate genes that might control LEN and four
categories of putative proteins that might have a phenotypic effect were identified for the two major QTLs. The
QTLs and putative candidate genes identified in this
study provide important information for barley genetic
studies and breeding programs.
Authors’ contributions
HZ conducted data analysis and drafted the manuscript. SL helped to construct
the research populations and performed the phenotypic evaluation. YL performed
the phenotypic evaluation and helped to analyze the data. YL designed and
coordinated this study and revised the manuscript. JY, MD, and GC participated in
the construction of RIL population and phenotypic evaluation. JM developed
the markers. YW participated in the design of the study. CL helped to draft the
manuscript. YZ coordinated the study and helped to draft the manuscript.
All authors have read and approved the final manuscript.
Additional files
Additional file 1: Phenotypic performance of barley kernel length of
Baudin/Awcs276 recombinant inbred lines (RILs) population. (XLSX 11 kb)
Additional file 2: Analysis of variance (ANOVA) for kernel length of the
Baudin/Awcs276 recombinant inbred line (RILs) population over the three
years. (XLSX 10 kb)
Additional file 3: Average kernel length of the Baudin/Awcs276
recombinant inbred line (RILs) population. (XLSX 14 kb)
Additional file 4: Frequency distributions of kernel length in the
Baudin/Awcs276 recombinant inbred line (RILs) population over the three
years. (XLSX 26 kb)
Additional file 5: Genotyping information of the Baudin/Awcs276
recombinant inbred line (RILs) population. (XLSX 1007 kb)
Additional file 6: Linkage maps constructed using the Baudin/Awcs276
recombinant inbred line (RILs) population. (XLSX 60 kb)
Additional file 7: Information for high-resolution melt (HRM) markers
developed based on the linkage genome-wide diversity array technology
(DArT) markers. (XLSX 10 kb)
Additional file 8: Average kernel length of the Fleet/Awcs276
recombinant inbred line (RILs) population. (XLSX 11 kb)
Additional file 9: Genotyping information of the Fleet/Awcs276
recombinant inbred line (RILs) population. (XLSX 12 kb)
Additional file 10: Information regarding the peak marker within the
interval of LEN-3H detected in 2015.. (XLSX 14 kb)
Additional file 11: Genotyping of the Baudin/Awcs276 recombinant
inbred line (RILs) population using the markers ABG453 and HVM40.
(XLSX 12 kb)
Additional file 12: Mapping positions of the markers ABG453 and
HVM40 on linkage group (LG) 4 and LG6. (XLSX 20 kb)
Abbreviations
ANOVA: Analysis of variance; BLUP: Best linear unbiased prediction;
Chr: Chromosome; cM: Centimorgan; DArT: Genome-wide diversity array
technology; HRM: High-resolution melt; IM: Interval mapping; LEN: 10-Kernel
length; LG: Linkage group; MLM: Mixed linear model; QTL: Quantitative trait
locus; RIL: Recombinant inbred line; SNP: Single nucleotide polymorphism;
SSR: Single sequence repeat
Funding
This study was supported by the International Science and Technology
Cooperation Program of China (No. 2015DFA30600) and the National
Natural Science Foundation of China (31301317& 31560388).
Availability of data and materials
All data generated or analyzed during this study are included in this
published article and its supplementary information files.
Competing interests
The authors declare that they have no competing interests.
Consent for publication
Not applicable.
Ethics approval and consent to participate
Not applicable.
Author details
1
Triticeae Research Institute, Sichuan Agricultural University, Wenjiang,
Chengdu 611130, China. 2CSIRO Agriculture Flagship, 306 Carmody Road, St.
Lucia, QLD 4067, Australia.
Received: 8 January 2016 Accepted: 6 September 2016
References
1. Moore G, Devos KM, Wang Z, et al. Cereal genome evolution: grasses, line
up and form a circle. Curr Biol. 1995;5(7):737–9.
2. Graner A, Jahoor A, Schondelmaier J, et al. Construction of an RFLP map of
barley. Theor Appl Genet. 1991;83(2):250–6.
3. Wenzl P, Carling J, Kudrna D, et al. Diversity Arrays Technology (DArT) for
whole-genome profiling of barley. Proc Natl Acad Sci U S A. 2004;101(26):
9915–20.
4. Xue DW, Zhou MX, Zhang XQ, et al. Identification of QTLs for yield and
yield components of barley under different growth conditions. J Zhejiang
Univ Sci B. 2010;11(3):169–76.
5. Arifuzzaman M, Sayed MA, Muzammil S, et al. Detection and validation of
novel QTL for shoot and root traits in barley (Hordeum vulgare L.). Mol
Breedi. 2014;34(3):1373–87.
6. Wang J, Yang J, Jia Q, et al. A new QTL for plant height in barley
(Hordeum vulgare L.) showing no negative effects on grain yield. PLoS
One. 2014;9(2):e90144.
7. Ayoub M, Symons S, Edney M, et al. QTLs affecting kernel size and shape in
a two-rowed by six-rowed barley cross. Theor Appl Genet. 2002;105(2–3):
237–47.
8. Backes G, Graner A, Foroughi-Wehr B, et al. Localization of quantitative trait
loci (QTL) for agronomic important characters by the use of a RFLP map in
barley (Hordeum vulgare L.). Theor Appl Genet. 1995;90(2):294–302.
9. Walker CK, Ford R, Moz-Amatrin M, et al. The detection of QTLs in
barley associated with endosperm hardness, grain density, grain size and
malting quality using rapid phenotyping tools. Theor Appl Genet. 2013;
126(10):2533–51.
10. Han Y, Li D, Zhu D, et al. QTL analysis of soybean seed weight across multigenetic backgrounds and environments. Theor Appl Genet. 2012;125(4):
671–83.
11. Wei L, Bai S, Li J, et al. QTL positioning of thousand wheat grain weight in
Qaidam Basin. Open J Genet. 2014;4:239–44.
Zhou et al. BMC Genetics (2016) 17:130
12. Fan C, Xing Y, Mao H, et al. GS3, a major QTL for grain length and weight
and minor QTL for grain width and thickness in rice, encodes a putative
transmembrane protein. Theor Appl Genet. 2006;112(6):1164–71.
13. Wang Y, Xiong G, Hu J, et al. Copy number variation at the GL7 locus
contributes to grain size diversity in rice. Nat Genet. 2015;47(8):944–8.
14. Weng J, Gu S, Wan X, et al. Isolation and initial characterization of GW5,
a major QTL associated with rice grain width and weight. Cell Res.
2008;18(12):1199–209.
15. Ishimaru K, Hirotsu N, Madoka Y, et al. Loss of function of the IAA-glucose
hydrolase gene TGW6 enhances rice grain weight and increases yield.
Nat Genet. 2013;45(6):707–11.
16. Luo J, Liu H, Zhou T, et al. An-1 encodes a basic helix-loop-helix protein that
regulates awn development, grain size, and grain number in rice. Plant Cell.
2013;25(9):3360–76.
17. Xu F, Fang J, Ou S, et al. Variations in CYP78A13 coding region influence
grain size and yield in rice. Plant Cell Environ. 2015;38(4):800–11.
18. Wang H, Makeen K, Yan Y, et al. OsSIZ1 regulates the vegetative growth
and reproductive development in rice. Plant Mol Biol Report. 2011;29(2):
411–7.
19. Huang XY, Chao DY, Gao JP, et al. A previously unknown zinc finger protein,
DST, regulates drought and salt tolerance in rice via stomatal aperture
control. Genes Dev. 2009;23(15):1805–17.
20. Chen G, Liu Y, Ma J, Zheng Z, Wei Y, et al. A novel and major quantitative
trait locus for fusarium crown Rot resistance in a genotype of wild barley
(hordeum spontaneum L.). PLoS One. 2013;8(3):e58040. doi:10.1371/journal.
pone.0058040.
21. Smith SE, Kuehl RO, Ray IM, et al. Evaluation of simple methods for
estimating broad-sense heritability in stands of randomly planted
genotypes. Crop Sci. 1998;38(5):1125–9.
22. Allen GC, Flores-Vergara MA, Krasynanski S, et al. A modified protocol for
rapid DNA isolation from plant tissues using cetyltrimethylammonium
bromide. Nat Protoc. 2006;1(5):2320–5.
23. Meng L, Li H, Zhang L, et al. QTL IciMapping: Integrated software for
genetic linkage map construction and quantitative trait locus mapping in
biparental populations. Crop J. 2015;3(3):269–83.
24. Van Ooijen JW. Accuracy of mapping quantitative trait loci in autogamous
species. Theor Appl Genet. 1992;84(7–8):803–11.
25. Van Ooijen JW. MapQTL version 6.0, Software for the mapping of
quantitative trait loci in experimental populations of diploid species.
Kyazma B. V., Wageningen, Netherlands. 2009.
26. Liu Y, Wang L, Sun C, et al. Genetic analysis and major QTL detection for
maize kernel size and weight in multi-environments. Theor Appl Genet.
2014;127(5):1019–37.
27. Yang J, Hu CC, Hu H, et al. QTLNetwork: mapping and visualizing genetic
architecture of complex traits in experimental populations. Bioinformatics.
2008;24(5):721–3.
28. Han Y, Khu DM, Monteros MJ. High-resolution melting analysis for SNP
genotyping and mapping in tetraploid alfalfa (Medicago sativa L.).
Mol Breed. 2012;29(2):489–501.
29. Zhang XY, Gao YN. To design PCR primers with Oligo 6 and primer premier 5.
China J Bioinform. 2004;2:14–8.
30. Nevo E, Chen GX. Drought and salt tolerances in wild relatives for wheat
and barleyimprovement. Plant Cell Environ. 2010;33:670–85.
31. Wu D, Cai S, Chen M, Ye L, Chen Z, Zhang H, Dai F, Wu F, Zhang G.
Tissuemetabolic responses to salt stress in wild and cultivated barley.
PLoS One. 2013;8(1):e55431. 10.137 l/journal.pone.0055431.
32. Doebley JF, Gaut BS, Smith BD. The molecular genetics of crop
domestication. Cell. 2006;127(7):1309–21.
33. Xing Y, Zhang Q. Genetic and molecular bases of rice yield. Annu Rev Plant Biol.
2010;61:421–42.
34. Li S, Zhao B, Yuan D, et al. Rice zinc finger protein DST enhances grain
production through controlling Gn1a/OsCKX2 expression. Proc Natl Acad Sci
U S A. 2013;110(8):3167–72.
35. Wang H, Sun R, Cao Y, et al. OsSIZ1, a SUMO E3 ligase gene, is involved
in the regulation of the responses to phosphate and nitrogen in rice.
Plant and Cell Physiology. 2015;56(12):2381–95.
Page 9 of 9
Submit your next manuscript to BioMed Central
and we will help you at every step:
• We accept pre-submission inquiries
• Our selector tool helps you to find the most relevant journal
• We provide round the clock customer support
• Convenient online submission
• Thorough peer review
• Inclusion in PubMed and all major indexing services
• Maximum visibility for your research
Submit your manuscript at
www.biomedcentral.com/submit