Genetic structure of wild boar (Sus scrofa) populations from East Asia based on microsatellite loci analyses
Bạn đang xem bản rút gọn của tài liệu. Xem và tải ngay bản đầy đủ của tài liệu tại đây (901.67 KB, 10 trang )
Choi et al. BMC Genetics 2014, 15:85
/>
RESEARCH ARTICLE
Open Access
Genetic structure of wild boar (Sus scrofa)
populations from East Asia based on
microsatellite loci analyses
Sung Kyoung Choi1, Ji-Eun Lee1, Young-Jun Kim2, Mi-Sook Min1, Inna Voloshina3, Alexander Myslenkov3,
Jang Geun Oh4, Tae-Hun Kim5, Nickolay Markov6, Ivan Seryodkin7, Naotaka Ishiguro8, Li Yu9, Ya-Ping Zhang10,
Hang Lee1* and Kyung Seok Kim1,11*
Abstract
Background: Wild boar, Sus scrofa, is an extant wild ancestor of the domestic pig as an agro-economically important
mammal. Wild boar has a worldwide distribution with its geographic origin in Southeast Asia, but genetic diversity and
genetic structure of wild boar in East Asia are poorly understood. To characterize the pattern and amount of genetic
variation and population structure of wild boar in East Asia, we genotyped and analyzed microsatellite loci for a total of
238 wild boar specimens from ten locations across six countries in East and Southeast Asia.
Results: Our data indicated that wild boar populations in East Asia are genetically diverse and structured, showing a
significant correlation of genetic distance with geographic distance and implying a low level of gene flow at a regional
scale. Bayesian-based clustering analysis was indicative of seven inferred genetic clusters in which wild boars in East Asia
are geographically structured. The level of genetic diversity was relatively high in wild boars from Southeast Asia,
compared with those from Northeast Asia. This gradient pattern of genetic diversity is consistent with an assumed
ancestral population of wild boar in Southeast Asia. Genetic evidences from a relationship tree and structure analysis
suggest that wild boar in Jeju Island, South Korea have a distinct genetic background from those in mainland Korea.
Conclusions: Our results reveal a diverse pattern of genetic diversity and the existence of genetic differentiation
among wild boar populations inhabiting East Asia. This study highlights the potential contribution of genetic variation
of wild boar to the high genetic diversity of local domestic pigs during domestication in East Asia.
Keywords: Microsatellites, East Asia, Genetic diversity, Genetic structure, Wild boar
Background
Wild boar, Sus scrofa, is one of the most widely distributed
mammalian species, native throughout Europe, North
Africa, and much of Asia as far south as Indonesia. Wild
boar populations have also been artificially introduced in
some areas of the world including the Americas and
Australasia, principally for hunting, or through escapes
from captivity. Sus scrofa is the most common wild ancestor of the domestic pig, with which it freely hybridizes [1].
The Family Suidae includes many species of pigs, hogs
* Correspondence: ;
1
College of Veterinary Medicine, Seoul National University, Seoul, Republic of Korea
11
Department of Ecology, Evolution, and Organismal Biology, Iowa State
University, Ames, IA, USA
Full list of author information is available at the end of the article
and boars which served as one of the main food resources
for humans during the extended history of human settlement. Their economic value increased as they were domesticated, reared, crossed, translocated, hunted, eaten,
and in certain cases, venerated or persecuted for cultural
or ritual purpose [2].
Since wild boar is a co-existing wild ancestor of domesticated pig, the patterns and origins of pig domestication
worldwide are of increasing interest, not only in economic
contexts, but also academically. Previous phylogenetic studies based on the mtDNA D-loop sequence revealed that
continental wild boars and domestic pigs are clearly divided
into eastern and western clades [3-5]. These studies suggested that pig domestications occurred independently in
multiple centers of Eurasia, implying that European and
© 2014 Choi et al.; licensee BioMed Central Ltd. This is an Open Access article distributed under the terms of the Creative
Commons Attribution License ( which permits unrestricted use, distribution, and
reproduction in any medium, provided the original work is properly credited. The Creative Commons Public Domain
Dedication waiver ( applies to the data made available in this article,
unless otherwise stated.
Choi et al. BMC Genetics 2014, 15:85
/>
Asian domestic populations derived from their respective
regional areas. Molecular genetic evidence for the origin of
wild and domestic pigs from Asia and Europe supports the
historical record that Asian pigs were subsequently interbred with European breeds during the 18th and 19th centuries after independent domestication [6]. A recent study
based on single nucleotide polymorphism (SNP) genotyping revealed that populations of wild boars from Europe
and Near Eastern Asia are genetically differentiated, supporting previous mitochondrial studies [7].
It has been well known that the cosmopolitan wild boar
originated and spread from Islands of Southeast Asia [3].
Knowledge of genetic diversity of wild boar in East Asia,
therefore, is important for reconstructing the evolutionary
history of the species as well as understanding the domestication process of local domestic pigs. Most genetic studies on wild boars in East Asia have been carried out using
mtDNA sequence analysis, which did not expose geographic structure, although they revealed several subclades
[4,8-10]. One recent study based on both mtDNA and nuclear genes demonstrated that no population substructure
exists in either wild boars or domestic pigs in East Asia
and showed a very high level of admixture between them
[11]. Korean wild boars clearly clustered with Asian wild
boar groups, sharing the same cluster with populations
from Myanmar and Thailand [9], and the Vietnamese wild
pig haplotype [8]. On the other hand, Larson et al. [12]
ascertained that wild boars in South Korea belong to
groups unique within East Asia, and remain differentiated
from domestic pigs. Thus, genetic research has been conducted on domesticated pigs and wild boars in East Asia
over several decades, but the patterns of genetic diversity
and genetic structure of populations at a regional scale in
East Asia remains unclear.
In this study, we aimed to characterize genetic relationships and genetic structure of wild boars from East
Asia by examining genetic variation at microsatellite loci
for a total of 238 wild boar individuals from six countries. Our results shed light on the genetic relationships
among populations and help define population boundaries of wild boar in East Asia.
Results
Genetic characteristics and genetic diversity of wild boars
in East Asia
In total, 273 alleles were observed across the 16 microsatellite loci. The number of alleles per locus ranged from
ten for locus Sw72 to 33 for locus S0005, with a mean of
17.1. A total of 75 of 273 alleles were unique to single
sample locations in this study. The proportion of most private alleles at a location was low, with a frequency of less
than 5%, but eight of the 75 private alleles were present at
a frequency over 15%: Japan (one allele of 15.6%), Yunnan,
China (one allele of 20.0%), Vietnam (two alleles of 19.2%
Page 2 of 10
each), and Indonesia (four alleles of 14.6%, 29.2%, 45.8%,
and 66.7%, respectively). The highest number of alleles
(154 alleles) was found in wild boars from Indonesia, of
which 33 were private alleles. Inbreeding coefficients, FIS,
ranged from 0.017 to 0.279 with a mean of 0.091. Most of
the populations except for two sample locations, Japan
and Vietnam, showed non-significant FIS values, implying
no signature of significant inbreeding (Table 1).
Levels of genetic diversity for regional samples of 238
wild boars from East Asia are shown in Table 1. The mean
number of alleles across loci ranged from 3.4 (Jeolla-do,
Korea) to 9.6 (Indonesia). Four diversity measures revealed
a consistently high level of genetic diversity in wild boars
from southeastern China (Yunnan province), Vietnam,
and Indonesia (≥ 0.796 in HE and ≥ 7.3 in allelic richness),
followed by the Russian Far East (Primorsky Krai) and
mainland Korea (except Jeolla-do). The lowest level of genetic diversity was found in the samples from Jeolla-do,
Korea (HE = 0.506; Ad = 3.4; Ar = 3.4), and Jeju Island (HE =
0.549; Ad = 4.0; Ar = 3.1) (Table 1).
Genetic relationships and gene flow among populations
Between population genetic differences, as indicated by
pairwise FST estimates and the estimated number of migrants per generation (Nm), are presented in Table 2 for
each pair of wild boar populations. Pairwise FST values
ranged from 0.020 (Gyeonggi-do vs. Gangwon-do, Korea)
to 0.314 (Jeolla-do vs. Jeju Island, Korea). Gene flow estimates (Nm) derived from FST ranged from 0.546 to
12.250. All wild boar population pairs were significantly
differentiated from one another except population pairs
from the north-central region of Korea. The wild boar
population on Jeju Island showed the highest degree of
genetic differentiation from other populations (mean
FST = 0.253). The lowest mean FST value was found in
southeastern Korea (Gyeongsang-do) vs. other populations (mean FST = 0.123).
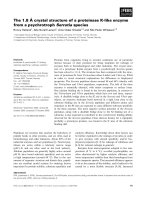
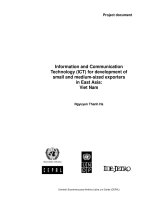
The NJ tree based on Nei’s DA genetic distance
showed wild boars from Vietnam and Indonesia grouped
together, forming a basal cluster to all other populations
(Figure 1A). Among Korean wild boars, mainland populations grouped with, and were closely related to, wild boars
from the Russian Far East (Primorsky Krai), whereas wild
boars from Japan and Jeju Island were basal to Northeast
Asian clades. Wild boar populations from Southeast Asia
formed distinct clades from those of Northeast Asian
populations.
In a Principal Coordinates Analysis (PCA), the first two
components, PC 1 and PC 2 (x- and y- axes, respectively),
accounted for 35.52% and 22.63% of the total variance
(Figure 1B). PC 1 revealed the genetic difference between
wild boars by geographical isolation. “Northern” regions
(mainland South Korea and Russian Far East) and “southern”
regions (southeastern China, Vietnam and Indonesia)
Choi et al. BMC Genetics 2014, 15:85
/>
Page 3 of 10
Table 1 Genetic diversity estimates for wild boars from East Asia
Location (Abbr.)
N
Allelic diversity (Ad)
Allelic richness (Ar)
HE
HO
FIS
Gyeonggi-do (KGGW)
17
4.8
4.3
0.614
0.563
0.086NS
Gangwon-do (KGWW)
53
5.8
4.6
0.661
0.647
0.022NS
Gyeongsang-do (KGSW)
26
6.1
5.1
0.705
0.673
0.046NS
Jeolla-do (KJLW)
12
3.4
3.4
0.506
0.422
0.172NS
Jeju Island (KJIW)
37
4.0
3.1
0.549
0.539
0.019NS
Russia Primorsky (RUPW)
30
7.6
5.9
0.736
0.710
0.036NS
Japan (JPNW)
16
6.2
5.2
0.650
0.473
0.279*
China Yunnan (CYNW)
10
8.0
8.0
0.845
0.831
0.017NS
Vietnam (VIEW)
13
9.1
8.3
0.859
0.836
0.028NS
Indonesia (INDW)
24
9.6
7.3
0.796
0.658
0.177*
South Korea
N: Number of samples; Ad: Mean number of alleles; HO: Observed heterozygosity; HE: Expected heterozygosity; FIS: Inbreeding coefficients; *Significant, NSNot significant,
after adjusted nominal level (5%): 0.00031; Ar: The number of genes obtained from Yunnan, China, the smallest sample size in this study, was employed.
formed separate groups, with Japanese wild boars intermediate between them. The discrete position of wild boars
from Jeju Island along PC 2 reflects its high genetic differentiation from all other wild boar populations.
Pairwise FST data, the genetic relationship tree and the
PCA scattergram indicate that Jeju Island wild boars are
quite distinct from wild boars in mainland Korea. Interestingly, despite the genetically distinct population structure
of wild boars from Jeju Island, one of the 37 individuals
we sampled belonged genetically to a population from the
Korean mainland (Figures 2 and 3). In addition, some wild
boars on Jeju Island shared genetic profiles similar to wild
boars from Yunnan province (Figure 3) and the pairwise
FST value was relatively low.
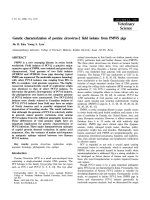
Genetic structure of East Asian wild boars
Samples from ten geographic locations were tested to
determine the potential number of populations (K) they
represent. Model-based clustering analysis revealed that
wild boars in Eastern Asia had the highest ΔK when K was
set to 3, assuming three inferred populations: 1. mainland
Korea (KGGW, KGWW, KGSW, KJLW); 2. Jeju Island
(KJIW); and 3. Southeast Asia (CYNW, VIEW, INDW)
(Figure 3 & Additional file 1: Figure S1). In this scenario,
wild boars from Primorsky Krai, Russia and Japan showed
genetic compositions intermediate between mainland
Korea and Southeast Asian populations. Wild boars from
Primorsky Krai, Russia and Japan clustered together when
K = 4. When K was set to 5, the Japanese wild boar population grouped with Yunnan province, China and Vietnam.
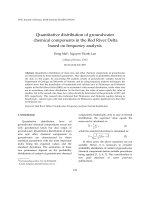
The Indonesian population was isolated, albeit 9 of 24 individuals shared genetic composition with those populations. In the case of K = 6, most wild boars from Japan
formed a unique genetic composition. Finally, when K was
set to 7, the wild boars of mainland Korea were divided
into two main substructures, a north-central region
Table 2 Genetic distances and gene flow estimates among wild boars from East Asia
KGGW
KGGW
KGWW
KGWW
KGSW
KJLW
KJIW
RUPW
JPNW
CYNW
VIEW
INDW
12.250
3.718
1.384
0.669
1.887
1.094
1.221
1.066
0.750
6.507
2.275
0.770
2.225
1.179
1.428
1.131
0.814
0.020NS
*
*
KGSW
0.063
0.037
KJLW
0.153*
0.099*
0.094*
KJIW
0.272*
0.245*
0.216*
0.314*
*
*
*
0.165*
0.245*
*
*
*
RUPW
0.117
*
0.101
*
2.410
0.105
0.907
2.131
1.342
2.177
1.511
1.073
0.546
1.265
0.679
0.902
0.809
0.633
0.770
0.640
1.170
0.734
0.673
1.170
2.154
1.575
1.179
1.373
1.274
1.013
4.136
2.275
*
JPNW
0.186
0.175
0.157
0.269
0.281
0.176
CYNW
0.170*
0.149*
0.103*
0.217*
0.176*
0.104*
0.154*
*
*
*
*
*
*
*
*
VIEW
0.190
0.181
0.142
0.236
0.254
0.137
0.164
0.057
INDW
0.250*
0.235*
0.189*
0.283*
0.271*
0.175*
0.198*
0.099*
2.044
0.109*
Pairwise FST (below diagonal) and gene flow (Nm) estimates (above diagonal) among geographic populations of wild boars in East Asia (see Table 1 for
location abbreviations).
*
Significant after Bonferroni correction (P < 0.05); NSNot significant; Indirect indicator of gene flow (Nm) was calculated among geographic populations using the
equation, Nm =1/4{(1- FST)/FST}.
Choi et al. BMC Genetics 2014, 15:85
/>
Page 4 of 10
Figure 1 Genetic relationships among wild boars in East Asia. A. NJ tree based on Nei’s DA distance with bootstrap values from 1,000
replications. B. Principal Coordinates Analysis (PCA) based on pairwise FST’s (see Table 1 for location abbreviations).
(KGGW and KGWW) and southern region (KGSW and
KJLW), although they displayed a genetically admixed
pattern (Figure 3).
When a hierarchical island model [13] was applied to
verify possible substructure in each cluster, results corresponded to genetic clustering obtained when K was set to
7. Therefore, a total of seven genetically substructured
groups of populations were found in wild boars in East
Asia (Figure 3). Most wild boars from Jeju Island (KJIW),
Primorsky Krai (RUPW), Japan (JPNW) and Indonesia
(INDW), showed discrete genetic composition in the
structure analysis, with genetic traits of the first two populations shared among a few individuals of Yunnan province, China (CYNW) (Figure 3). With one exception, wild
boar individuals from Jeju Island had a conspicuously different genetic composition with respect to populations
from mainland Korea. Although wild boars from mainland
Korea were genetically admixed, the genetic composition
showed a gradual geographic gradient from north to south
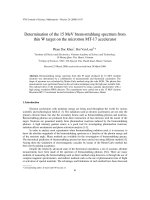
(Figure 2). The structure analysis revealed that the prevalent
(96%) cluster in the wild boar population on Jeju Island was
more abundant (13%) in wild boars from Yunnan province
than in wild boars from mainland Korea (<2%) (Figure 2).
AMOVA analysis was carried out to ascertain hierarchical patterns of genetic variation for three regions
distinguished on the basis of geographical distance,
pairwise FST and population structure (Table 3). 9.5% of
genetic variance was accounted for among the three regions (FRT = 0.095) and 11.4% among populations
within region (FSR = 0.114), to explain the proportion of
genetic variance among populations to the total (FST =
0.198) (Table 3).
Choi et al. BMC Genetics 2014, 15:85
/>
Page 5 of 10
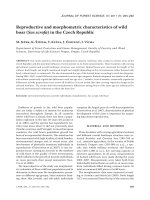
Figure 2 Geographical locations of wild boar samples in East Asia (left) and South Korea (right). Pie charts indicate proportions of membership
of each sampled population to seven clusters inferred by structure analysis (K = 7) (see text for details). See Table 1 for location abbreviations.
The isolation by distance test revealed that genetic distance was not significantly correlated to the geographic
distance for total populations (R2 = 0.078; P = 0.140).
However, when the Jeju Island population was excluded,
a significant regression was detected (R2 = 0.391; P =
0.002) (Additional file 1: Figure S2).
Discussion
Levels of genetic diversity and the structuring of geographic populations provide important clues to local
adaptation and species evolution. Such information can
further be employed to understand the effect of genetic
variation of regional wild boars on pig domestication in
East Asia and to facilitate conservation and management
of this species at a regional scale. In this study, wild boar
populations from East Asia showed various levels of genetic diversity, as well as a distinct genetic structure, related to geographic distribution.
Genetic diversity and population structure of wild boar in
East Asia
The pattern and magnitude of allelic diversity vary with
the geographic distribution of wild boars in East Asia.
Wild boars from southeastern regions, represented by
Yunnan province of China, Vietnam and Indonesia, exhibited generally high levels of genetic diversity with large
numbers of alleles. In contrast, relatively low levels of genetic diversity were found in wild boars from Northeast
Asia, except Primorsky Krai, Russia which has an intermediate level of allelic diversity.
The high level of genetic diversity and large numbers of
alleles in wild boars from Southeast Asia are expected
given the historical geographic range of S. scrofa. Previous
studies [3,12,14] revealed that S. scrofa originated from
Islands of Southeast Asia, i.e. an “ISEA” origin of wild
boar. Although various factors such as climatic fluctuations and human-mediated translocations can affect the
genetic composition of a spreading species, its gene pool
will be retained with a higher probability in the area of origin than in areas of colonization. Additionally, extensive
inter-specific gene flow in the genus Sus took place during
glacial periods when a land bridge formed between the
islands of Southeast Asia [14], and this could explain the
observed high level of genetic diversity in ISEA.
Structure analysis using the hierarchical island model revealed that Indonesian wild boars are differentiated from
other populations of Southeastern Asia, despite some individuals with genetic profiles similar to those of wild boars
from Yunnan province and Vietnam (Figures 2 and 3). In
addition, the high proportion of private alleles and high allelic diversity in the Indonesian wild boar population support its subspecific classification as the “Indonesian race”,
S. s. vittatus, proposed by Groves and Grubb [15].
In contrast, wild boars from most of mainland Korea and
Jeju Island had genetic diversity almost two fold lower than
wild boars from Southeast Asia. The wild boar population
Choi et al. BMC Genetics 2014, 15:85
/>
Page 6 of 10
Figure 3 Individual membership of wild boar samples from East Asia to the K clusters inferred by structure analysis. Codes on the x-axis
indicate the putative population of origin. See Table 1 for location abbreviations. Each color denotes a cluster from the structure analysis.
Table 3 Analysis of Molecular Variance (AMOVA) of wild
boars from three geographic regions
Source
df
SS
MS
Est. Var.
%
Among regions
2
290.580
145.290
0.643
9%
Among populations
7
241.790
34.541
0.702
10%
Among individuals
228
1327.662
5.823
0.389
6%
5.044
Within individuals
238
1200.500
Total
475
3060.532
F-statistics
Value
P-value
FRT
0.095
0.001
FSR
0.114
0.001
FST
0.198
0.001
FIS
0.072
0.001
FIT
0.256
0.001
5.044
74%
6.778
100%
Three regions; North-East region (RUPW, KGGW, KGWW, KGSW, KJLW, JPNW),
Jeju Island (KJIW) and South-East region (CYNW, VIEW, INDW). See Table 1 for
location abbreviations.
df: Degrees of freedom; SS: Sums of squares; MS: Mean squares; Est. Var.:
Estimated variance within and among populations.
from Jeju Island (HE = 0.549; Ar = 3.1) exhibited the lowest
genetic diversity among all populations sampled from East
Asia. Negligible gene flow from the Korean mainland
(mean Nm = 0.764, Table 2), and the sudden population increase on Jeju Island during recent decades, could account
for the low level of genetic diversity on the island, and suggest there has not been enough time to reach mutation/
migration-drift equilibrium since human-mediated translocation or natural migration.
Patterns of genetic diversity and differentiation at local
and regional scales observed in this study, together with
results from the model-based structure analysis, suggest
that wild boars in Northeast Asia share closer ancestry
with wild boars in southern China than do those in
Vietnam and Indonesia, indicating gradual gene flow from
ISEA through Southern China (Figure 2). A diverging gene
pool and high level of genetic diversity in wild boars from
East Asia are likely reflected in a high diversity of local pig
breeds in Asia, arising during multiple and independent
domestication events in this region [16].
Choi et al. BMC Genetics 2014, 15:85
/>
In contrast to a previous study based on mtDNA and
nuclear genes [11], which found no genetic structure
among wild boar populations in East Asia, we found high
genetic variation and differentiation between wild boar
populations at both local and regional levels. Mitochondrial DNA sequence comparisons indicated that genetic
clusters of wild boars from East Asia, including China,
Korea, Japan and the Russian Far East, were not clearly
separated by region [10]. In addition, no conspicuous genetic structure in East Asia, including China, Korea and
Japan, was detected based on three different marker systems, mtDNA, microsatellite and Y-chromosome genes
[17]. In these cases, the number of samples and markers
used for wild boar study in East Asia probably were not
enough to detect population structure. Alternatively, the
use of populations such as domestic pigs with strong geographic structuring could mask the hidden structure of
wild boars in East Asia that might otherwise exist in such
region. Our contrasting results relative to previous studies
[10,11,17] could also be due to the use of different marker
systems. Although both mtDNA and microsatellite loci
analyses showed indication of population structuring in
European wild boars [18-20], microsatellite loci have
shown better resolution in detecting genetic structure
among geographic populations than mtDNA [18].
Population differentiation and admixture in the recent
past can be better detected by fast-evolving markers like
microsatellites.
Geographical distance was significantly correlated with
genetic distance when the unique Jeju population was excluded (Additional file 1: Figure S2). A hierarchical genetic
differentiation related to geographical distances is also
well-supported by the AMOVA incorporating three regions (Table 3). Furthermore, Principal Coordinates Analysis (PCA) showed the wild boar populations in East Asia
occupied unique positions along PC 1, mainly related to
geographic distribution. Taken together, our data indicate
that genetic differentiation of wild boars in East Asia is
maintained by geographic separation.
Genetic status of local wild boar populations in
South Korea
Archaeological evidence suggests that wild boars appeared
on the Korean peninsula in the mid-Pleistocene, ca.
780,000 to 130,000 years before present [21]. However,
predators, such as wolf and tiger, which have played important roles in effectively controlling the population size
of wild boar, have been absent from South Korea over recent decades. As a result, wild boar is the largest mammal
with an extensive distribution in South Korea, although
Asiatic black bears (Ursus thibetanus) were reintroduced
to the mainland a decade ago [22]. Archaeological evidence
and ancient records indicate that wild boars became established on Jeju Island, the largest island in southern Korea,
Page 7 of 10
presumably between the 1st and 8th centuries A.D. [23,24].
Modern populations decreased and went undetected for
several decades, but over the last decade, wild boars have
greatly increased on the island. Although the reason for
the recent increase of wild boars on Jeju Island is unclear,
it has been assumed that some captive individuals escaped
to the wild. As a consequence of wild boar population
growth on the mainland and Jeju Island in South Korea,
proper management of the species is of increasing concern, and population genetics would be a useful tool to reveal whether gene flow occurs between local wild boar
populations.
Structure analysis (K = 7) showed that wild boars from
mainland Korea are represented by two genetic clusters
(Figures 2 and 3). Although genetic traits within populations in mainland Korea were not clearly discrete, genetic
profiles were gradually displaced from the north-central
region (KGGW and KGWW) to the southeast region
(KGSW), followed by the southwest region (KJLW)
(Figure 2). Pairwise FST and gene flow estimates (Nm)
support a gradual cline in genetic structure in mainland
Korea (Table 2). These three regions of the Korean peninsula are geographically separated by the Baekdu-daegan
mountain range, which runs most of the length of the
eastern peninsula, from Baekdu Mountain in the north to
Jiri Mountain in the mid-south. This mountain range may
function as a geographical barrier to wild boar dispersal,
although they are capable of crossing mountain ridges.
Moreover, S. scrofa does not tend to disperse long distances from their birth site, with geographic ranges less
than 6.5 Km2 [25,26].
Our result showed that Jeju wild boar had a closer
relationship with Yunnan rather than the mainland
Korea, which suggests that wild boars in Jeju Island share
closer common ancestry with wild boars in Yunnan, China
than mainland Korea. This is in agreement with the conclusion of a previous study that Jeju Island wild boars
probably introduced from somewhere in China [27], and
were not directly originated from mainland Korea. A
phylogenetic study using mitochondrial sequences suggested that wild boar from Jeju Island should be allocated
to the Chinese wild boar cluster [27]. However, precise
identification of the geographic origin of the Jeju Island
wild boar will require a survey of more samples from
broadly spaced regions using a variety of analytical
methods, such as paternal history using Y-chromosome
genes and maternal history using mitochondrial DNA.
For effective management of wild boars in Korea, genetic traits must be considered to establish appropriate
strategies. Our results show that wild boar populations on
mainland Korea are genetically structured. For example,
wild boars from Jeolla-do, in the southwest region of
South Korea, shared only 3.6% genetic composition with
the population from Gyeonggi-do in the northwest. This
Choi et al. BMC Genetics 2014, 15:85
/>
result indicates that wild boar distribution and partial isolation in the Korean peninsula are possibly maintained by
geographic barriers such as mountain ridges, lowlands
and islands. Although wild boars are now abundant in
South Korea, various levels of genetic and ecological studies
will be required to obtain adequate information for
long-term management.
Conclusions
Microsatellite loci analyses revealed wild boar populations of East Asia are genetically diverse and structured,
and that genetic distance is correlated with geographic
distance. The level of genetic diversity decreases gradually from Southeastern Asia to Northeastern Asia,
reflecting northward spread of ancestral wild boar populations in East Asia. We also observed conspicuous genetic
structure and divergence among wild boar populations at
local and regional scales in East Asia. High levels and diverse patterns of genetic variation among regional populations of wild boars from East Asia have likely contributed
to the high genetic diversity of local domestic pig populations retained through multiple independent domestications [3]. In addition, extant genetic richness of wild boars
in East Asia can become an important resource for the future breeding of domestic pigs. Although microsatellites
provide genetic information other markers do not, novel
approaches such as SNP and genome sequencing also will
be helpful in better understanding the population structure of wild boars in East Asia. Moreover, further studies
with more samples at larger and finer geographic scales
will shed light on unresolved questions, such as the paternal and maternal history, and the phylogeography of wild
boars from Eurasia. Such studies are currently underway.
Methods
Sample collection
Samples from a total of 238 wild boars, mostly muscle
tissue, some blood and hair, were collected from ten locations across six countries; Russia (Primorsky Krai, RUPW),
Japan (JPNW), China (Yunnan province, CYNW), Vietnam
(VIEW), Indonesia (INDW) and South Korea. This experimental work was conducted with permission by the
Conservation Genome Resource Bank for Korean Wildlife
(CGRB) that provided wild boar samples for this study. All
samples were legally collected and deposited into CGRB.
The procedures involving animal samples followed the
guidelines by Seoul National University Institutional
Animal Care and Use Committee (SNUIACUC). Wild
boars in South Korea were divided into five regional groups
according to the province of collection and other geographic considerations: Gyeonggi-do (KGGW), Gangwon-do
(KGWW), Gyeongsang-do (KGSW), Jeolla-do (KJLW) and
Jeju Island (KJIW) (Table 1, Figure 2). All the samples were
stored at −70°C until DNA extraction.
Page 8 of 10
Microsatellite markers and PCR
In this study, we selected and tested 18 of 30 polymorphic
microsatellite markers developed for swine biodiversity
studies [28]. We carried out a series of tests using a subset
of Korean wild boars to verify if these markers adequately
fit marker selection criteria suggested by Kim et al. [29]. 16
of 18 markers revealed good scorability, Hardy–Weinberg
equilibrium, absence of null alleles, evidence of selective
neutrality and linkage equilibrium between loci. Therefore,
these 16 markers were used for wild boar population genetics in this study. Information on genetic variation for individual markers from wild boars sampled at each location
is shown in (Additional file 1: Table S1).
Genomic DNA was extracted using the DNeasy Blood &
Tissue Kit or Gentra Puregene Tissue Kit (QIAGEN) according the manufacturer’s instructions. The 16 microsatellite loci were amplified using the Multiplex PCR Kit
(QIAGEN). Touchdown PCR was carried out under the
following conditions: initial denaturation for 15 min at
95°C, followed by seven touchdown cycles starting at
94°C for 30s, 67°C for 90s, and 72°C for 60s, with annealing temperature decreasing by 2°C per cycle to 53°C. The
touchdown cycles were followed by an additional 25 cycles
at 94°C for 30s, 53°C for 90s, 72°C for 60s, and a final extension at 60°C for 30 min. Individuals were genotyped
using a DNA Sequencer (ABI Prism 3730 XL DNA
Analyzer, Applied Biosystems).
Data analysis
Measures of genetic diversity, including mean number of
alleles (Ad) per locus, observed heterozygosity (HO), and
expected heterozygosity (HE) under Hardy-Weinberg assumptions, were estimated using the Microsatellite Tool
Kit [30]. Allelic richness (Ar) [31] is a fundamental measure of genetic diversity. It was calculated based on the
minimum sample size of each population to correct for
differences in sample size among populations using the
rarefaction approach implemented in FSTAT v. 2.9.3 [32].
Inbreeding coefficient, FIS, and the level of genetic differentiation between each pair of populations, pairwise FST
estimates, and their significance values were calculated
using a permutation approach with FSTAT v. 2.9.3 [32].
Significance level was determined after applying the sequential Bonferroni correction to take account of
experiment-wise errors due to multiple tests [33]. Indirect estimates of gene flow (Nm, effective number of migrants per generation) were calculated from FST using
the equation of Wright [34]. The software program
GenAlEx v.6.0 [35] was used to conduct Principal Coordinates Analysis (PCA) to visualize geometric relationships
between wild boar populations. GenAlEx v.6.0 was further
used to carry out an analysis of molecular variance
(AMOVA) for wild boars among three potential regions suggested by the model-based clustering analysis
Choi et al. BMC Genetics 2014, 15:85
/>
(see Results): North-East (RUPW, KGGW, KGWW,
KGSW, KJLW and JPNW), Jeju Island (KJIW) and
South-East (CYNW, VIEW and INDW). Significance
level was calculated by the permutation procedure
(999 permutations). We checked for isolation by distance (IBD) [34] by testing for correlation between genetic
distance, FST/(1-FST), and geographic distance among
locations using Mantel’s test in GenAlEx v.6.0, and significance was determined based on 999 permutations. The
DISPAN computer program [36] was used to construct
the genetic relationship tree based on Nei’s DA genetic distance by the neighbor-joining (NJ) method [37,38].
To assess population structure, STRUCTURE 2.3.3 software [39] was used. The number of MCMC (Markov
chain Monte Carlo) replications was set to 200,000 after a
burn-in period of 100,000 using the default parameters of
an admixture model and correlated allele frequencies
among populations. The number of inferred clusters (K)
was estimated according to the method of Evanno et al.
[13], where an ad hoc statistic ΔK is based on the rate of
change in the log probability of data between successive K
values. Ten runs were carried out for each K, from 1 to
12, to quantify the amount of variation of the likelihood
value. Initially, we obtained the highest ΔK value when K
was set to 3 (see Results). Three main clusters, therefore,
were further analyzed according to the hierarchical island
model to probe for possible hidden substructure for each
predefined cluster [13].
Additional file
Additional file 1: Figure S1. Plot of mean posterior probability (LnP(D))
values per clusters (K), based on 10 iterations per K, generated by the
STRUCTURE program [39], and delta K analysis of LnP(D), according to
Evanno et al. [13]. Figure S2: Regression of genetic distance on
geographic distance between pairs of East Asian wild boar populations.
A. Analysis using all populations included (P = 0.140); B. Analysis after
excluding wild boars from Jeju Island (P = 0.002). Mantel’s test for
correlations was carried out with 999 permutations. Table S1: Genetic
characteristics of 16 microsatellite DNA loci for ten sampling locations in
East Asia. See Table 1 for sample locations.
Competing interests
The authors declare that they have no competing interests.
Authors’ contributions
SKC carried out the molecular genetic studies, participated in the experiments,
data analyses, and drafted the manuscript. KSK and HL conceived of the study,
and participated in its design and coordination and helped to draft the
manuscript. JEL participated in the experiment. YJK, MSM, IV, AM, JGO, THK, IS,
NI, LY, YPZ and NM provided genetic materials and helped to draft the
manuscript. All authors read and approved the final manuscript.
Acknowledgments
We gratefully acknowledge to Dr. Thomas W. Sappington, USDA-ARS, for his
valuable comments on this manuscript. This work was supported by a Korea
Science and Engineering Foundation (KOSEF) grant funded by the Korean
government (MEST) (No. 2009–0080227).
Page 9 of 10
Author details
College of Veterinary Medicine, Seoul National University, Seoul, Republic of
Korea. 2National Institute of Ecology, Seocheon-gun, Chungcheongnam-do,
Republic of Korea. 3Lazovsky State Nature Reserve, Lazo, Primorsky Krai, Russia.
4
Research Institute for Hallasan, Jeju Special Self-Governing Province, Jeju, Republic
of Korea. 5Division of Animal Genomics and Bioinformatics, National Institute of
Animal Science, Rural Development Administration, Suwon, Gyeonggi-do,
Republic of Korea. 6Institute of Plant and Animal Ecology Urals Branch of Russian
Academy of Sciences, Yekaterinburg, Russia. 7Pacific Geographical Institute Far
Eastern Branch of Russian Academy of Sciences, Vladivostok, Russia. 8Laboratory of
Food and Environmental Hygiene, Veterinary Medicine, Gifu University, Gifu, Japan.
9
Laboratory for Conservation and Utilization of Bio-resource and Key Laboratory
for Microbial Resources of the Ministry of Education, Yunnan University, Kunming,
China. 10State Key Laboratory of Genetic Resources and Evolution,
Kunming Institute of Zoology, Chinese Academy of Sciences, Kunming,
China. 11Department of Ecology, Evolution, and Organismal Biology, Iowa
State University, Ames, IA, USA.
1
Received: 4 March 2014 Accepted: 10 July 2014
Published: 17 July 2014
References
1. Oliver WLR, Brisbin IL Jr, Takahashi S: The Eurasian Wild Pig (Sus scrofa).
In Status Survey and Conservation Action Plan: Pigs, Peccaries and Hippos.
Chapter 5.2. Edited by Oliver WLR. Gland, Switzerland: IUCN; 1993:112–121.
2. Randi E: Conservation genetics of the genus Sus. IBEX J M E 1995, 3:6–12.
3. Larson G, Dobney K, Albarella U, Fang M, Matisoo-Smith E, Robins J, Lowden S,
Finlayson H, Brand T, Willerslev E, Rowley-Conwy P, Andersson L, Cooper A:
Worldwide phylogeography of wild boar reveals multiple centers of pig
domestication. Science 2005, 307:1618–1621.
4. Wu GS, Yao YG, Qu KX, Ding ZL, Li H, Palanichamy MG, Duan ZY, Li N, Chen YS,
Zhang YP: Population phylogenomic analysis of mitochondrial DNA in wild
boars and domestic pigs revealed multiple domestication events in East
Asia. Genome Biol 2007, 8:R245.
5. Luetkemeier ES, Sodhi M, Schook LB, Malhi RS: Multiple Asian pig origins
revealed through genomic analyses. Mol Phylogenet Evol 2010, 54:680–686.
6. Giuffra E, Kijas JM, Amarger V, Carlborg O, Jeon JT, Andersson L: The origin
of the domestic pig: independent domestication and subsequent
introgression. Genetics 2000, 154:1785–1791.
7. Manunza A, Zidi A, Yeghoyan S, Balteanu VA, Carsai TC, Scherbakov O, Ramírez O,
Eghbalsaied S, Castelló A, Mercadé A, Amills M: A high throughput genotyping
approach reveals distinctive autosomal genetic signatures for European and
Near Eastern wild boar. PLoS ONE 2013, 8:e55891.
8. Hongo H, Ishiguro N, Watanobe T, Shigehara N, Anezaki T, Long VT, Binh DV,
Tien NT, Nam NH: Variation in mitochondrial DNA of Vietnamese pigs:
relationships with Asian domestic pigs and Ryukyu wild boars. Zoolog Sci
2002, 19:1329–1335.
9. Cho IC, Han SH, Fang M, Lee SS, Ko MS, Lee H, Lim HT, Yoo CK, Lee JH,
Jeon JT: The robust phylogeny of Korean wild boar (Sus scrofa coreanus)
using partial D-loop sequence of mtDNA. Mol Cells 2009, 28:423–430.
10. Ramayo Y, Shemeret’eva IN, Pérez-Enciso M: Mitochondrial DNA diversity
in wild boar from the Primorsky Krai Region (East Russia). Anim Genet
2010, 42:96–99.
11. Ji Y-Q, Wu D-D, Wu G-S, Wang G-D, Zhang Y-P: Multi-locus analysis reveals a
different pattern of genetic diversity for mitochondrial and nuclear DNA
between wild and domestic pigs in East Asia. PLoS ONE 2011, 6:e26416.
12. Larson G, Liu R, Zhao X, Yuan J, Fuller D, Barton L, Dobney K, Fan Q, Gu Z,
Liu X-H, Luo Y, Lv P, Andersson L, Li N: Patterns of East Asian pig domestication,
migration, and turnover revealed by modern and ancient DNA. Proc Natl Acad
Sci U S A 2010, 107:7686–7691.
13. Evanno G, Regnaut S, Goudet J: Detecting the number of clusters of
individuals using the software STRUCTURE: a simulation study. Mol Ecol
2005, 14:2611–2620.
14. Frantz LA, Schraiber JG, Madsen O, Megens HJ, Bosse M, Paudel Y, Semiadi G,
Meijaard E, Li N, Crooijmans RP, Archibald AL, Slatkin M, Schook LB, Larson G,
Groenen MA: Genome sequencing reveals fine scale diversification and
reticulation history during speciation in Sus. Genome Biol 2013, 14:R107.
15. Groves CP, Grubb P: The Eurasian Suids Sus and Babyrousa. In Status
Survey and Conservation Action Plan: Pigs, Peccaries and Hippos. Chapter 5.1.
Edited by Oliver WLR. Gland, Switzerland: IUCN; 1993:107–111.
Choi et al. BMC Genetics 2014, 15:85
/>
16. Larson G, Cucchi T, Dobney K: Genetic Aspects of Pig Domestication.
In The Genetics of the Pig. Chapter 2. 2nd edition. Edited by Rothschild MF,
Ruvinsky A. Oxfordshire: CAB International; 2011:14–37.
17. Ramírez O, Ojeda A, Tomás A, Gallardo D, Huang LS, Folch JM, Clop A,
Sánchez A, Badaoui B, Hanotte O, Galman-Omitogun O, Makuza SM, Soto H,
Cadillo J, Kelly L, Cho IC, Yeghoyan S, Pérez-Enciso M, Amills M: Integrating
Y-Chromosome, mitochondrial, and Autosomal data to analyze the
origin of pig breeds. Mol Biol Evol 2009, 26:2061–2072.
18. Scandura M, Iacolina L, Crestanello B, Pecchioli E, Di Benedetto MF,
Russo V, Davoli R, Apollonio M, Bertorelle G: Ancient vs. recent
processes as factors shaping the genetic variation of the European
wild boar: are the effects of the last glaciation still detectable?
Mol Ecol 2008, 17:17451762.
19. Vilaỗa ST, Biosa D, Zachos F, Iacolina L, Kirschning J, Alves PC, Paule L,
Gortazar C, Mamuris Z, Jedrzejewska B, Borowik T, Sidorovich VE, Kusak J,
Costa S, Schley L, Hartl GB, Apollonio M, Bertorelle G, Scandura M:
Mitochondrial phylogeography of the European wild boar: the effect of
climate on genetic diversity and spatial lineage sorting across Europe.
J Biogeogr 2014, 41:987–998.
20. Alexandri P, Triantafyllidis A, Papakostas S, Chatzinikos E, Platis P,
Papageorgiou N, Larson G, Abatzopoulos TJ, Triantaphyllidis C: The Balkans
and the colonization of Europe: the post-glacial range expansion of the
wild boar, Sus scrofa. J Biogeogr 2012, 39:713–723.
21. Norton CJ: The current state of Korean paleoanthropology. J Hum Evol
2000, 38:803–825.
22. Kim YK, Hong YJ, Min MS, Kim KS, Kim YJ, Voloshina I, Myslenkov A,
Smith GJD, Cuong ND, Tho HH, Han SH, Yang DH, Kim CB, Lee H:
Genetic status of Asiatic black bear (Ursus thibetanus) reintroduced
into South Korea based on mitochondrial DNA and microsatellite loci
analysis. J Hered 2011, 102:165–174.
23. Shin T, Jin J, Lee C: Archaeological study of animal bones excavated from
Cheju Kimnyungri cave site. Korean J Vet Res 1996, 36:757–761
(in Korean with English abstract).
24. Kim H-L, Kang C-H, Shin T-K: Comparative anatomical study on animal
bones excavated from the Jongdal-ri shell mound archaeological site
IV on Jeju Island. Korean J Vet Res 2002, 42:309–320 (in Korean with
English abstract).
25. Caley P: Movements, activity patterns and habitat use of feral pigs
(Sus scrofa) in a tropical habitat. Wildl Res 1997, 24:77–87.
26. Choi TY, Lee YS, Park CH: Home-range of wild boar, Sus scrofa living in
the Jirisan National Park, Korea. J Ecol Field Biol 2006, 29:253–257
(in Korean with English abstract).
27. Han SH, Oh JG, Cho IC, Ko MS, Kim TW, Chang MH, Kim BS, Park SG, Oh HS:
A molecular genetic analysis of the introduced wild boar species (Sus
scrofa coreanus) on Mount Halla, Jeju Island, Korea. Kor J Env Eco 2011,
5:658–665 (in Korean with English abstract).
28. FAO: Swines. In Secondary Guidelines for Development of National Farm Animal
Genetic Resources Management Plans. Measurement of Domestic Animal Diversity
(MoDAD): Recommended Microsatellite Markers. Rome: FAO; 1998:19–24.
29. Kim KS, Stolz U, Miller NJ, Waits ER, Guillemaud T, Sumerford DV,
Sappington TW: A core set of microsatellite markers for western corn
rootworm (Coleoptera: Chrysomelidae) population genetics studies.
Environ Entomol 2008, 37:293–300.
30. Park SDE: Trypanotolerance in West African cattle and the population
genetic effects of selection. In PhD thesis. Ireland: University
of Dublin; 2001.
31. Hurlbert SH: The nonconcept of species diversity: a critique and
alternative parameters. Ecology 1971, 52:577–586.
32. Goudet J: FSTAT(version 1.2): a computer program to calculate
F-statistics. J Hered 1995, 86:485–486.
33. Rice WR: Analyzing tables of statistical tests. Evolution 1989, 43:223–225.
34. Wright S: Isolation by distance. Genetics 1943, 28:114–138.
35. Peakall R, Smouse PE: GENALEX 6: genetic analysis in Excel. Population
genetic software for teaching and research. Mol Ecol Notes 2006,
6:288–295.
36. Ota T: DISPAN: genetic distance and phylogenetic analysis. University Park,
Pennsylvania, USA: Pennsylvania State University; 1993.
Page 10 of 10
37. Nei M, Tajima F, Tateno Y: Accuracy of estimated phylogenetic trees from
molecular data. J Mol Evol 1983, 19:153–170.
38. Saitou N, Nei M: The neighbor-joining method: a new method for
reconstructing phylogenetic tree. Mol Biol Evol 1987, 4:406–425.
39. Pritchard JK, Stephens M, Donnelly P: Inference of population structure
using multilocus genotype data. Genetics 2000, 155:945–959.
doi:10.1186/1471-2156-15-85
Cite this article as: Choi et al.: Genetic structure of wild boar (Sus scrofa)
populations from East Asia based on microsatellite loci analyses. BMC
Genetics 2014 15:85.
Submit your next manuscript to BioMed Central
and take full advantage of:
• Convenient online submission
• Thorough peer review
• No space constraints or color figure charges
• Immediate publication on acceptance
• Inclusion in PubMed, CAS, Scopus and Google Scholar
• Research which is freely available for redistribution
Submit your manuscript at
www.biomedcentral.com/submit