Holm multiple correction for large-scale geneshape association mapping
Bạn đang xem bản rút gọn của tài liệu. Xem và tải ngay bản đầy đủ của tài liệu tại đây (964.04 KB, 8 trang )
Fu et al. BMC Genetics 2014, 15(Suppl 1):S5
/>
PROCEEDINGS
Open Access
Holm multiple correction for large-scale geneshape association mapping
Guifang Fu*, Garrett Saunders, John Stevens
From International Symposium on Quantitative Genetics and Genomics of Woody Plants
Nantong, China. 16-18 August 2013
Abstract
Background: Linkage Disequilibrium (LD) is a powerful approach for the identification and characterization of
morphological shape, which usually involves multiple genetic markers. However, multiple testing corrections
substantially reduce the power of the associated tests. In addition, the principle component analysis (PCA), used to
quantify the shape variations into several principal phenotypes, further increases the number of tests. As a result, a
powerful multiple testing correction for simultaneous large-scale gene-shape association tests is an essential part of
determining statistical significance. Bonferroni adjustments and permutation tests are the most popular approaches
to correcting for multiple tests within LD based Quantitative Trait Loci (QTL) models. However, permutations are
extremely computationally expensive and may mislead in the presence of family structure. The Bonferroni
correction, though simple and fast, is conservative and has low power for large-scale testing.
Results: We propose a new multiple testing approach, constructed by combining an Intersection Union Test (IUT)
with the Holm correction, which strongly controls the family-wise error rate (FWER) without any additional
assumptions on the joint distribution of the test statistics or dependence structure of the markers. The power
improvement for the Holm correction, as compared to the standard Bonferroni correction, is examined through a
simulation study. A consistent and moderate increase in power is found under the majority of simulated
circumstances, including various sample sizes, Heritabilities, and numbers of markers. The power gains are further
demonstrated on real leaf shape data from a natural population of poplar, Populus szechuanica var tietica, where
more significant QTL associated with morphological shape are detected than under the previously applied
Bonferroni adjustment.
Conclusion: The Holm correction is a valid and powerful method for assessing gene-shape association involving
multiple markers, which not only controls the FWER in the strong sense but also improves statistical power.
Background
Linkage Disequilibrium (LD)-based Quantitative Trait
Loci (QTL) studies now involve large-scale numbers of
genetic markers and play a significant role in identifying
underlying genetic variants for complex quantitative
traits such as morphological shape or human disease
[1-5]. A major issue for LD based QTL mapping is in
determining significance levels for the testing of multiple
individual markers. Three reasons add to the complexity
of this multiple testing correction. First, new genotyping
* Correspondence:
Department of Mathematics & Statistics, Utah State University, 3900 Old
Main, Logan, UT, USA
techniques make it common to measure tens of thousands of markers. The more statistical tests that we perform for identifying significant gene-trait associations,
the more likely we are to reject the null hypothesis when
it is true. This problem is also called the inflation of the
type I error [6,7]. Second, high dimensional shape traits,
often quantified by multiple principal components, dramatically increase the number of multiple tests by as
much as three or more times [5,8,9]. Third, independence of test statistics is not guaranteed because correlations between markers lead to highly complicated and
unknown dependency structures.
© 2014 Fu et al.; licensee BioMed Central Ltd. This is an Open Access article distributed under the terms of the Creative Commons
Attribution License ( which permits unrestricted use, distribution, and reproduction in
any medium, provided the original work is properly cited. The Creative Commons Public Domain Dedication waiver (http://
creativecommons.org/publicdomain/zero/1.0/) applies to the data made available in this article, unless otherwise stated.
Fu et al. BMC Genetics 2014, 15(Suppl 1):S5
/>
The Bonferroni correction, as one of the most popular
multiple correction approaches, is known to be conservative and have low power for large-scale tests [10].
Permutations, although the current gold standard for
assessing significance levels in genetic mapping studies
with multiple markers, is extremely time consuming due
to its computational burden, and may not work well if
the population has family structure [6,11-13]. Therefore,
it is necessary to seek alternative approaches that can
improve the power for largescale simultaneous individual marker tests while preserving control of the familywise error rate (FWER) under nominal significance
thresholds (e.g. a = 0.05) [14,15].
In this article, we propose a uniformly more powerful
sequentially rejective multiple testing approach that
strongly controls the FWER for the LD based shape mapping model, by merging Holm’s procedure [16] with the
Intersection Union Test (IUT) [17]. The new procedure
makes no assumptions on the joint distribution of the test
statistics. The advantage of the Holm correction over the
standard Bonferroni correction has been known to statisticians for over 35 years [16,18-20] but has not yet gained
traction in LD based QTL mapping.
A critical challenge in large-scale LD association tests is
the increase in the false positive rate if selected markers
are not in complete LD with each other. In this case, the
power is likely reduced (or false negative rate inflates) if
the correction for multiple comparisons is overly conservative or if independence is assumed for markers with
strong LD associations with each other. Despite the fact
that the false discovery rate (FDR) is very popular and has
been extensively used in multiple hypothesis testing [21],
the FWER, the probability of making at least one type I
error, exerts a more stringent control over the FDR. Since
FDR is controlled only for all selected markers and provides no promise of control for an arbitrarily selected subset of the significant markers, researchers may detect
more spurious QTLs using the FDR in place of the FWER
as they often consider only a subset of the significant
results [22]. Therefore, we recommend controlling the
FWER rather than FDR whenever only the most promising results are valued, such as in LD based QTL mapping.
Detecting a significant shape QTL requires two hypothesis tests [5], the first testing for the association between
QTL and shape, and the second testing for the LD
between the observable marker and underlying QTL. Currently, Bonferroni corrections are applied separately to
two families of hypotheses, one family consisting of the
first hypothesis test for all markers, and the other family
consisting of the second hypothesis test for all markers.
Only those markers showing significance within both
families, after correcting for multiple tests, are identified as
linked to a QTL. This amounts to performing an IUT with
the two test statistics for each marker and applying a
Page 2 of 8
Bonferroni correction for multiple markers. Although the
LD based QTL model has been successful in locating significant QTLs [5,23,24], two improvements can be made
within the multiple hypothesis testing aspect. First, several
gene-shape association tests were made separately for each
principal component (PC). Since these PCs quantify the
original high dimensional shape variations from different
directions, the multiple testing correction should account
for these separate PCs as well as for multiple markers.
Currently, multiple PCs are not accounted for in the multiplicity correction. Second, we introduce the uniformly
more powerful Holm adjustment on the p-values resulting
from the IUT, which shows greater power than the Bonferroni approach.
The significance of the power advantage of the Holm
method over the Bonferroni method is demonstrated
through both simulations and a real leaf shape data of a
natural population of poplar, Populus szechuanica var tietica. We detect more significant QTL than were previously
detected in the literature while still ensuring strong control of the FWER. Since sample size, Heritability, and
number of markers all determine the power, we illustrate
the power differences for Heritabilities of 0.1 and 0.4, sample size small (100), medium (300), and large (500), and
number of markers changing from 1, 10, 50, 100, 500 to
1,000.
Results
Power simulation
We investigated a simulation study to quantify the power
advantage of the Holm adjustment over the standard
Bonferroni adjustment within the LD based QTL mapping model of [5]. The QTL, phenotype, and markers
were generated under the assumptions of the alternative
hypotheses in (3) and (4). The QTL was generated using
an assigned probability of q = 0.7 for the major allele. For
each individual i, Qi = l with l ∈ {1, 2, 3} was used to
code the QTL genotypes of aa, Aa, and AA, respectively.
The normally distributed phenotype dependent on the
value of the QTL is generated as Yi|(Qi = l) ~ N (µl, s).
The means for the phenotype Y corresponding to the
values of the QTL were set at µ1 = 8, µ2 = 10 and µ3 =
12. markers were then generated using the conditional
probability of the marker genotype given the value of the
QTL genotype for each individual. In general, for an LD
based QTL mapping model, researchers genotype the
marker first and then use the marker to generate a QTL
based on the conditional probability of QTL genotype
given marker genotype. However, for our purposes, we
are interested in extending from single marker mapping
to multiple marker mapping. Therefore, we derive
the conditional probability of marker genotype given
QTL genotype (see Table 1) from the Bayes Rule in
Equation (1) and Table 2.
Fu et al. BMC Genetics 2014, 15(Suppl 1):S5
/>
Page 3 of 8
Table 1 The theoretical conditional probabilities of
marker genotype (columns) given QTL genotype (rows).
AA
Aa
aa
MM
Mm
mm
p211
q2
2p11 p10
q(1 − q)
p210
2p11 p01
q2
2(p11 p00+ p10 p01 )
p201
q2
2p200
(1 − q)2
2p10 p00
(1 − q)2
p200
(1 − q)2
(1 − q)2
(1 − q)2
P(M—QTL) =
P(QTL)
.
P(QTL)
(1)
Sample sizes of n = 100, 300, and 500 were used to
represent small, medium, and large sample sizes, respectively. The number of markers per simulation was set at
m = 1, 10, 50, 100, 500, and 1,000 to show the initial
power under the single marker scenario and the corresponding decreasing power trend as the number of markers increases. Finally, the heritability was set at two
values, H2 = 0.1 and 0.4, corresponding to high and low
error variance [25]. The model error variance s2 was
computed using the heritability and genetic variance of
the QTL. Power estimates were averaged over 1,000
simulations.
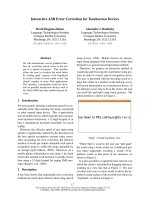
The simulation results, depicted in Figure 1 and
shown in Additional file 1, demonstrate the power comparison of the Holm adjustment with the traditional
Bonferroni adjustment. These results provide an experimental reference for researchers about how power varies
among different sample size n, the number of markers
m, and the degree of heritability (H2). As expected, the
power under high heritability (B: H 2 = 0.4) is much
higher than that of the low heritability (A: H2 = 0.1) and
the power under large sample size (n = 500, blue curves)
is much higher than that of the small sample size (n =
100, green curves). Under high heritability (H2 = 0.4)
and a larger sample size (n = 500), the power of the
Holm multiplicity adjustment remains high, at least
99%, as the number of markers vary from 1 to 1,000.
However, in practice it is often expensive to collect so
many sample measurements, so these results are useful
in deciding the opportunity costs in power for smaller
sample sizes. It is worth noting that for moderate numbers of markers, the power increase of the Holm over
Table 2 The theoretical joint distribution probabilities of
marker and QTL haplotypes.
MM
Mm
mm
AA
Aa
aa
p211
2p11 p01
p201
2p11 p10
2(p11 p00 + p10 p01 )
2p01 p00
p210
2p10 p00
p200
the Bonferroni adjustment allows for maintaining the
same power level of the Bonferroni adjustment while
decreasing the sample size of the study or increasing the
number of markers, a great advantage for researchers.
For example, with a medium sample size of 300, the
Holm correction maintains a power of 95% for 100 markers. Even when number of markers increase to 1, 000,
the power achieved by the Holm correction is still as
high as 80%.
Although the power increase of the Holm adjustment
improves moderately over the standard Bonferroni
adjustment for the case of high heritability (H2 = 0.4)
when the sample size is small (n = 100), these findings
are comparable to seminal results found by previous
multiplicity improvements over their competitors
[16,21]. For the worst case when the data has extremely
large variance (H 2 = 0.4) and relatively much smaller
sample size (n = 100), the improvement of Holm over
Bonferroni is not obvious. However, it is not an issue of
multiple hypothesis testing but an issue of the least sample size necessary to guarantee a decent level of power.
All in all, the Holm method generally shows a valuable
increase in power over the Bonferroni adjustment under
the majority of simulated circumstances, including different combinations of sample size, numbers of markers,
and Heritability. As long as the sample size is reasonably
large in comparison to the variance to guarantee decent
power, the improvement of the Holm correction over
the Bonferroni is consistently meaningful.
Poplar leaf shape QTL mapping project
To show how the power advantage of the Holm approach
leads to increased scientific discovery over the Bonferroni
adjustment, we apply it to a real poplar leaf shape QTL
mapping study [5]. The study design used a representative leaf from each of 106 poplar trees (i.e., Populus szechuanica var. tibetica belonging to the Tacamahaca
section) that was randomly selected and photographed
for shape QTL analysis. The trees were also genotyped
for a panel of 29 microsatellite markers (16 of them were
considered). A Radius Centroid Contour (RCC) approach
was used to represent the leaf shape (phenotype) with a
high dimensional curve. The first three principal components (PCs) were selected to capture the majority variation of leaf shape from different directions to quantify
the original high dimensional shape curves respectively.
Significant QTLs affecting the shape variability (i.e.,
affecting the most important PCs) were mapped through
the statistical LD based QTL mapping model [5]. Previously, the standard Bonferroni adjustment was used to
control the FWER for the multiple markers [5, Table 1].
However, the researchers did not consider the multiple
testing correction issue introduced by multiple PCs and
their reported results treated as a family of hypotheses
Fu et al. BMC Genetics 2014, 15(Suppl 1):S5
/>
Page 4 of 8
Figure 1 Power comparison between the Holm adjustment and standard Bonferroni adjustment under different sample size, number
of markers, and heritability (A: H2 = 0.1, B: H2 = 0.4).
only the multiple markers within each PC. After including the multiple PCs within the family of interest, we
found slightly different results, even under the previously
applied Bonferroni correction.
After applying our proposed Holm approach to provide a
comprehensive multiple correction, not only including the
multiple PCs in the correction but also including multiple
markers within each PC, the Holm correction successfully
detects all significant microsatellites that were detected by
the Bonferroni correction. Further, the Holm correction
detects one more marker, marker 10, that was not detected
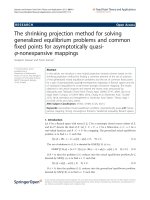
previously. Figure 2 demonstrates the bivariate plot of the
two test statistics χL2and χD2. Those points corresponding to
markers identified as significant under the Holm correction
are in black dots. Those identified significant by the standard Bonferroni correction are marked with a ×. The red
dot is the marker that is detected newly by Holm. All other
(non-significant) empirical joint test statistic points for
multiple PCs and multiple markers are plotted in gray. The
new detected marker under the Holm correction is reasonable because it has similar test statistics value for the H0L :
µ1 = µ2 = µ3 test but lower value for the H0D : D = 0 test,
as compared to its nearest significant neighboring marker.
It is well known that the critical threshold for the linkage
tests are mostly somewhere around 10. Even if 1,000 multiple tests are considered, i.e., a significance level of 0.05/
1000, the critical threshold of c2 is at most 16.44. In this
real shape data, the total number of tests that we performed is only 48 (16 markers and 3 PCs total) corresponding to the threshold of 10.752. Therefore, it is
reasonable to call a marker significant with a test statistic
2 . Those points corresponding to markers identified as significant under the Holm
Figure 2 Bivariate plot of the two test statistics χL2 and χD
correction are in black dots. Those identified significant by the standard Bonferroni correction are marked with an ×. The red dot is the marker
that is newly detected by the Holm correction. All other (non-significant) empirical joint test statistic points for multiple PCs and multiple
markers are plotted in gray.
Fu et al. BMC Genetics 2014, 15(Suppl 1):S5
/>
value of 25 for H0D and a value for H0L is not lower than
its nearest significant neighboring marker.
Figure 3 illustrates the genotypic shape effects
according to the different genotypes (AA, Aa, aa) of
the QTL identified by marker 10 on PC 3. It is evident
that the effect of aa produces shorter leaf tips and
more degrees of deltoidness at leaf base compare to
the other genotypes. The effect of AA and Aa are very
similar, which indicates a dominance effect. Although
significant genotype differences can be observed
visually, it is nevertheless not detected under the Bonferroni correction. This confirms the practical relevence of the increased sensitivity of the Holm correction
over the Bonferroni. Figure 4 illustrates the RCC curves
of leaf shape as a function of radial angle θ explained
by the different genotypes (AA, Aa, aa) of the QTL identified by marker 10 on PC 3. It is evident that the RCC
curve of aa has a higher peak when θ is close to π/2 but
a lower dynamic pattern when θ is close to 3π/2, which
matches the interpretations of above Figure 3 visualized
from the leaf image domain. We believe that the
Figure 3 The genotypic shape effects according to the
different genotypes (AA, Aa, aa) of the QTL identified by
marker 10 on PC 3. This shows the increased sensitivity of the
Holm approach as the effect of the aa QTL genotype is noticeably
different from that of genotypes AA and Aa, but nevertheless,
corresponds to information which was not detected under the
Bonferroni correction.
Page 5 of 8
Figure 4 RCC curves of leaf shape as a function of radial angle
θ explained by the different genotypes (AA, Aa, aa) of the QTL
identified by marker 10 on PC 3. This shows the increased
sensitivity of the Holm approach as the effect of the aa QTL
genotype is noticeably different from that of genotypes AA and Aa,
but nevertheless, corresponds to information which was not
detected under the Bonferroni correction.
advantages of our proposed approach will be more
remarkable for a larger number of markers.
Conclusion
Detecting significant genes that affect complex traits such
as shape or disease through LD based QTL mapping has
been popular in many disciplines [1-5,26-33]. The new
genotyping techniques make it possible to simultaneously
consider tens of thousands of markers, bringing substantial challenges for multiple testing. In addition, high
dimensional shape traits, often involving multiple PC components, have been widely used and add yet another
demand for a powerful and computationally efficient
approach to adjust for multiple tests [5,8,9].
These multiple tests require an adjustment on the
resulting p-values in order to preserve control of the
family-wise error rate (FWER) at a pre-specified level a.
Making the alpha level more stringent will create less
errors, but it may lower the chance of detecting more real
effects [7]. The FDR has been widely used as the error rate
of interest. Typically however, a subset of the significant
results are directly reported and therefore the FWER is the
more desirable form of error rate to control [22]. The current standard approach in LD based QTL mapping is to
apply a Bonferroni adjustment to correct for multiplicity
and preserve control of the FWER. As is well known, the
Bonferroni correction is overly conservative for large numbers of tests, but the advantages of simplicity without independence assumptions on the corresponding family of
tests continue to make it popular. Permutation, although
has been the gold standard for assessing significance levels
in studies with multiple markers, is extremely time consuming, computationally intensive, and may not work well
if the population has family structure [6,11-13].
Fu et al. BMC Genetics 2014, 15(Suppl 1):S5
/>
Page 6 of 8
In this article, we propose an uniformly more powerful multiple correction approach by integrating Holm
[16] with the IUT test, which is assured strong control
of the FWER under arbitrary dependencies among the
test statistics. The advantage of Holm over Bonferroni
actually has been recognized to statisticians for over
35 years [16,18-20] but is new to LD based QTL mapping. The significance of the power advantage of the
Holm correction over the Bonferroni, has been established theoretically [16]. This work demonstrates the
power advantage in LD based QTL mapping empirically
through both simulation study and real data. As long as
the sample size is reasonablly large in comparison to the
variance to guarantee a decent power, the improvement
of the Holm correction over the Bonferroni is consistent
and meaningful.
Methods
LD based QTL model
To map the rough location of the QTL regulating shape,
we apply the mixture model of [5]. Under this model,
QTL mapping is accomplished by statistically modeling
the genotypic variation through not only the association
between phenotype and the putative QTL, but also the
LD between the putative QTL and marker. Since the
marker genotype is observable, the probabilities of a
putative QTL genotype can be inferred by the conditional
probability of QTL genotype (A) given the marker genotype (M), as long as there exists LD between the marker
and putative QTL [5].
The mixture model of [5] assumes each individual’s
phenotype Yi, i = 1, . . . , n, is a random variate from
density fl(Yi|θl), where l ∈ {1, 2, 3} denote three distinct
QTL genotypes. Each QTL genotype is assumed to
induce a separate distribution of phenotypes. Typically,
normal distributions are assumed for each fl(Yi|θl) with
θl = (µl, s). From these assumptions, the corresponding
likelihood is expressed as [5]
n
3
L(ω, μ, σ —Y, M) =
ωl —i fl (Yi —μl , σ )
(2)
i=1 i=1
where ωl|i is the conditional probability of individual I
having QTL genotype l given their marker genotypes, µl
is the phenotypic mean for QTL genotype l, s is the
common variance for all genotypes, and fl(Yi|µl, s) is
the probability density of observations for individual I at
QTL genotype l [5,25,34].
The probability of the marker’s major allele (M) is
denoted by p, and correspondingly 1 − p for the minor
allele (m). Similarly, the probability of the QTL’s major
allele (A) is denoted by q, and correspondingly 1−q for the
minor allele (a). Together, the marker and QTL form four
haplotypes (MA, Ma, mA, and ma) with corresponding
frequencies p11 = pq+D, p10 = p(1−q)−D, p01 = (1−p)q −D,
and p00 = (1−p)(1−q)+D, respectively. Here, D is the linkage disequilibrium between marker and QTL. The conditional probabilities ωl|i of the QTL’s various genotypes
(AA, Aa, and aa) can be calculated upon the observed
marker genotypes (MM, Mm, and mm) from the joint
probabilities in Table 2[25,5]. The EM algorithm is then
applied to the likelihood in (2) to obtain maximum likelihood estimates for all parameters [5,25].
Two hypothesis tests
Through the likelihood in (2), the hypotheses
H0L : μ1 = μ2 = μ3
vs
(3)
H1L : one of the equalities above does not hold can be
used to test if the QTL is significantly associated with
phenotype Y (i.e. existence of QTL). Since all the
unknown parameters in (2) were estimated by maximum
likelihood estimates (MLEs), a log likelihood ratio statistic can be used to test the hypotheses in (3) [5]. The
resulting test statistic (χL2) is asymptotically distributed
as a χ22 under H0L for large enough samples.
On the other hand, linkage disequilibrium, denoted by
D, between the marker and QTL can be tested by
means of the hypotheses
H0D : D = 0
vs
H1D : D = 0.
(4)
The test statistic used to judge whether or not the
QTL is significantly associated with marker is [5,35]:
χD2∗ =
ˆ2
nD
pˆ (1 − pˆ )qˆ (1 − qˆ )
= nˆr 2 .
(5)
(6)
Here, rˆ2 is the square of the correlation coefficient
between the marker and QTL that has been used in
most of the related literature, which has many good
sampling properties [36,37]. Under H0D, χD2 is asymptotically distributed as χ12, from which the tail probability
(p-value) of the observed level of association can be
determined [3,23,35,38].
In general, the Intersection-Union test (IUT) is
defined as [39]
H0 : θ ∈ ∪γ ∈
γ.
Here Γ is a finite or infinite set containing index of tests,
θ is the unknown parameters under testing, and Θg specifies the statement of null hypothesis test for each index g.
Suppose that for each g ∈ Γ, {x : Tg (x) ∈ Rg} is the rejection
region for each test H0γ : θ ∈ γ versus H1γ : θ ∈ cγ .
Then the rejection region for the IUT test is
Fu et al. BMC Genetics 2014, 15(Suppl 1):S5
/>
Page 7 of 8
∩γ ∈ {x : Tγ (x) ∈ Rγ }.
In the context of LD based QTL mapping, the tests of
the above hypotheses (3) and (4) must be performed
simultaneously to make the final conclusion, i.e., a significant QTL regulating shape is not detected unless
both null hypotheses in (3) and (4) are rejected. H0D :
D = 0 is used to test the LD between QTL and marker,
and H0L : μ1 = μ2 = μ3 is used to test the association
between the phenotype and QTL, respectively. Thus, the
IUT test with intersection rejection region but union
null regions is appropriate for these two tests of each
marker, resulting in a final set of m IUT p-values, where
m is the number of markers tested. Then we integrate
Holm into the IUT and perform multiplicity adjustment
to these m IUT p-values, in place of the original Bonferroni correction that has been the current standard [5].
The Holm correction
The Holm multiplicity correction [16] applies a “sequentially rejective Bonferroni test” to all currently nonrejected hypothesis in a step-down manner. The first
step of our proposed approach is to use an IUT to
obtain m p-values. Then, we order the tests from the
one with the smallest p-value to the one with the largest
p-value as p(1), . . . , p(m) according to the usual order
statistics notation. The smallest p-value, p (1) , corresponding to the ordered hypothesis H(1), is then tested
with the usual Bonferroni correction of a 1 = a/m. If
H(1) is declared significant, then the method continues
by testing p(2) against a2 = a/(m − 1). So long as rejections continue to occur, p(i) is compared to ai = a/(m −
i + 1) until finally p (m) is compared to a m = a. If for
any i ∈ {1, 2, . . . , m} the hypothesis H(i) is not rejected,
then the method stops and H(i), . . . , H(m) are retained,
i.e., not rejected. Therefore, the procedure stops when
the first non-significant test is obtained or when all the
tests have been performed.
To be exact, let p(1), . . . , p(m), denote the ordered pvalues corresponding to the ordered m hypotheses
obtained from IUTs, H (1) , . . . , H (m) . The ordered pvalues for the test of H(j) are then compared to the
thresholds aj where
p(j) ≤ αj = α/(m − j + 1),
(7)
and all testings will stop at the jth test for which the
first non-rejection occurs, i.e., the j for which p(j) > aj.
Because the denominators are m − j + 1 instead of m,
Holm’s procedure never rejects fewer hypotheses than
the Bonferroni procedure does.
A multiple test procedure for testing hypotheses H1, . . . ,
H m is said to have multiple level of significance a (for
free combinations) if for any non-empty index set I ⊆
{1, 2, 3, . . . , m} the supremum of the probability P(∪Aci )
when Hi are true for all i ∈ I is less than or equal to a
where Aci denotes the event of rejecting Hi. This is called
strong control of the FWER. A method that only controls
the FWER under the assumption that all nulls are true has
weak control of the FWER.
Importantly, as proved in [16], strong control of the
FWER is ensured under the Holm adjustment, no matter the dependency structure of the corresponding test
statistics. A simple, but elegant proof of the strong
FWER control of this approach, under arbitrary dependence structures of the test statistics, is given in [16].
The idea behind the proof is as follows. Let I denote
the set of indices corresponding to the true null
hypotheses, and let k denote the number of hypotheses
in I, so that k ≤ m. The well known Boole’s Inequality
shows that the FWER (the probability of at least one
type I error) is controlled by the Bonferroni method so
long as at most a/k is applied to the testing of all k
true nulls. Specifically,
P(pi ≤ α/k, for some i ∈ I)
≤
P(pi ≤ α/k) ≤ kα/k = α.
(8)
i∈I
Given the nature of the sequential testing of the Holm
adjustment, at any stage j of testing, the number of true
nulls remaining to be tested (k) will always be less than
or equal to the number of hypotheses remaining to be
tested (m−j+1). Hence, any true null will always be
tested by at least a/(m − j + 1) ≤ a/k, ensuring strong
control of the FWER no matter how many or which
nulls are true.
Just as with the Bonferroni method, Holm’s method is
a distribution free approach to the multiple hypothesis
testing issue. More importantly it is uniformly more
powerful than the Bonferroni method as it will compare
P(2), . . . , P(m) to larger thresholds ai, i = 2, . . . , m than
will the Bonferroni method. Therefore, it is clear that
the Holm method should always be preferred over the
Bonferroni method from a theoretical perspective. In
the following sections, we will illustrate the benefit of
Holm over Bonferroni from an application perspective.
Additional material
Additional file 1: Additional file 1 includes a single table showing the
results of the power simulation as depicted in Figure 1.
Competing interests
The authors declare that they have no competing interests.
Authors’ contributions
GF initiated the project, supervised the main ideas, closely guided several
details, provided the estimation programming, wrote and revised the
Fu et al. BMC Genetics 2014, 15(Suppl 1):S5
/>
manuscript. GS participated in the development of the Holm method, made
programs for multiple testing, performed data analysis, and drafted the
manuscript. JS involved in idea development discussions, checked the
validation of the method, and revised the manuscript.
Acknowledgements
This work was supported by a Utah State University VPR Research Catalyst
Grant. Publication costs for this article were funded by the corresponding
author’s institution.
This article has been published as part of BMC Genetics Volume 15
Supplement 1, 2014: Selected articles from the International Symposium on
Quantitative Genetics and Genomics of Woody Plants. The full contents of
the supplement are available online at />bmcgenet/supplements/15/S1.
Published: 20 June 2014
References
1. Sachidanandam R, Weissman D, Schmidt SC, Kakol JM, Stein LD, Marth G,
Sherry S, Mullikin JC, Mortimore BJ, Willey DL, Hunt SE, Col CG, Coggill PC,
Rice CM, Ning Z, Rogers J, Bentley DR, Kwok PY, Mardis ER, Yeh RT,
Schultz B, Cook L, Davenport R, Dante M, Fulton L, Hillier L, Waterston RH,
McPherson JD, Gilman B, Schaffner S, Van Etten WJ, Reich D, Higgins J,
Daly MJ, Blumenstiel B, Baldwin J, Stange-Thomann N, Zody MC, Linton L,
Lander ES, Altshuler D: A map of human genome sequence variation
containing 1.42 million single nucleotide polymorphisms. Nature 2001,
409:928-933.
2. Ardlie KG, Kruglyak L, Seielstad M: Patterns of linkage disequilibrium in
the human genome. Nat Rev Genet 2002, 3:299-309.
3. Weiss KM, Clark AG: Linkage disequilibrium and the mapping of complex
human traits. Trends Genet 2002, 18:19-24.
4. Wang L, Luzynski K, Pool JE, Janoušek V, Dufkov´a P, Vyskočilov´a MM,
Teeter KC, Nachman MW, Munclinger P, Machol´an M, Pi´alek J, Tucker PK:
Measures of linkage disequilibrium among neighbouring SNPs indicate
asymmetries across the house mouse hybrid zone. Mol Ecol 2011,
20:2885-3000.
5. Fu G, Bo W, Pang X, Wang Z, Chen L, et al: Mapping shape QTLs using a
radius-centroid-contour model. Heredity 2013, 110:511-519.
6. Nicodemus KK, Liu W, Chase GA, Tsai YY, Fallin MD: Comparison of type I
error for multiple test corrections in large single-nucleotide
polymorphism studies using principal components versus haplotype
blocking algorithms. BMC genetics 2005, 6(Suppl 1):S78.
7. Abdi H: Holm’s sequential bonferroni procedure. Encyclopedia of research
design 2010, 1-8.
8. Langlade NB, Feng XZ, Dransfield T, Copsey L, Hanna AI, Thebaud C,
Bangham A, Hudson A, Coen E: Evolution through genetically controlled
allometry space. P Natl Acad Sci USA 2005, 102:10221-10226.
9. Drake AG, Klingenberg CP: Large-scale diversification of skull shape in
domestic dogs: Disparity and modularity. Am Nat 2010, 175:289-301.
10. Nakagawa S: A farewell to bonferroni: the problems of low statistical
power and publication bias. Behav Ecol 2004, 15:1044-1045.
11. Gao X, Starmer J, Martin ER: A multiple testing correction method for
genetic association studies using correlated single nucleotide
polymorphisms. Genet Epidemiol 2008, 32:361-369.
12. Han B, Kang HM, Eskin E: Rapid and accurate multiple testing correction
and power estimation for millions of correlated snps. PLoS Genet 2009,
5(4):e1000456, doi:10.1371/journal.pgen.1000456.
13. Doerge RW: Mapping and analysis of quantitative trait loci in
experimental populations. Nat Rev Genet 2002, 3:43-52.
14. Nyholt DR: A simple correction for multiple testing for single-nucleotide
polymorphisms in linkage disequilibrium with each other. Am J Hum
Genet 2004, 74:765-769.
15. Johnson R, Nelson GW, Troyer JL, Lautenberger JA, Kessing BD, Winkler CA,
O’Brien SJ: Accounting for multiple comparisons in a genome-wide
association study (gwas). BMC Genomics 2010, 11:724.
16. Holm S: A simple sequentially rejective multiple test procedure. Scand J
Statist 1979, 6:65-70.
17. Berger RL: Mltiparameter hypothesis testing and acceptance sampling.
Technometrics 1982, 24:295-300.
18. Goeman JJ, Mansmann U: Multiple testing on the directed acyclic graph
of gene ontology. Bioinformatics 2008, 24:537-544.
Page 8 of 8
19. Aickin M, Gensler H: Adjusting for multiple testing when reporting
research results: the Bonferroni vs Holm methods. American Journal of
Public Health 1996, 86(5):726-728.
20. Simes RJ: An improved Bonferroni procedure for multiple tests of
significance. Biometrika 1986, 73(3):751-754.
21. Benjamini Y, Hochberg Y: Controlling the false discovery rate: a practical
and powerful approach to multiple testing. J R Stat Soc Series B 1995,
57:298-300.
22. Goeman JJ, Solari A: Tutorial in biostatistics: multiple hypothesis testing
in genomics. Statist Med 2014, DOI: 10.1002/sim.6082.
23. Lou X, Casella G, Littell RC, Yang MCK, Johnson JA, Wu R: A haplotypebased algorithm for multilocus linkage disequilibrium mapping of
quantitative trait loci with epistasis. Genetics 2003, 4:1533-1548.
24. Das K, Wu R: A statistical model for the identification of genes governing
the incidence of cancer with age. Theor Biol Med Mod 2008, 5(7).
25. Wang Z, Wu R: A statistical model for high-resolution mapping of
quantitative trait loci determining HIV dynamics. Statist Med 2004,
23:3033-3051.
26. Terwilliger JD, Weiss KM: Linkage disequilibrium mapping of complex
disease: Fantasy or reality? Curr. Opin Biotechnol 1998, 9:578-594.
27. Service SK, Lang TDW, Freimer NB, Sandkuijl LA: Linkage-disequilibrium
mapping of disease genes by reconstruction of ancestral haplotypes in
founder populations. Am J Hum Genet 1999, 64:1728-1738.
28. Martin ER, Lai EH, Gilbert JR, Rogala AR, Afshari AJ, Riley J, Finch KL,
Stevens JF, Livak KJ, Slotterbeck BD, Slifer SH, Warren LL, Conneally PM,
Schmechel DE, Purvis I, Pericak-Vance MA, Roses AD, Vance JM: SNPing
away at complex diseases: Analysis of single-nucleotide polymorphisms
around APOE in alzheimer disease. Am J Hum Genet 2000, 67:383-394.
29. Goldstein D, Weale M: Linkage disequilibrium holds the key. Curr Biol
2001, 11:576-579.
30. Reich D, Cargill M, Bolk S, Ireland J, Sabeti PC, Richter DJ, Lavery T,
Kouyoumjian R, Farhadian SF, Ward R, Lander ES: Linkage disequilibrium in
the human genome. Nature 2001, 411:199-204.
31. Dawson E, Abecasis GR, Bumpstead S, Chen Y, Hunt S, Beare DM, Pabial J,
Dibling T, Tinsley E, Kirby S, Carter D, Papaspyridonos M, Livingstone S,
Ganske R, Lõhmussaar E, Zernant J, Tõnisson N, Remm M, Magi R,
Puurand T, Vilo J, Kurg A, Rice K, Deloukas P, Mott R, Metspalu A,
Bentley DR, Cardon LR, Dunham I: A first-generation linkage
disequilibrium map of human chromosome 22. Nature 2002, 418:544-548.
32. Morris RW, Kaplan NL: On the advantage of haplotype analysis in the
presence of multiple disease susceptibility alleles. Genet Epidemiol 2002,
23:221-233.
33. Skipper L, Wilkes K, Toft M, Baker M, Lincoln S, Hulihan M, Ross OA,
Hutton M, Aasly J, Farrer M: Linkage disequilibrium and association of
mapt h1 in parkinson disease. Am J Hum Genet 2004, 75:669-677.
34. Fu G, Berg A, Das K, Li J, Li R, et al: A statistical model for mapping
morphological shape. Thoer Biol Med Model 2010, 7(28).
35. Brown AHD: Sample size required to detect linkage disequilibrium
between two or three loci. Theor Popul Biol 1975, 8:184-201.
36. Hedrick PW: Gametic disequilibrium measures: Proceed with caution.
Genetics 1987, 2:331-341.
37. Pritchard JK, Przeworski M: Linkage disequilibrium in humans: Models and
data. Am J Hum Genet 2001, 69:1-14.
38. Mueller JC: Linkage disequilibrium for different scales and applications.
Brief Bioinform 2004, 5:355-364.
39. Berger RL: Likelihood ratio tests and intersection-union tests. Advances in
statistical decision theory and applications 1997, 225-237.
doi:10.1186/1471-2156-15-S1-S5
Cite this article as: Fu et al.: Holm multiple correction for large-scale
gene-shape association mapping. BMC Genetics 2014 15(Suppl 1):S5.