Genetic diversity is a predictor of mortality in humans
Bạn đang xem bản rút gọn của tài liệu. Xem và tải ngay bản đầy đủ của tài liệu tại đây (886.36 KB, 7 trang )
Bihlmeyer et al. BMC Genetics (2014) 15:159
DOI 10.1186/s12863-014-0159-7
RESEARCH ARTICLE
Open Access
Genetic diversity is a predictor of mortality in
humans
Nathan A Bihlmeyer1,2, Jennifer A Brody35, Albert Vernon Smith32,33, Kathryn L Lunetta9,10, Mike Nalls6,
Jennifer A Smith14, Toshiko Tanaka36, Gail Davies15,16, Lei Yu18, Saira Saeed Mirza21, Alexander Teumer27,28,
Josef Coresh38, James S Pankow39, Nora Franceschini40, Anish Scaria3, Junko Oshima4, Bruce M Psaty5,
Vilmundur Gudnason32,33, Gudny Eiriksdottir32, Tamara B Harris34, Hanyue Li9, David Karasik12, Douglas P Kiel12,
Melissa Garcia7, Yongmei Liu8, Jessica D Faul13, Sharon LR Kardia14, Wei Zhao14, Luigi Ferrucci36,
Michael Allerhand15, David C Liewald15, Paul Redmond16, John M Starr15,17, Philip L De Jager19, Denis A Evans20,
Nese Direk21, Mohammed Arfan Ikram21,22,23, André Uitterlinden21,26, Georg Homuth27, Roberto Lorbeer28,
Hans J Grabe29,30, Lenore Launer34, Joanne M Murabito10,11, Andrew B Singleton6, David R Weir13,
Stefania Bandinelli37, Ian J Deary15,16, David A Bennett18, Henning Tiemeier21,24,25, Thomas Kocher31,
Thomas Lumley3* and Dan E Arking2*
Abstract
Background: It has been well-established, both by population genetics theory and direct observation in many
organisms, that increased genetic diversity provides a survival advantage. However, given the limitations of both
sample size and genome-wide metrics, this hypothesis has not been comprehensively tested in human populations.
Moreover, the presence of numerous segregating small effect alleles that influence traits that directly impact health
directly raises the question as to whether global measures of genomic variation are themselves associated with
human health and disease.
Results: We performed a meta-analysis of 17 cohorts followed prospectively, with a combined sample size
of 46,716 individuals, including a total of 15,234 deaths. We find a significant association between increased
heterozygosity and survival (P = 0.03). We estimate that within a single population, every standard deviation of
heterozygosity an individual has over the mean decreases that person’s risk of death by 1.57%.
Conclusions: This effect was consistent between European and African ancestry cohorts, men and women, and
major causes of death (cancer and cardiovascular disease), demonstrating the broad positive impact of genomic
diversity on human survival.
Keywords: Heterozygosity, Human, Survival, GWAS
* Correspondence: ;
3
Department of Statistics, University of Auckland, 303.325 Science Centre,
Private Bag 92019, Auckland 1142, New Zealand
2
McKusick-Nathans Institute of Genetic Medicine, Johns Hopkins University
School of Medicine, BRB Room 447, 733 N. Broadway St, Baltimore, MD
21205, USA
Full list of author information is available at the end of the article
© 2014 Bihlmeyer et al.; licensee Biomed Central. This is an Open Access article distributed under the terms of the Creative
Commons Attribution License ( which permits unrestricted use, distribution, and
reproduction in any medium, provided the original work is properly credited. The Creative Commons Public Domain
Dedication waiver ( applies to the data made available in this article,
unless otherwise stated.
Bihlmeyer et al. BMC Genetics (2014) 15:159
Background
With the advent of genome-wide association studies
(GWAS), and more recently whole-exome and wholegenome sequencing, remarkable progress has been made
in elucidating the genetics of complex traits, with numerous genetic variants each explaining a small fraction of the
variance [1,2]. The presence of numerous segregating small
effect alleles within the genome that influence traits that
directly impact health raises the question of whether global
measures of genomic variation are themselves associated
with human health and disease. Indeed, increased fitness
has been associated with the increase of genetic diversity
across many organisms [3,4], including humans [5-8], and
is often referred to as positive Heterozygosity Fitness
Correlations (HFCs). In particular, associations have been
found between heterozygosity at the Major Histocompatibility Complex (MHC) (a.k.a. Human Leukocyte Antigen,
HLA) region and general health in humans [9]. In the case
of heterozygosity in the MHC region, the cause of a positive HFC being observed is believed to be the result of
increased antibody diversity conveying robust pathogen
resistance and therefore increased general health [10].
However, in the case of increased whole-genome heterozygosity, the mechanism of action is less readily apparent.
Two general mechanisms that act at a genome level to influence fitness have been proposed. The first is compensation for recessive deleterious mutations [11], whereas the
second is a specific advantage of the heterozygous state
over either homozygous state (overdominance/heterozygous advantage) [11], such as that observed for the sickle
cell mutation in the presence of endemic malarial disease.
It has been proposed that compensation for deleterious
mutations occurs at many loci and is the major mechanism
at work in HFCs, with overdominance occurring at few loci
but with greater effect size per occurrence [11].
Results and discussion
Various heterozygosity metrics have been proposed
[12]. The heterozygosity metric used in this study is the
sum of all heterozygous loci divided by the expected
state given the allele frequency under Hardy-Weinberg
P
Equilibrium t ẳ P2p0;1
1pị : where p is the frequency of
the major allele in each cohort. This metric up-weights
loci where the expectation of being heterozygous is low.
Given the relationship between effect size and allele frequency [13,14], up-weighting loci with low minor allele
frequencies should maximize the ability to detect a HFC
in humans under a model in which the compensation for
deleterious alleles is the major mechanism driving HFCs.
Only Single Nucleotide Polymorphisms (SNPs) on the autosomes were considered.
Page 2 of 7
To test for the effect of genome-wide heterozygosity
on survival, we performed a meta-analysis of 17 cohorts
(13 European ancestry, 4 African American ancestry)
followed prospectively, with a combined sample size of
46,716 individuals, including a total of 15,234 deaths
(Additional file 1: Table S1). Within each cohort, a Cox
proportional hazards model (CoxPH) was used comparing age at study entry to age at study exit (death) or
most recent follow-up (alive), and included covariates
known to affect survival (sex, highest education level,
Body Mass Index (BMI), income level, center where DNA
was collected, and the first ten principal components to
adjust for population substructure). Since each cohort
used a different number of SNPs (Additional file 1: Table
S1), the variances of the heterozygosity metrics are not the
same (they are dependent on the total number of SNPs in
the metric), and effect sizes from each cohort are not directly comparable. Using Stouffer's method to combine Zscores, weighted by the number of deaths in each cohort,
we find a significant association between increased heterozygosity and survival (P = 0.03). To assess effect size, we
standardized the beta estimates by multiplying them by
the standard deviation of the heterozygosity metric for
each cohort [15]. This method does not completely account for the aforementioned bias; however, it is the most
appropriate method to determine an interpretable effect
size. Combining the standardized beta estimates using inverse variance weighting demonstrates that for every
standard deviation increase in heterozygosity a person has
over the population mean, they are expected to have a
1.57% decreased risk of death (Figure 1). There was no
evidence for heterogeneity across studies, and a direct
comparison of European Ancestry to African ancestry cohorts showed no significant difference (Figure 2, P = 0.80);
thus, all downstream analyses combined European and
African ancestry cohorts.
To test whether all chromosomes are contributing
equally to the association between heterozygosity and survival, each study subject’s heterozygosity score was recalculated using only SNPs from a given chromosome. An
inverse-variance meta-analysis for each chromosome was
performed across studies, followed by a meta-analysis of
the chromosomal results (Figure 3). No significant difference was observed between effects across chromosomes
(P = 0.17). To test whether all major causes of death contribute equally to our genome-wide finding, death caused
by cancer, death caused by CVD, and other causes of
death were each analyzed separately. A meta-analysis for
each cause of death was performed as described above,
followed by a test for heterogeneity and model fitting. Our
results demonstrate that heterozygosity is protective for
all causes of death, with no significant evidence for heterogeneity (Figure 4, P = 0.79). To assess if heterozygosity
levels impact women differently from men, meta-analyses
Bihlmeyer et al. BMC Genetics (2014) 15:159
Page 3 of 7
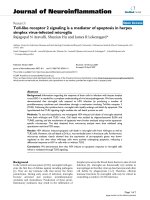
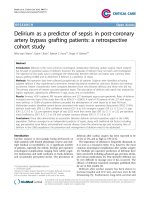
Figure 1 Heterozygosity meta-analysis by study. 1.57% decreased risk of death for every standard deviation increase in heterozygosity. This
is determined using an inverse variance weighted fixed effect model. Significance of P = 0.03 is determined using Stouffer's method to combine
Z-scores due to bias in inverse variance weighted fixed effect model. There are 46,716 individuals, including a total of 15,234 deaths. EA =
European Ancestry; AA = African Ancestry; AGES = Age, Gene/Environment Susceptibility cohort; ARIC = Atherosclerosis Risk In Communities
cohort; CHS = Cardiovascular Health Study; FHS = Framingham Heart Study; HealthABC = HealthABC cohort; HRS = Health and Retirement Study;
INCHINTI = InCHIANTI cohort; LBC1921 = 1921 Lothian Birth Cohort; LBC1936 = 1936 Lothian Birth Cohort; MAP = Rush Memory and Aging Project
cohort; ROS = Religious Orders Study; Rotterdam = Rotterdam Study; SHIP = Study of Health In Pomerania cohort; SE = Standard Error; HR = Hazard
Ratio; CI = Confidence Interval; W = Weight; N = Number.
were performed separately for each sex. Our results do
not provide evidence for a differential effect of heterozygosity on survival in men vs. women (Figure 5, P = 0.49).
Conclusions
In summary, this study provides evidence that the protective effect of increased heterozygosity seen in lower
organisms functions in humans as well and may have
implications for how we design future studies to identify
genetic determinants of human disease and survival. We
estimate that within a single population, every standard
deviation of heterozygosity an individual has over the
mean decreases that person’s risk of death by 1.57%.
Interestingly, this seems to be true even if the population
itself has reduced mean heterozygosity. In future studies,
limiting to heterozygosity in proximity to genes and/or
regulatory elements may reveal if some regions are more
sensitive to heterozygosity than others. Increasing the
African ancestry sample size may increase power to see
a difference between ancestry groups. Overall the
consistency we observed between European and African
ancestry, males and females, and major causes of death
demonstrate a broad positive impact of genomic diversity on human survival.
Methods
Methods for each individual cohort can be found in
Additional file 2: Text S1. Self-described Caucasian
(“white”, “Caucasian”) and African ancestry (“black”,
“African American”) individuals were included after excluding first and second degree relatives and genetic outliers.
Genetic outliers were defined by merging genotyping data
with HapMap3 data, and calculating the Euclidean distance from a combined reference HapMap3 population
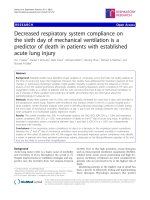
Figure 2 Ancestry meta-analysis. Direct comparison of European Ancestry to African ancestry cohorts showed no significant difference (P = 0.80).
Figure is formatted the same as Figure 1.
Bihlmeyer et al. BMC Genetics (2014) 15:159
Page 4 of 7
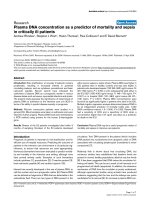
Figure 3 Chromosome meta-analysis. A meta-analysis for each chromosome was performed across studies. No significant difference was
observed between effects across chromosomes (P = 0.17). Figure is formatted the same as Figure 1.
(Caucasian = CEU + TSI, African ancestry = ASW + YRI +
MKK + LWK) cluster centroid in the first 3 PC space
weighted by explained variance. Specifically, the standard deviation of Euclidean distance was determined for
each HapMap reference group, and any sample greater
than ten standard deviations away from centroid were
defined as genetic outliers and excluded.
Directly genotyped SNPs were used for all analyses
(Additional file 3: Figure S1). Imputed SNPs were not used
to avoid issues with genotype accuracy and bias towards
the reference panel. SNP exclusion criteria included:
monomorphic in the dataset, non-unique mapping to
Hg19, SNPs which are no longer in the company provided
annotation file for the SNP array, >0.5% missing data,
MAF ≤ 10%, HWE p-value ≥ 0.001, and non-autosomal
SNPs. The heterozygosity metric is the sum of all heterozygous loci divided by the expected state given the
allele P
frequency under Hardy-Weinberg Equilibrium:
t ẳ P2p0;1
1pị where p is the frequency of the major allele.
Separate association analyses were run for Caucasian and
African ancestry samples from each cohort. The Cox Proportional Hazard Model (CoxPH) included covariates for
Body Mass Index (BMI) at first visit and first ten principal
components, and the 'strata' function for sex, education
level (defined as 1. ≤11th grade, 2. high school diploma,
general equivalence diploma or some vocational school,
3. 1–4 years of college, 4. Some graduate/professional
school, and Missing), income level (defined by cohorts),
and center of DNA collection within cohorts. The CoxPH
model was set up so that the outcome was age at study
entry, age at study exit, and a binary variable coding
state of death (1: Dead, 0: Alive). Age is measured in
units of years, but is accurate to the nearest day.
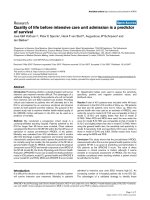
Figure 4 Causes of death meta-analysis. A meta-analysis for each cause of death was performed. Our results show no significant evidence for
heterogeneity (Figure 4, P = 0.79). Figure is formatted the same as Figure 1.
Bihlmeyer et al. BMC Genetics (2014) 15:159
Page 5 of 7
Figure 5 Sex meta-analysis. A meta-analysis was performed separately for each sex. Our results do not provide evidence for a differential effect
of heterozygosity on survival in men vs. women (Figure 5, P = 0.49). Figure is formatted the same as Figure 1.
For the meta-analysis, significance was determined by
Stouffer's method [16] calculated as a two-sided test by
incorporating Z-scores derived from two-sided tests performed in each cohort. We standardized the beta estimates by multiplying them by the standard deviation of
the heterozygosity metric for each cohort, to account for
the fact that the effect size is proportional to the variance in the heterozygosity metric. The variance heterozygosity metric in turn is proportional to the inverse of
the square root of the number of SNPs used to determine
the heterozygosity metric. Because most cohorts used different genotyping arrays, a large bias is introduced into
the meta-analysis. Stouffer’s method completely removes
this bias; however, cannot estimate a combined effect size,
only the overall significance. To get an estimate of the
combined effect size (recognizing that the P-value and associated confidence intervals will be inflated), we used inverse variance weighting of the standardized cohort effect
sizes, which partially corrects the bias and allows for the
combined effect size to be estimated.
Ethics statements
Institutional Review Board approvals were obtained by
each participating ARIC study center (the Universities of
NC, MS, MN, and John Hopkins University) and the coordinating center (University of NC), and the research
was conducted in accordance with the principles
described in the Helsinki Declaration. All subjects in
the ARIC study gave informed consent. For more information see dbGaP Study Accession: phs000280.v2.p1.
JHSPH IRB number H.34.99.07.02.A1. Manuscript proposal number MS1964.
HealthABC Human subjects protocol UCSF IRB is
H5254-12688-11.
CHS was approved by institutional review committees
at each site, the subjects gave informed consent, and those
included in the present analysis consented to the use of
their genetic information for the study of cardiovascular
disease. It is the position of the UW IRB that these studies
of de-identified data, with no patient contact, do not constitute human subjects research. Therefore we have neither an approval number, nor an exemption.
IRB permission to conduct genetics-related work in the
Health and Retirement Study (HRS) is granted under the
project title, "Expanding a National Resource for Genetic
Research in Behavioral & Health Science" (HUM00063444).
The IRB that approved this project is the Health Sciences
and Behavioral Sciences Institutional Review Board at the
University of Michigan. No manuscript proposal is required
for use of HRS data.
Inchianti ethics review statement: The study protocol
was approved by the Italian National Institute of Research
and Care of Aging Institutional Review and Medstar
Research Institute (Baltimore, MD).
The Religious Orders Study (ORA# 91020181) and the
Rush Memory and Aging Project (ORA# 86121802)
were approved by the Institutional Review Board of Rush
University Medical Center. Written informed consent was
obtained from all the participants.
The SHIP study followed the recommendations of the
Declaration of Helsinki. The study protocol of SHIP was
approved by the medical ethics committee of the University of Greifswald. Written informed consent was obtained
from each of the study participants. The SHIP study is described in PMID: 20167617.
The Rotterdam Study has been approved by the medical ethics committee according to the Population Study
Act Rotterdam Study, executed by the Ministry of
Health, Welfare and Sports of the Netherlands. A written informed consent was obtained from all participants.
The Boston University Medical Campus Institutional
Review Board approved the FHS genome-wide genotyping (protocol number H-226671) and genetic investigation of aging and longevity phenotypes (protocol
number H-24912).
The Age, Gene/Environment Susceptibility Reykjavik
Study has been funded by NIH contract N01-AG-12100,
the NIA Intramural Research Program, Hjartavernd
(the Icelandic Heart Association), and the Althingi (the
Icelandic Parliament). The study is approved by the
Icelandic National Bioethics Committee, (VSN: 00–
063) and the Data Protection Authority. The researchers
are indebted to the participants for their willingness to
participate in the study.
Ethics permission for the LBC studies was obtained
from the Multi-Centre Research Ethics Committee for
Scotland (MREC/01/0/56) and from Lothian Research
Ethics Committee (LBC1936: LREC/2003/2/29 and LB
Bihlmeyer et al. BMC Genetics (2014) 15:159
C1921: LREC/1998/4/183). The research was carried
out in compliance with the Helsinki Declaration. All
subjects gave written, informed consent.
Additional files
Additional file 1: Table S1. Descriptive breakdown of each cohort and
summary statistics.
Additional file 2: Text S1. Additional Methods for each individual cohort.
Additional file 3: Figure S1. Heterozygosity Metrics Determined Using
Different SNP Lists. The dataset used was genome wide SNP data from
sequencing of 503 individuals with European ancestry from 1000G phase
3 release. The SNP lists used were: 1) all SNPs 2) SNPs on the Illumina 1M
3) SNPs on the Illumina 610quad 4) SNPs on the Illumina Omni2.5 and 5)
SNPs on the Affymetrix 6.0. This is to determine if SNP selection on the
arrays biases the heterozygosity metric. We see high correlation and no
systematic bias.
Competing interests
The authors declare that they have no competing interests.
Authors’ contributions
Designed Study: NAB, TL, and DEA. Ran Analyses: NAB, JAB, AVS, KLL, MN,
JAS, TT, GD, LY, SSM, AT. Contributed Data: JC, JSP, NF, AS, JO, BMP, VG, GE,
TBH, HL, DK, DPK, MG, YL, JDF, SLRK, WZ, LF, MA, DCL, PR, JMS, PLD, DAE, ND,
MAI, AU, GH, RL, HJG, LL, JMM, ABS, DRW, SB, IJD, DAB, HT, TK, TL, DEA. All
authors read and approved the final manuscript.
Acknowledgements
Funding
Funded in part by training grant (NIGMS) 5T32GM07814.
This material is based upon work supported by the National Science
Foundation Graduate Research Fellowship under Grant No. DGE-1232825.
Any opinion, findings, and conclusions or recommendations expressed in
this material are those of the authors(s) and do not necessarily reflect the
views of the National Science Foundation.
Cohorts
ARIC
The Atherosclerosis Risk in Communities Study is carried out as a collaborative
study supported by National Heart, Lung, and Blood Institute contracts
(HHSN268201100005C, HHSN268201100006C, HHSN268201100007C,
HHSN268201100008C, HHSN268201100009C, HHSN268201100010C,
HHSN268201100011C, and HHSN268201100012C), R01HL087641, R01HL59367
and R01HL086694; National Human Genome Research Institute contract
U01HG004402; and National Institutes of Health contract HHSN268200625226C.
The authors thank the staff and participants of the ARIC study for their
important contributions. Infrastructure was partly supported by Grant Number
UL1RR025005, a component of the National Institutes of Health and NIH
Roadmap for Medical Research.
AGES
The Age, Gene/Environment Susceptibility Reykjavik Study has been funded
by NIH contract N01-AG-12100, the NIA Intramural Research Program,
Hjartavernd (the Icelandic Heart Association), and the Althingi (the Icelandic
Parliament). The study is approved by the Icelandic National Bioethics
Committee, (VSN: 00–063) and the Data Protection Authority. The researchers
are indebted to the participants for their willingness to participate in the study.
CHS
Cardiovascular Health Study: This CHS research was supported by NHLBI
contracts HHSN268201200036C, HHSN268200800007C, N01HC55222,
N01HC85079, N01HC85080, N01HC85081, N01HC85082, N01HC85083,
N01HC85086; and NHLBI grants HL080295, HL087652, HL105756, HL085251
with additional contribution from the National Institute of Neurological
Disorders and Stroke (NINDS). Additional support was provided through
AG023629 from the National Institute on Aging (NIA). A full list of principal
CHS investigators and institutions can be found at CHS-NHLBI.org/.
Page 6 of 7
The provision of genotyping data was supported in part by the National
Center for Advancing Translational Sciences, CTSI grant UL1TR000124, and
the National Institute of Diabetes and Digestive and Kidney Disease Diabetes
Research Center (DRC) grant DK063491 to the Southern California Diabetes
Endocrinology Research Center.
The content is solely the responsibility of the authors and does not
necessarily represent the official views of the National Institutes of Health.
FHS
Funding: The Framingham Heart Study analyses were supported by the
National Institute of Aging (R01AG29451). This research was conducted
in part using data and resources from the Framingham Heart Study of
the National Heart Lung and Blood Institute of the National Institutes of
Health and Boston University School of Medicine. The analyses reflect
intellectual input and resource development from the Framingham Heart
Study investigators participating in the SNP Health Association Resource
(SHARe) project. This work was partially supported by the National Heart,
Lung and Blood Institute's Framingham Heart Study (Contract No. N01-HC-25195)
and its contract with Affymetrix, Inc for genotyping services (Contract No.
N02-HL-6-4278). A portion of this research utilized the Linux Cluster for
Genetic Analysis (LinGA-II) funded by the Robert Dawson Evans Endowment of
the Department of Medicine at Boston University School of Medicine and
Boston Medical Center. Dr. Kiel was partially supported by the National Institute
of Arthritis Musculoskeletal and Skin Diseases (R01 AR41398).
HealthABC
This research was supported by NIA contracts N01AG62101, N01AG62103,
and N01AG62106 and was supported in part by the Intramural Research
Program of the NIH, National Institute on Aging (Z01 AG000949-02 and Z01
AG007390-07, Human subjects protocol UCSF IRB is H5254-12688-11). The
genome-wide association study was funded by NIA grant 1R01AG03209801A1 to Wake Forest University Health Sciences and genotyping services
were provided by the Center for Inherited Disease Research (CIDR). CIDR is
fully funded through a federal contract from the National Institutes of Health
to The Johns Hopkins University, contract number HHSN268200782096C.
This study utilized the high-performance computational capabilities of the
Biowulf Linux cluster at the National Institutes of Health, Bethesda, Md.
().
HRS
HRS is supported by the National Institute on Aging (NIA U01AG009740). The
genotyping was funded separately by the National Institute on Aging (RC2
AG036495, RC4 AG039029). Our genotyping was conducted by the NIH
Center for Inherited Disease Research (CIDR) at Johns Hopkins University.
Genotyping quality control and final preparation of the data were performed
by the Genetics Coordinating Center at the University of Washington.
InCHIANTI
The InCHIANTI study baseline (1998–2000) was supported as a "targeted
project" (ICS110.1/RF97.71) by the Italian Ministry of Health and in part by
the U.S. National Institute on Aging (Contracts: 263 MD 9164 and 263 MD
821336).
LBC
Lothian Birth Cohorts 1921 and 1936 (LBC1921, LBC1936)
We thank the cohort participants and team members who contributed to
these studies. Phenotype collection in the Lothian Birth Cohort 1921 was
supported by the BBSRC, The Royal Society and The Chief Scientist Office of
the Scottish Government. Phenotype collection in the Lothian Birth Cohort
1936 was supported by Age UK (The Disconnected Mind project).
Genotyping of the cohorts was funded by the UK Biotechnology and
Biological Sciences Research Council (BBSRC). The work was undertaken by
The University of Edinburgh Centre for Cognitive Ageing and Cognitive
Epidemiology, part of the cross council Lifelong Health and Wellbeing
Initiative (MR/K026992/1). Funding from the BBSRC, and Medical Research
Council (MRC) is gratefully acknowledged.
MAP/ROS
The MAP and ROS data used in this analysis was supported by National
Institute on Aging grants P30AG10161, R01AG17917, R01AG15819,
R01AG30146, the Illinois Department of Public Health, and the Translational
Genomics Research Institute.
Rotterdam
The Rotterdam Study is supported by Erasmus Medical Centre and Erasmus
University Rotterdam, the Netherlands Organization for Scientific Research
(NWO), the Netherlands Organization for Health Research and Development
(ZonMw), the Research Institute for Diseases in the Elderly (RIDE), the
Bihlmeyer et al. BMC Genetics (2014) 15:159
Netherlands Genomics Initiative, the Ministry of Education, Culture and
Science, the Ministry of Health, Welfare and Sports, the European
Commission (DG XII), and the Municipality of Rotterdam.
Prof. Tiemeier was supported by the VIDI grant of ZonMw (2009–017.106.370).
Dr. Ikram was supported by the VENI grant of NWO. The funders had no role in
the study design or data collection and analysis.
SHIP
SHIP is part of the Community Medicine Research net of the University of
Greifswald, Germany, which is funded by the Federal Ministry of Education and
Research (grants no. 01ZZ9603, 01ZZ0103, and 01ZZ0403), the Ministry of
Cultural Affairs as well as the Social Ministry of the Federal State of
Mecklenburg-West Pomerania, and the network ‘Greifswald Approach to
Individualized Medicine (GANI_MED)’ funded by the Federal Ministry of
Education and Research (grant 03IS2061A). Genome-wide data have been supported by the Federal Ministry of Education and Research (grant no. 03ZIK012)
and a joint grant from Siemens Healthcare, Erlangen, Germany and the Federal
State of Mecklenburg- West Pomerania. The University of Greifswald is a member of the ‘Center of Knowledge Interchange’ program of the Siemens AG and
the Caché Campus program of the InterSystems GmbH.
Author details
1
Predoctoral Training Program in Human Genetics, McKusick-Nathans
Institute of Genetic Medicine, Johns Hopkins University School of Medicine,
Baltimore, MD, USA. 2McKusick-Nathans Institute of Genetic Medicine, Johns
Hopkins University School of Medicine, BRB Room 447, 733 N. Broadway St,
Baltimore, MD 21205, USA. 3Department of Statistics, University of Auckland,
303.325 Science Centre, Private Bag 92019, Auckland 1142, New Zealand.
4
Department of Pathology, University of Washington, Seattle, WA, USA.
5
Departments of Medicine, Epidemiology, and Health Services, University of
Washington, Seattle, WA, USA. 6Laboratory of Neurogenetics, National
Institute on Aging, National Institutes of Health, Bethesda, MD, USA.
7
Laboratory of Epidemiology, Demography and Biometry, National Institute
on Aging, National Institutes of Health, Bethesda, MD, USA. 8Department of
Epidemiology and Prevention, Division of Public Health Sciences, Wake
Forest University School of Medicine, Winston-Salem, NC, USA. 9Department
of Biostatistics, Boston University School of Public Health, Boston, MA, USA.
10
The National Heart Lung and Blood Institute’s Framingham Heart Study,
Framingham, MA, USA. 11Section of General Internal Medicine, Department
of Medicine, Boston University School of Medicine, Boston, MA, USA.
12
Institute for Aging Research, Hebrew Senior Life, Department of Medicine,
Beth Israel Deaconess Medical Center and Harvard Medical School,
Cambridge, MA, USA. 13Survey Research Center, Institute for Social Research,
University of Michigan, Ann Arbor, MI, USA. 14Department of Epidemiology,
School of Public Health, University of Michigan, Ann Arbor, MI, USA. 15Centre
for Cognitive Ageing and Cognitive Epidemiology, The University of
Edinburgh, Edinburgh, UK. 16Department of Psychology, The University of
Edinburgh, Edinburgh, UK. 17Alzheimer Scotland Dementia Research Centre,
The University of Edinburgh, Edinburgh, UK. 18Rush Alzheimer’s Disease
Center, Rush University Medical Center, Chicago, IL, USA. 19Program in
Translational NeuroPsychiatric Genomics, Department of Neurology, Brigham
and Women’s Hospital and Harvard Medical School, Boston, MA, USA. 20Rush
Institute for Healthy Aging and Department of Internal Medicine, Rush
University Medical Center, Chicago, IL, USA. 21Department of Epidemiology,
Erasmus Medical Centre, Rotterdam, The Netherlands. 22Department of
Neurology, Erasmus Medical Centre, Rotterdam, The Netherlands.
23
Department of Radiology, Erasmus Medical Centre, Rotterdam, The
Netherlands. 24Department of Child and Adolescent Psychiatry, Erasmus
Medical Centre, Rotterdam, The Netherlands. 25Department of Psychiatry,
Erasmus Medical Centre, Rotterdam, The Netherlands. 26Department of
Internal Medicine, Erasmus Medical Centre, Rotterdam, The Netherlands.
27
Interfaculty Institute for Genetics and Functional Genomics, University
Medicine Greifswald, Greifswald, Germany. 28Institute for Community
Medicine, University Medicine Greifswald, Greifswald, Germany. 29Department
of Psychiatry and Psychotherapy, University Medicine Greifswald, HELIOS
Hospital Stralsund, Greifswald, Germany. 30German Center for
Neurodegenerative Diseases (DZNE), Site Rostock/Greifswald, Greifswald,
Germany. 31Unit of Periodontology, Department of Restorative Dentistry,
Periodontology and Endodontology, University Medicine Greifswald,
Greifswald, Germany. 32Icelandic Heart Association, Kopavogur, Iceland.
33
University of Iceland, Reykjavik, Iceland. 34National Institute on Aging,
National Institutes of Health, Bethesda, MD, USA. 35Cardiovascular Health
Page 7 of 7
Research Unit, Department of Medicine, University of Washington, Seattle,
WA, USA. 36Translational Gerontology Branch, National Institute on Aging,
Baltimore, MD, USA. 37Geriatric Unit, Azienda Sanitaria Firenze (ASF), Florence,
Italy. 38Department of Epidemiology, Johns Hopkins Bloomberg School of
Public Health, Baltimore, MD, USA. 39Division of Epidemiology and
Community Health, University of Minnesota, Minneapolis, MN, USA.
40
Department of Epidemiology, School of Public Health, University of North
Carolina at Chapel Hill, Chapel Hill, NC 27514, USA.
Received: 22 July 2014 Accepted: 19 December 2014
References
1. Online Mendelian Inheritance in Man [ />2. Hindorff LA, Sethupathy P, Junkins HA, Ramos EM, Mehta JP, Collins FS,
Manolio TA: Potential etiologic and functional implications of genomewide association loci for human diseases and traits. Proc Natl Acad Sci
U S A 2009, 106:9362–9367.
3. Mitton JB, Grant MC: Associations among protein heterozygosity, growth
rate, and developmental homeostasis. Annu Rev Ecol Syst 1984, 15:479–499.
4. Alibert P, Renaud S, Dod B, Bonhomme F, Auffray JC: Fluctuating
asymmetry in the Mus musculus hybrid zone: a heterotic effect in
disrupted co-adapted genomes. Proc Biol Sci 1994, 258:53–59.
5. Roberts SC, Little AC, Gosling LM, Perrett DI, Carter V, Jones BC, Penton-Voak I,
Petrie M: MHC-heterozygosity and human facial attractiveness. Evol Hum
Behav 2005, 26:213–226.
6. Coetzee V, Barrett L, Greeff JM, Henzi SP, Perrett DI, Wadee AA: Common
HLA alleles associated with health, but Not with facial attractiveness.
PLoS One 2007, 2:e640.
7. Campbell H, Carothers AD, Rudan I, Hayward C, Biloglav Z, Barac L, Pericic
M, Janicijevic B, Smolej-Narancic N, Polasek O, Kolcic I, Weber JL, Hastie ND,
Rudan P, Wright AF: Effects of genome-wide heterozygosity on a range
of biomedically relevant human quantitative traits. Hum Mol Genet 2007,
16:233–241.
8. Takata H, Ishii T, Suzuki M, Sekiguchi S, Iri H: Influence of major
histocompatibility complex region genes on human longevity among
okinawan-japanese centenarians and nonagenarians. Lancet 1987,
330:824–826.
9. Lie HC, Simmons LW, Rhodes G: Does genetic diversity predict health in
humans? PLoS One 2009, 4:e6391.
10. Piertney SB, Oliver MK: The evolutionary ecology of the major
histocompatibility complex. Heredity 2005, 96:7–21.
11. Charlesworth D, Willis JH: The genetics of inbreeding depression. Nat Rev
Genet 2009, 10:783–796.
12. Szulkin M, Bierne N, David P: Heterozygosity-fitness correlations: a time
for reappraisal. Evolution 2010, 64:1202–1217.
13. Arking DE, Chakravarti A: Understanding cardiovascular disease through the
lens of genome-wide association studies. Trends Genet TIG 2009, 25:387–394.
14. Hindorff LA, Gillanders EM, Manolio TA: Genetic architecture of cancer and
other complex diseases: lessons learned and future directions.
Carcinogenesis 2011, 32:945–954.
15. Menard S: Six approaches to calculating standardized logistic regression
coefficients. Am Stat 2004, 58:218–223.
16. Stouffer Samuel A, Suchman Edward A, DeViney Leland C, Star Shirley A,
Williams Robin M Jr: The American Soldier. Adjusting During Army Life, Vol. 1.
Princeton: Princeton University Press; 1949.