A comprehensive linkage map and QTL map for carcass traits in a cross between Giant Grey and New Zealand White rabbits
Bạn đang xem bản rút gọn của tài liệu. Xem và tải ngay bản đầy đủ của tài liệu tại đây (967.18 KB, 12 trang )
Sternstein et al. BMC Genetics (2015) 16:16
DOI 10.1186/s12863-015-0168-1
RESEARCH ARTICLE
Open Access
A comprehensive linkage map and QTL map for
carcass traits in a cross between Giant Grey and
New Zealand White rabbits
Ina Sternstein1*, Monika Reissmann1, Dorota Maj2, Josef Bieniek2 and Gudrun A Brockmann1
Abstract
Background: Genomic resources for the rabbit are still limited compared to many other livestock species. The
genomic sequence as well as linkage maps have gaps that hamper their use in rabbit genome research. Therefore,
the aims of this study were the improvement of existing linkage maps and the mapping of quantitative trait loci
(QTL) for carcass and meat quality traits. The study was performed in a F2 population of an initial cross between
Giant Grey (GG) and New Zealand White (NZW) rabbits. The population consisted of 363 F2 animals derived from 9
F1 bucks and 33 F1 does. 186 microsatellite and three SNP markers were informative for mapping.
Results: Out of 189 markers, which could be assigned to linkage groups, 110 markers were genetically mapped for
the first time. The average marker distance was 7.8 cM. The map across all autosomes reached a total length of
1419 cM. The maternal linkage map was 1.4 times longer than the paternal. All linkage groups could be anchored
to chromosomes. On the basis of the generated genetic map, we identified a highly significant QTL (genome-wide
significance p < 0.01) for different carcass weights on chromosome 7 with a peak position at 91 cM (157 Mb), a
significant QTL (p < 0.05) for bone mass on chromosome 9 at 61 cM (65 Mb), and another one for drip loss on
chromosome 12 at 94 cM (128 Mb). Additional suggestive QTL were found on almost all chromosomes. Several
genomic loci affecting the fore, intermediate and hind parts of the carcass were identified. The identified QTL
explain between 2.5 to 14.6% of the phenotypic variance in the F2 population.
Conclusions: The results present the most comprehensive genetic map and the first genome-wide QTL mapping
study for carcass and meat quality traits in rabbits. The identified QTL, in particular the major QTL on chromosome
7, provide starting points for fine mapping and candidate gene search. The data contribute to linking physical and
genetic information in the rabbit genome.
Keywords: Linkage map, QTL, Carcass composition, Meat quality, Rabbit
Background
Rabbit meat is healthy and in many countries a delicious
protein source for human nutrition. As such, carcass
composition and meat quality are of economic importance for rabbit breeders. The effective improvement of
breeding requires the understanding of the genomic
architecture and genomic information of such complex
traits. Compared to other farm animal species, genomic
resources for the rabbit are still limited. Although the
* Correspondence:
1
Department for Crop and Animal Sciences, Breeding Biology and Molecular
Genetics, Faculty of Live Science, Humboldt-Universität zu Berlin, Invalidenstr.
42, 10115 Berlin, Germany
Full list of author information is available at the end of the article
rabbit genome has been sequenced (embl.
org/Oryctolagus_cuniculus/, Ensembl 73, OryCun 2.0),
currently only about 82% of the 2.74 Gigabase of the
rabbit genome have been anchored to chromosomes. The
existing microsatellite based linkage maps for the rabbit
were built in two reference populations, one at INRA
(France) using three rabbit INRA strains (INRA2066,
Castor Orylag and Laghmere, [1]) and the other at the
Utrecht University (Netherlands) using an F2 intercross of
the rabbit strains AX/JU and IIIVO/JU [2,3]. These maps
do not cover all rabbit chromosomes.
A comprehensive linkage map can help to improve the
annotation and sequence assembly of the rabbit genome
© 2015 Sternstein et al.; licensee BioMed Central. This is an Open Access article distributed under the terms of the Creative
Commons Attribution License ( which permits unrestricted use, distribution, and
reproduction in any medium, provided the original work is properly credited. The Creative Commons Public Domain
Dedication waiver ( applies to the data made available in this article,
unless otherwise stated.
Sternstein et al. BMC Genetics (2015) 16:16
since it can link existing sequences of non-anchored
rabbit bacterial artificial chromosomes (BACs) to the
genome assembly. Such a genetic map is also an essential condition for the mapping of QTL in structured pedigrees which is an important step in quantitative trait
gene identification. Even in the era of genome-wide association studies (GWAS), which are performed in unstructured populations, linkage mapping in families
provides reliable genomic positions which support accurate mapping in GWAS.
This study aimed at building a comprehensive linkage
map, which is anchored to the existing physical map,
and using this information for mapping QTL for carcass
and meat quality traits. The study was performed in an
F2 pedigree of a cross between GG and NZW rabbits.
Results and discussion
Pedigree specific linkage map
Out of 387 known microsatellites [2-10], which were initially tested (Additional file 1: Table S1), 186 microsatellite
and additionally three SNP markers in the myostatin
(MSTN) gene [11], were informative for the cross between
GG and NZW. The myostatin gene is located on OCU7 at
130,429,151 bp ( />cuniculus/, Ensembl 73, OryCun 2.0). The physical position corresponds to 75.9 cM in the generated genetic
map. The gene resides between the markers D7Utr3 und
D7Utr4 that we used in this study. The number of
observed alleles for each of the 186 microsatellites varied
from two to eight with an average of 3.2 ± 1.0 in the
founder animals (Additional file 2: Table S2). The heterozygosity index for all informative markers in the F1
population ranged from 0.13 to 1.00 with an average of
0.65 ± 0.22. For the number of informative meioses a variation between 54 and 775 (468.6 ± 177.6) was observed,
among these 0 to 558 meioses (158.3 ± 129.9) had known
phases. The mean polymorphism information content per
marker in the F2 population was 0.43 ± 0.14 and varied
from 0.09 (INRACCDDV0074, INRACCDDV0017) to
0.77 (INRACCDDV0293, data not shown).
The 186 microsatellite and three SNP markers could be
assigned to 21 linkage groups. Twenty linkage groups are
located on Oryctolagus cuniculus (OCU) chromosomes 1
to 19 and X. Two linkage groups were assigned to OCU4,
but could not be linked to each other (Additional file 3:
Figure S1). Out of 189 markers, 110 markers were genetically mapped for the first time. For 53 markers, we could
confirm their cytogenetic positions. Compared to existing
linkage groups, which were generated in other crosses,
the cytogenetic positions could not be confirmed for five
markers (INRACCDDV0084, INRACCDDV0218, INRAC
CDDV0219, INRACCDDV0230, INRACCDDV0256) in
our cross. Twelve markers, which had sequence information, but had not been previously mapped, neither
Page 2 of 12
cytogenetically, genetically nor physically, were mapped in
our population for the first time. These markers are
INRACCDDV0103, INRACCDDV0165, INRACCDDV
0194, INRACCDDV0302, D5L1C3, D6L2B5, D6L2H3,
D6L3H10, D12L1C2, D12L1E11, D12L4A1 and OCRLADF4. These markers are particularly valuable for the
mapping of BAC clones to the genome assembly to
improve the rabbit genomic sequence (Additional file 2:
Table S2) [1-4,6-8,10,12-17].
Among 161 markers with known physical position
( Ensembl
73, OryCun 2.0), 155 markers had consistent positions in
the genetic and physical maps. Six markers could not be
mapped to their expected genomic positions. Although
they were assigned to linkage groups on the expected
chromosome (OCU6, 7, 8, 15 and 18) they had different positions on the chromosome. The affected markers
are D6Utr4 (OCU6: 25.038137), D7L2F2 (OCU7:
60.680119), INRACCDD0323 (OCU7: 59.306464), INR
ACCDDV0080 (OCU8: 37.478525), INRACCDDV0143
(OCU15: 108.340756) and INRACCDDV0218 (OCU18:
68.515123). The position of the marker INRACCDD
V0143 is inconsistent with respect to different published
cytogenetic positions [1,4]. The map position identified
in our population corresponds with the cytogenetic
position 15q12 [1].
Seven other microsatellite markers, for which a cytogenetic position was reported [1,4,12,14], could not be linked
to neighbouring markers in the expected region, instead
they showed a close linkage to loci on other chromosomes
in our cross. This refers to markers INRACCDDV0230
(14p11) [4] and INRACCDDV0219 (6p12-p13) [12],
which were assigned to OCU13, markers INRACCD
DV0218 (OCU3q14) [12] and INRACCDDV0256 (OCUX
q12prox) [4], which were relocated to OCU18, and
markers INRACCDDV0213 (OCU6p12prox) [1,12], INRA
CCDDV0127 (OCU6) [1] and INRACCDDV0084 (OCU
20q12) [14], which showed an X-linked inheritance in
our population. The new marker positions were confirmed by sequence alignments to the rabbit genome
( Ensembl
73, OryCun 2.0).
The calculated order of the other markers in the corresponding linkage groups on chromosomes 1, 3, 5, 7, 8,
11, 14, 16 and 19 is consistent with previous maps [1-3],
although, slight differences with regard to the distances
between markers occur. This is consistent with our
knowledge about pedigree specific linkage maps [18,19].
Differences in the marker order between our map and
previously published maps were identified for linkage
groups on chromosomes 4, 6, 9, 13, 15 and 18. Because
different markers were used in different mapping populations for chromosomes 2, 10, 12, 17, 20, 21 and X,
maps cannot be compared.
Sternstein et al. BMC Genetics (2015) 16:16
Since different resource populations were used to construct linkage maps, deviations in marker distances,
marker orders and even positions on different chromosomes can be expected. While mapping errors cannot be
excluded entirely, different mapping positions could
mainly result from genome reorganizations between the
different breeds that were used in the generation of
resource populations for mapping the markers. The information about deviant marker positions in different
populations is valuable for the genomic assembly of the
rabbit genome sequence as well as for genetic and
maybe even phenotypic diversity.
Maps calculated from maternal meioses across all autosomes were on average 1.4 times longer than paternal
maps. Higher recombination rates in females are also
consistent with findings in other species, for example in
pigs [20], cattle [21], humans [22], and mice [23]. However, in distinct regions on OCU4 (LG4b), OCU9 and
OCU16 maternal maps were shorter than paternal maps,
a result that was also observed in pigs, e. g. [18,19]. The
ratios of genetic lengths between the female and male
maps varied from 0.7 for OCU4 (LG 4b) and OCU16 to
5.4 for OCU11.
With a total genetic length for all autosomes of 1419
cM and an average marker distance of 7.8 cM our genetic
map provides the linkage map with the highest marker
coverage. Nevertheless, exceptions to good coverage still
exist on chromosomes 20, 21 and Y, because no marker
mapped to OCU20 and OCUY, and only one marker
could be assigned to OCU21.
Phenotypic characteristics and correlation between traits
GG rabbits have about 500 g higher liveweights than
NZW rabbits at the age of 84 days (Table 1). Since the
total body, carcass and meat weights as well as the
portions of head, fore, intermediate and hind parts are
important for rabbit breeders, we have analysed all these
traits. For all carcass traits, GG rabbits have higher
weights compared to NZW rabbits. The F1 and F2
means of hot and reference carcass weights shifted towards the mean value of the GG breed suggesting dominance components in the mode of inheritance. The
weight of the intermediate part and the meat weights of
fore and intermediate parts in F1 rabbits exceeded the
average performances of their parents. As expected, the
liveweight and carcass weights as well as the total weight
and the meat weight of the different carcass parts were
highly correlated (r ≥ 0.89, p < 0.0001, data not shown);
bone weights and head weight showed high correlations
to the other carcass traits (r ≥ 0.62, p < 0.0001, Table 2).
Similar results for highly correlation between carcass
traits were observed in other studies [24-26]. Drip loss
of the whole carcass showed low correlation with the pH
value 24 hours p.m. at M. biceps femoris (r = 0.19,
Page 3 of 12
p < 0.0001, Table 2). This is in line with the correlation
(r = 0.20) found between the pH value of M. biceps
femoris and water holding capacity (WHC) of M. longissimus dorsi in a three-way cross [27]. Most phenotypic correlations between carcass composition and
meat quality parameters are low and partially negative
(−0.28 ≤ r ≤ 0.31, p < 0.05, Table 2). Studies using principal
component analysis indicated that all colour measurements, pH values and fat had low correlations [28,29].
QTL effects on carcass composition traits
The QTL analysis for carcass composition traits identified 13 genome-wide (p < 0.05 corresponding to F = 8.1)
significant QTL in five genomic regions (Table 3). Additionally 55 chromosome-wise significant QTL (p < 0.05
corresponding to F > 3.6), which are considered as suggestive at the genome-wide level, were also identified
(Additional file 4: Table S3).
The most significant genomic region at the genomewide highly significance level was mapped for carcass
(F-value ≥ 11.02) and meat weights (F-value = 11.49) on
OCU7 with a peak position between 91 and 92 cM (157
Mb, Figure 1). The QTL peak positions are located in the
distal part of the q-arm of OCU7 within the flanking interval D7L1B10 (90.8 cM, 157.32 Mb) and INRACCDDV0092
(92.4 cM, 157.49 Mb). Consistent with the high phenotypic
correlation between traits, this QTL was also highly significant for hot and reference carcass weights as well as for
the total weight of the intermediate part and the meat
weight of the intermediate part (F-value ≥ 11.02). These
QTL accounted between 6.45 to 7.45% of the respective
total F2 variance. In addition, the effect was significant for
the carcass and meat weights of the fore and hind parts
(8.67 ≤ F-value ≤ 9.95) and kidney weight (F-value = 8.36).
This region has also a suggestive effect on liveweight.
Although the F-value curve for the different traits suggests the presence of a second QTL in the linkage group
(Additional file 5: Figure S2), a two QTL model did not
provide statistical evidence for the presence of a second
QTL on OCU7. As expected from the differences between parental rabbit breeds the GG alleles increased all
carcass and meat traits. The QTL effects were additive
(Figure 2, Table 3, Additional file 4: Table S3). The identified major QTL on OCU7 is probably responsible for
linear growth. Since the weights of all carcass parts and
meat weights are affected by this QTL in the same direction and the correlation between these traits adjusted for
the QTL on OCU7 genotypes is high (r > 0.9), pleiotropic effects on the development of carcass and skeletal
muscles can be assumed. This assumption is further
supported by the finding that the OCU7 QTL for the
weights of the carcass parts and meat weight were lost
when the reference carcass weight was included as a covariate into the model.
Sternstein et al. BMC Genetics (2015) 16:16
Page 4 of 12
Table 1 Phenotypic characterisation of parental breeds, F1 and F2 animals of the cross between GG and NZW
Trait
GG5
NZW5
F1
F2
Mean±SD
Mean±SD
Mean±SD
Mean±SD
n=4
Liveweight (g)
n = 18
n = 21
a
2522.56±126.72
a
b
3048.75±255.81
b
n = 363
b,c
2644.43±498.53a,c
a
2647.29±269.31
Hot carcass weight (g)
1426.50±175.64
1213.33±83.24
1357.10±132.42
1344.46±271.79a
Reference carcass weight (g)
1385.75±178.58a
1174.50±77.42b
1301.95±127.51a
1304.09±265.55a
a
Fore part weight (g)
563.50±69.55
462.78±38.13
521.67±54.26
523.44±111.66a
Intermediate part weight (g)
292.25±48.22a,b
264.39±20.21a
296.24±39.11b,c
289.89±65.55b,c
a,b
a
b,c
Hind part weight (g)
Meat weight fore part (g)1
1
b
a
529.50±63.49
446.89±28.41
482.90±43.21
490.59±94.81b,c
402.50±63.57a,b
360.11±36.58a
400.67±44.06b
382.00±88.14b
a
a
Meat weight intermediate part (g)
238.25±51.01
227.50±15.98
242.05±31.95
230.42±51.66a
Meat weight hind part (g)1
414.75±49.85a
363.83±26.77b
390.86±37.05a
377.73±77.30a,b
Bone weight fore part (g)
1
a,c
Bone weight intermediate part (g)1
Bone weight hind part (g)
a
1
148.25±27.26
98.50±8.06
114.57±13.12
125.54±27.00c
41.25±5.91a
27.94±4.02b
34.43±5.87c
39.53±10.00a
b
c
a
Head weight (g)1
1
Kidney weight (g)
Scapular fat weight (g)1
1
b
a
114.50±17.69
83.11±6.01
90.33±11.0
101.73±22.03a
180.25±6.80a
167.17±11.56b
163.10±10.52b
154.21±22.97c
a
27.00±6.38
17.28±1.60
20.10±4.32
17.43±3.76c
2.18±1.13a,b
0.90±1.17a
1.19±1.09b
1.93±1.42a
a
b
a,bc
a,c
b
Perirenal fat weight (g)
4.39±1.94
3.19±2.82
6.53±2.52
4.84±2.82c
Inguinal fat weight (g)1
0.00±0.00a
0.04v0.16a,b
0.36±0.69b
1.10±1.13c
a,b
b
a,b
Drip loss (%)
2.91±0.57
3.18±1.04
4.05±1.73
2.98±0.84a,c
pH45 value M. biceps femoris
6.99±0.42a
6.82±0.20a
6.44±0.24b
6.65±0.30c
b
5.75±0.19c
pH24 value M. biceps femoris
a,c
5.79±0.25
Meat coulor45 L* M. biceps femoris2
51.01±1.66a
a,b
5.81±0.11
5.61±0.11
-
55.48±1.16b
57.10±2.16c
b
2
Meat coulor24 L* M. biceps femoris
58.46±0.59
-
56.15±1.31
57.63±1.95a
Meat coulor45 a* M. biceps femoris2
2.91±0.84a
Meat coulor24 a* M. biceps femoris
2
Meat coulor45 b* M. biceps femoris2
a
-
12.19±1.08b
11.24±1.51c
a
4.11±1.11
-
b
14.06±0.98
12.90±1.67c
1.82±0.73a
-
1.10±1.19a
1.10±1.40a
a
3.58±1.49b
Meat coulor24 b* M. biceps femoris
4.78±0.97
-
Shear force3
-
-
2
4
Protein content (%)
2
4.67±0.85
3.11±0.90a
a
-
Fat content (%)4
1
a,b
3
3.35±0.85a
22.76±0.54
23.22±0.48
23.40±0.58b
2.83±0.85a
0.65±0.33b
0.80±0.37b
4
b
5
number of F2 animals = 327; number of F2 animals = 336; number of F2 animals = 155; number of F2 animals = 93; data for some meat quality traits were not
recorded in the founder breeds; pH45-pH value 45 min post mortem, pH24-pH value 24 h post mortem, meat colour45 - meat colour 45 min post mortem, meat
colour24- meat colour 24 h post mortem, L* - lightness, a*-redness, b*-yellowness; a,b,cSignificant differences between parental, F1 and F2 for the same trait
(t-test, p < 0.05).
A genome-wide significant QTL for bone weight in
the fore part (F-value = 8.94) was identified on OCU9
at 61 cM (65.57 Mb, Figure 1, Table 3). The nearest
markers to the peak position of the QTL for bone weight
in the fore part on OCU9 were INRACCDV0010/016
(60.2 cM, 64.72 Mb) and INRACCDDV0146 (61.5 cM,
66.06 Mb). QTL alleles of Giant Grey had additive
effects on the bone weight in the fore part (Figure 2,
Table 3). To the same region additional suggestive
effects were mapped for bone weight in the hind part
(F-value = 5.58), for the fore (F-value = 6.45) and hind
(F-value = 6.96) part weights of the carcass, for liveweight
(F-value = 7.34), hot carcass weight (F-value = 5.81), reference carcass weight (F-value = 5.72), and the head weight
(F-value = 7.22, Additional file 4: Table S3). The QTL
explained between 3.29 to 7.59% of the phenotypic F2
variance of the corresponding traits (Table 3, Additional
file 4: Table S3). The QTL on OCU9 affected not only
bone weights, but also carcass weights and fat content in
M. longissimus dorsi. This QTL particularly influenced the
fore and hind parts of the carcass including total mass,
bone and meat weights. When reference carcass weight
was included as a covariate in the one QTL model for
bone weight in the fore part, the position of the highest
Sternstein et al. BMC Genetics (2015) 16:16
Page 5 of 12
Table 2 Pearson’s correlation coefficients between carcass composition and meat quality traits1
BW BW BW SFa PFa IFa
HW KiW pH45
L*45
L*24
a*45
a*24
b*45
b*24
Pr
Fa
BF
BF
BF
BF
BF
BF
LD
LD
(.14)
(.13)
−.15*
(−.08)
(−.10)
(−.10)
−.39** (.01)
.58
(−.03) (−.09) (−.12) .15*
(.09)
−.15*
(−.07)
(−.10)
(−.14)
−.34** (.00)
.58
(−.04) (−.10) −.17*
.16*
(.09)
−.16*
(−.08)
(−.10)
−.15*
−.34** (.00)
.89
.58
(−.04) (−.10) −.16*
(.13)
(.07)
(−.11)
(−.04)
(−.07)
−.14*
−.34** (−.01)
.20** .79
.57
(−.05) (−.08) −.15*
(.12)
(.10)
−.16*
(−.08)
(−.10)
(−.10)
−.28*
.91
.55
(−.03) (−.09) −.17*
.21**
(.10)
−.20** (−.12)
(−.13)
−.18*
−.37** (−.02)
.21** .87
.59
(.00)
(−.09) (−.12) (.13)
(.07)
(−.10)
(−.02)
(−.06)
(−.10)
−.34** (−.06)
.77
.59
(.01)
(−.04) (−.13) (.12)
(.11)
−.15*
(−.08)
(−.06)
(−.07)
−.36** (−.07)
.89
.58
(−.01) (−.10) −.16*
.21**
(.10)
−.18*
(−.10)
(−.10)
−.15*
−.40** (−.08)
DL
.21**
IP
HP
W
W
W
LW
.80
.73
.77
.43
.44
.18** .88
.61
(−.04) (−.11) −.14*
HCW
.81
.72
.77
.44
.49
.23
.89
RCW
.81
.72
.77
.44
.49
.23
.89
FPW
.82
.68
.76
.44
.47
.22
IPW
.68
.70
.66
.47
.62
HPW
.83
.74
.81
.39
.41
.25
MWFP
.72
.61
.70
.40
.48
MWIP
.66
.62
.62
.46
.53
.18*
MWHP
.78
.67
.71
.40
.42
.22
BWFP
1.0
BWIP
BWHP
SFaW
PFaW
IFaW
HW
KiW
pH45BF
pH24BF
BF
pH24
FP
BF
.74
.81
.25
.24
.23
.78
.46
(−.03) (−.08) −.18*
1.0
.78
.24
.25
.23
.67
.45
(−.04) −.17*
1.0
.23
.20*
(.09)
.78
.38
(.03)
(−.06) (−.10) .20**
1.0
.43
(.05)
.33
.33
(.02)
(.02)
(.10)
.31
.40
−.15*
(−.11) (−.07) (−.13) (.00)
1.0
.30
(.12)
(−.07) (−.10) (−.08) .24**
1.0
1.0
(−.13) .31
(.03)
(.10)
−.17*
−.18*
(−.13)
−.25** −.40** (−.11)
.23
−.27
−.28
−.18*
−.24** −.44
(.13)
−.22** −.24** −.16*
−.25** −.39** (−.06)
(−.06)
(−.03)
(.00)
(.02)
(−.08)
(.04)
(−.03) (−.10) (.05)
(.05)
(.02)
(.10)
(.10)
.15*
(.09)
(.04)
(.08)
(−.12)
(−.07)
−.19
(−.13)
−.43
(.06)
.49
(−.04) (−.09) −.15*
.23*
(.08)
(−.16)
(−.14)
−.19** −.21** −.41
1.0
(−.04) (−.11) (−.09) (.03)
.18**
(−.03)
(.02)
(.02)
1.0
(.11)
−.30*
(−.01)
(.10)
.39
(.12)
(.08)
(.07)
(−.11)
(−.09)
.17*
(.14)
(−.09)
(−.02)
1.0
.19**
(−.03) (.07)
(−.01)
(−.02)
.18**
.20**
(−.04)
(−.06)
(−.12) (−.05) (.11)
.18**
(.09)
.24
.25*
(−.05)
.54
−.71
−.58
−.33
−.39
−.47
(.16)
1.0
−.54
−.65
−.26
−.14*
−.45** (.19)
1.0
.74
.47
.40
.45
(−.23)
1.0
.33
.56
.40**
(−.07)
1.0
.36
.37**
(−.21)
DL
L*45BF
L*24BF
a*45BF
a*24BF
b*45BF
1.0
1.0
b*24BF
1.0
PrLD
.35**
(.14)
1.0
−.30**
1
levels of significance: bold values are significant at p < 0.0001; asterisks mark different significances *p < 0.01; **p < 0.001; values in parentheses are not
significant. Abbreviations: LW live weight, HCW hot carcass weight, RCW reference carcass weight, FPW fore part weight, IPW intermediate part weight, HPW hind
part weight, MWFP meat weight fore part, MWIP meat weight intermediate part, MWHP meat weight hind part, LD, M. longissimus dorsi, BF, M. biceps femoris,
pH45 - pH value 45 min p.m.; pH24 - pH value 24 h p.m, L*45 and L*24, lightness 45 min and 24 h p.m.; a*45 and a*24, redness 45 min and 24 h p.m.; b*45 and b*24,
yellowness 45 min and 24 h p.m.; DL, drip loss ; PrLD, protein content of M. longissimus dorsi; FaLD, lipid content of M. longissimus dorsi.
peak of the bone weight in the fore part shifted from 61
cM (65.57 Mb) to 102 cM (113.67 Mb, Figure 1). The direction and magnitude of the additive effects of the two
QTL were consistent (Table 3, Additional file 4: Table S3).
Using the reference carcass as covariate in the model
(model 2), genome-wide QTL for hind part weight were
observed on OCU2 at 0 cM (29.01 Mb) and OCU19 at
45 cM (41.96 Mb) (Table 3, Figure 1). The OCU2 QTL
alleles of GG had additive effects and the OCU19 GG
alleles were dominant (Figure 2, Table 3). These QTL explained 5.96% and 5.07% of the phenotypic F2 variance.
With the model 2, an additional genome-wide significant
QTL was identified for bone weight in the fore part on
OCU3 at 90 cM (132.70 Mb, Table 3, Figure 1). QTL
alleles of GG had overdominance effects (Figure 2,
Table 3). The QTL accounted for 6.03% of the phenotypic F2 variance.
QTL effects on meat quality traits
The QTL analysis for meat quality traits identified
one genome-wide (p < 0.05) significant QTL on OCU12
(Table 3). Additionally 13 suggestive QTL at the
chromosome-wise significance threshold of p < 0.05 were
identified on chromosomes 1, 2, 5, 8, 9, 11, 16, 17 and
18 (Additional file 4: Table S3). The genome-wide scan
for meat quality traits identified a significant QTL on
OCU12 affecting drip loss of the whole carcass (F-value =
8.16, Figure 1). The peak QTL position is located at the
OCU/LG
Trait
Model1
cM2 (Mb)
Flanking markers3
2
Hind part weight (g)
2
0.0 (29.01)
INRACCDDV0192
3
Bone weight fore part (g)
2
90.0 (131.74)
Sat3
INRACCDDV0203
7
Kidney weight (g)
1
90.0 (155.45)
D7Utr4
D7L1B10
7
Hot carcass weight (g)
1
91.0 (157.34)
D7L1B10
INRACCDDV0092
Left or direct
95% CI4
Right
F-value5
a (SE)6
d (SE)7
VF2%8
0.0- 18.0
10.10**
5.82 (1.30)
0.82 (1.86)
5.96
28.5- 90.0
9.11*
4.45 (1.39)
-6.33 (2.12)
6.03
20.0 97.0
8.36*
0.84 (0.21)
0.19 (0.31)
4.97
5.0- 98.0
11.02**
64.83 (14.78)
36.34 (22.10)
6.46
(cM)
7
Reference carcass weight (g)
1
91.0 (157.34)
D7L1B10
INRACCDDV0092
5.0- 98.0
11.34**
63.70 (14.45)
38.50 (21.62)
6.64
7
Fore part weight (g)
1
91.0 (157.34)
D7L1B10
INRACCDDV0092
3.0- 98.0
8.69*
23.86 (6.16)
13.94 (9.21)
5.17
7
Intermediate part weight (g)
1
91.0 (157.34)
D7L1B10
INRACCDDV0092
62.0- 98.0
13.06**
17.66 (3.76)
11.21 (5.62)
7.57
7
Hind part weight (g)
1
92.0 (157.45)
D7L1B10
INRACCDDV0092
3.0- 98.0
9.95*
21.58 (5.18)
11.84 (7.68)
5.87
7
Meat weight fore part (g)
1
92.0 (157.45)
D7L1B10
INRACCDDV0092
4.0- 98.0
8.67*
20.34 (5.42)
13.08 (8.05)
5.75
7
Meat weight intermediate part (g)
1
92.0 (157.45)
D7L1B10
INRACCDDV0092
15.5- 98.0
11.49**
13.91 (3.21)
8.69 (4.78)
7.46
7
Meat weight hind part (g)
1
93.0 (158.19)
INRACCDDV0092
D7Utr5
3.0- 98.0
9.35*
18.72 (4.62)
8.92 (6.88)
6.16
9
Bone weight fore part (g)
1
61.0 (65.57)
INRACCDDV0010
INRACCDDV0146
35.0- 98.5
8.94*
7.10 (1.74)
-1.83 (2.50)
5.92
12
Drip loss (%)
1
94.0 (127.58)
INRACCDDV0201
INRACCDDV0176
0.0- 94.0
8.16*
-0.29 (0.10)
-0.58 (0.19)
4.87
19
Hind part weight (g)
2
45.0 (48.44)
INRACCDDV0071
INRACCDDV0193
28.5- 67.0
8.52*
3.23 (1.36)
6.87 (2.18)
5.07
Sternstein et al. BMC Genetics (2015) 16:16
Table 3 Positions and effects of significant QTL for carcass and meat quality traits in the cross between GG and NZW rabbits
1
Model 1-standard QTL model with covariate birthweight; Model 2-standard QTL model with covariate reference carcass weight, 2Chromosomal location is given as pedigree-specific cM position; first marker on each
chromosome was set at 0 cM. Estimated physical position between the flanking markers in Mb is given in parentheses; 3Flanking markers (left or direct and right) of the QTL peak; 4CI-confidence interval; 5F-value is
F-statistic for QTL using standard one QTL model; 6a-additive effect; 7d-dominance effect; the direction of additive and dominance effects is given as GG-allele effect compared to NZW, bold values indicate significant
effects if the estimate divided by the standard error > 1.96; 8phenotypic F2 variance (%) explained by the QTL; **highly significant at 1% genome-wide level (F-value ≥ 10.0), *significant at 5% genome-wide level
(F-value ≥ 8.10); pH45 - pH value 45 min post mortem, pH24 - pH value 24 h post mortem, meat colour45 L*, a*, b* - meat colour traits lightness, redness, yellowness 45 min post mortem, meat colour24 L*, a*, b*- meat
colour traits lightness, redness, yellowness 24 h post mortem.
Page 6 of 12
Sternstein et al. BMC Genetics (2015) 16:16
Page 7 of 12
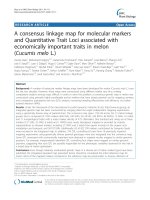
Figure 1 F-value curves across all chromosomes for significant traits. (a) Reference carcass weight, hind part weight with birthweight as a
covariate (Model 1), and hind part weight with reference carcass weight as a covariate (Model 2), and for hind part weight ΔF = |Model 1 – Model 2| as
the difference of F-values between the models 1 and 2. (b) Bone weights of the fore part with birthweight as a covariate (Model 1) and bone weights
of the fore part with reference carcass weight as a covariate (Model 2), and for bone weights of the fore part ΔF = |Model 1 – Model 2| as the
difference of F-values between the models 1 and 2. (c) Drip loss. The horizontal lines represent F-value thresholds at the genome-wide highly
significant (solid), significant (dotted) and suggestive (dashed) levels of significance.
end of the q-arm at 94 cM (127.58 Mb) near the marker
INRACCDDV0176. The QTL accounted for 4.78% of the
phenotypic F2 variance. The GG QTL allele had negative
dominance effects (Figure 2, Table 3). Another QTL for
drip loss which was suggestive was mapped on OCU18
(F-value = 5.00, Figure 1, Additional file 4: Table S3).
Since 68 QTL for carcass composition and meat quality traits are suggestive further studies are needed to
confirm their effects. Therefore, these QTL are listed in
Additional file 4: Table S3, but are not further discussed
here.
Candidate gene identification
Previously, a single marker association analyses of the
MSTN gene, as a key candidate gene affecting muscle
development in different species [30-32], identified association of myostatin variants with several carcass composition traits in rabbits [11]. In our candidate gene
study, out of three SNPs in the MSTN gene, only SNP
c.373 + 234G > A [GenBank: NM_001109821] showed a
significant association, while the SNPs c.-125T > C and
c.747 + 34C > T were not significant. The F-value curve
pertaining to the linkage analysis across the whole
chromosome 7, suggests the presence of a major peak
for different carcass traits at the end of the chromosome
in addition to the QTL effects on the same traits 6 cM
away from the MSTN gene (Additional file 5: Figure S2).
However, the two QTL analysis in the examined F2
population did not reach the significance level to provide
evidence for the existence of a second QTL different
Sternstein et al. BMC Genetics (2015) 16:16
Page 8 of 12
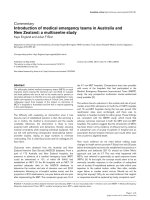
Figure 2 Exemplary genotype effect plots of carcass traits at the nearest marker to the QTL peaks. a) Reference carcass weight on OCU7
b) drip loss OCU12 c) and d) bone weight fore part on OCU9 and OCU3, respectively, e) and f) Hind part weight on OCU2 and OCU19,
respectively, a)-c) using the model 1 with birthweight as covariate (Model1) d)-f) using the model 2 with reference carcass weight as covariate
(Model 2), Values are LSM ± SE. G: Giant Grey allele, N: New Zealand White allele *P < 0.05, **P < 0.01 and ***P < 0.001 refer to significant
differences between genotype classes (t-test).
than that identified by the single-QTL analysis at position 90–93 cM.
The estimated confidence intervals for all identified
QTL effects were very large and cover almost the whole
chromosome. Therefore, the selection of putative candidate genes is difficult and requires further studies to
reduce the confidence intervals. Considering the confidence interval (62.0 to 98.0 cM) of the main QTL peak
on OCU7, the search in the rabbit genome database
( Ensembl
release 73, OryCun 2.0) provides a list of about 300 genes.
For example, the insulin like growth factor binding
protein 2 (IGFBP2, 7:158.054321Mb) and the in-
sulin like growth factor binding protein 5 (IGFBP5,
7:158.093549Mb) are located near directly under the
peak position of the OCU7 at 158 Mb. These genes are
positional and functional candidate genes for effect on
carcass weights. IGFBP2 gene effects associated with
growth and carcass composition were reported for
chicken [33] and pigs [34]. In addition, an overexpression of IGFBP2 reduces the postnatal body weight gain
in transgenic mice [35]. A common QTL region between sheep on OAR2 and cattle on BTA2, which is
orthologous to the rabbit OCU7 QTL region, have been
previously reported for carcass weight, eye muscle area
and retail product yield [36].
Sternstein et al. BMC Genetics (2015) 16:16
Conclusions
This study provides a comprehensive genetic map of 189
markers for the rabbit genome. The marker linkage map
as well as the link to the physical map provides valuable
information for the further improvement of the rabbit
genomic sequence assembly and a tool for mapping functional effects. In addition, this study was the first QTL
analysis in rabbits for carcass composition and meat quality traits. The major QTL on OCU7 for carcass and meat
weights, the QTL for bone and carcass weights on OCU9,
as well as the QTL for drip loss on OCU12 have not been
described before. This genetic information provides an
important step in the identification of functional quantitative trait genes. Fine mapping in an advanced intercross
population and in particular association mapping in
breeding populations using dense SNP markers will facilitate candidate genes identification in the future.
Methods
Animals
For linkage analyses an F2 intercross population with
363 offspring (183 males and 180 females from 9 F1
bucks and 33 F1 does) was generated from an initial
cross between six purebred GG bucks and six purebred
NZW does (Additional file 6: Table S4). GG and NZW
rabbits were obtained from local breeders. Rabbits were
housed under standardized conditions in the experimental station of the Department of Genetics and Animal
Breeding of the Agricultural University of Krakow. Adult
rabbits were housed in two-storey wooden cages which
were placed in a heated hall with lighting and exhaust
ventilation. Cages were equipped with a water supply
system (nipple drinkers). Offspring were weaned at the
age of five weeks and subsequently housed in metal
cages arranged in batteries with two rabbits per cage.
Rabbits had ad libitum access to feed and water. The
feed consisted of 16.5% protein, 14% crude fibre, and
10.2 MJ metabolisable energy. The experiment was approved by the Agricultural University of Krakow.
Phenotypes - carcass composition
The animals were slaughtered at the age of 12 weeks.
After removing the skin, the head and the giblets, the
weights of liver, kidney, lung, heart, head and hot carcass
(without head and giblets) were recorded. Afterwards,
the carcass was first kept at room temperature in a ventilated area for 45 min and then at 4°C until 24 h post
mortem. After cooling, the carcass was weighted to determine the reference carcass weight. Then the carcass
was cut to the fore (cut after the last rib), intermediate
(cut after the last lumbar vertebra) and hind part and
further dissected to meat, bone and dissectible fat. All
carcass parts were weighted. The scapular, perirenal and
Page 9 of 12
inguinal fat percentages were calculated as percentage of
the appropriated carcass part.
Phenotypes - meat quality
The pH values in the M. biceps femoris were measured
at 45 min and 24 h post mortem using a pH meter with
an accuracy of 0.01 (HI-9024). Meat colour was measured on the surface of M. biceps femoris according to
the CIELab standards (CIE 1976: light source D65 and 8
mm diameter) at room temperature (20°C) at 45 min
and 24 h post mortem with a CR-400 Minolta chromometer (Minolta Co., Ltd., Osaka, Japan). The values of
lightness (L*), redness (a*) and yellowness (b*) were recorded. The shear force by Warner-Bratzler was determined in a fresh M. longissimus dorsi sample (14mm
diameter, 15mm high) with the Texture Analyser TA-XT2
(Stable Micro System, Goldaming, UK) using a triangular
knife incision. Drip loss was calculated as percentage of
the weight difference between hot and reference carcass
weight to the hot carcass weight. Protein and lipid content
in M. longissimus dorsi were determined according to ISO
standards. The protein content was determined by the
method of Kjeldahl (PNA-04018:1975). The lipid content
was determined using the method of Soxhlet (PN-ISO1444:2000). Some phenotypes could not be measured in
purebred animals of GG and NZW. These are the traits
for meat colour in NZW and for shear force, protein and
fat content in GG rabbits.
Genotyping
For genotyping, the DNA was extracted from 200 μL
whole EDTA blood using NucleoSpin® Blood kit (Macherey
& Nagel, Düren, Germany). Microsatellites were amplified
by locus-specific PCR and fragment size was determined
by the LI-COR DNA Analyzer 4200 (LI-COR Biosciences,
Lincoln, USA) as described in detail, previously [37]. Initially, we tested 387 available rabbit microsatellites [2-10]
with all parental animals to identity informative markers
for the cross between GG and NZW. Nine markers were
fully and 180 partially informative. These markers were genotyped in all F2 animals. 122 markers were uniform and
76 markers could not be successfully amplified or did not
give specific fragments (Additional file 1: Table S1). The
polymorphism information content in the F2 population
was calculated according to Botstein [38].
Since numerous mutations in the MSTN gene had been
associated with growth, muscle mass, and other carcass
composition traits in different species [30-32,39-43],
the MSTN gene was chosen as a functional candidate
gene. We additionally genotyped three SNP (c.-125T > C,
c.373 + 234G > A, c.747 + 34C > T) in the rabbit MSTN
gene [11] by allele specific PCR [44]. To detect genotyping
errors, the observed F2 genotype frequencies were compared with the expected frequencies using a chi-square
Sternstein et al. BMC Genetics (2015) 16:16
test. This analysis revealed three microsatellite markers
(INRACCDDV0035, INRACCDDV0157 and INRACC
DDV0204) with null alleles, which were excluded from
further analyses. Furthermore, we checked recombination
frequencies and double recombinations between adjacent
markers to detect potential genotyping errors. For checking recombination events and counting the number of informative meioses per locus we used the CHROMPIC and
PREPARE options, respectively, from the software package
CRI-MAP, version 2.4 [45].
Construction of a pedigree specific linkage map
The pedigree specific linkage map for the studied population was built on the basis of 186 microsatellite
markers and three SNP markers using Kosambi mapping
function in CRI-MAP software, version 2.4 [45]. In the
first step, a two-point linkage analysis was performed in
which all markers were analyzed against each other. In
the second step, the marker locus order was calculated
with the BUILD option allowing different recombination
rates in the intervals between the sexes. The BUILD
option was started with the highest informative loci.
Subsequently, the other loci were consecutively included
for the construction of linkage groups. The FLIPS option
was used to confirm the correct order of the marker loci.
Finally, we generated sex-specific and sex-averaged genetic maps. The genetic distances are given in centiMorgan (cM) between markers, with the first marker of
every linkage group at 0 cM. The physical positions of
markers in megabase (Mb) were given according to the
respective sequence position in the rabbit genome assembly at ENSEMBL ( Ensembl 73, OryCun 2.0). Peak QTL
positions were translated into physical positions as a
linear genetic distance between adjacent markers with
physical positions.
Basic statistical analysis
Basic statistics were performed using the PASW software
package version 18.0 (SPSS, Inc., Somers, NY, USA). The
phenotypic data were checked for normal distribution
using the procedure EXAMINE (Kolmogorov-Smirnov
test). Pearson’s correlation coefficients between traits were
estimated using the CORRELATE procedure. Family (fullsibs), sex and season were detected as factors affecting the
phenotypes using the GLM procedure and thus were considered as fixed effects in the QTL model. Genotype effect
plots were drawn with least square means (LSM). A t-test
with Bonferroni correction for multiple testing was performed to test phenotypic differences between genotype
classes of the nearest marker to a QTL peak.
Single marker analyses were performed for the three
MSTN SNPs. The model included common litter effects,
season, sex, SNP genotype, interaction between season
Page 10 of 12
and family as fixed effects, and birth weight as covariate
(PASW, Version 18.0). For pairwise comparisons, p-values
were adjusted for multiple testing using the Bonferroni
procedure [11].
QTL mapping
QTL mapping was performed on the basis of the sexaveraged map using Grid-QTL [46]. The BC-F2 module
was used which assumes that founder lines are fixed for alternative alleles at QTL loci. Data were analysed with least
squares regression interval mapping method using family
(full-sibs, 36 levels), sex (2 levels) and season (4 levels) as
fixed effects, and birth weight as an interactive covariate
(model 1). Reference carcass weight was highly correlated
with the weights of the carcass parts as well as the individual meat, bone and fat weights of the carcass parts
(0.23 < r < 0.99, p < 0.001). Therefore, it was included as a
covariate in additional analyses (model 2). Genome-wide
and chromosome-wise significance thresholds were determined by permutation tests [47]. One thousand permutations were performed for all traits. Threshold values for a
given level of significance were calculated as an average of
thresholds over all traits. The F-value of 10.0 corresponds to
genome-wide highly significance (α = 0.01) and the F-value
of 8.1 to genome-wide significance (α = 0.05). Genome-wide
suggestive QTL are detected at chromosome-wise significance of α < 0.05, corresponding to F-value thresholds between 3.6 and 6.0 for the different chromosomes. The
95% confidence interval of a QTL was estimated using
parametric bootstrap analysis with 1000 iterations [48].
OCUX was analysed as a pseudo-autosome in all analyses
as all markers were located in that region. The direction
of the genetic effects was given as GG allele effect compared with NZW. QTL positions are given as cM distance
of the highest F-value from the first marker on a chromosome. The phenotypic variance explained by a QTL was
calculated as reduction of residual sum of squares in the
full model (with QTL) compared with the reduced model
(without QTL).
A 1 cM grid search was performed in Grid QTL by fitting
model to estimate the effects of two QTL at separate positions within the same linkage group simultaneously, examining all possible pairs of markers, to test whether the twoQTL model explained significantly more variation than the
best QTL from the one-QTL analysis. Two F-statistics were
computed. The two-QTL model was accepted if there was
a significant improvement over the best possible one-QTL
model at p < 0.05 using a variance ratio (F) test.
Additional files
Additional file 1: Table S1. Information about tested markers.
Sternstein et al. BMC Genetics (2015) 16:16
Page 11 of 12
Additional file 2: Table S2. Summary of the information for markers
that were integrated into the genetic map [1-4,6-8,10,12-17].
6.
Additional file 3: Figure S1. Cytogenetic associated linkage map for
the F2 cross GG x NZW. The cytogenetic map (left) of every chromosome
is connected to the sex averaged pedigree-specific linkage map (right).
The numbers on the right hand side of the linkage maps give the
estimated distances between loci in cM (Kosambi), the statistical support
for the pair-wise order of markers is given on the left hand side. The total
genetic length of every linkage group is given at the bottom of each bar.
Connecting lines indicate the cytogenetic positions of microsatellites
previously mapped by fluorescence in situ hybridization [1-4,7,12-15,17].
7.
8.
9.
10.
Additional file 4: Table S3. Positions and effects of suggestive QTL for
carcass traits of the cross between GG and NZW rabbits.
Additional file 5: Figure S2. F value curves across OCU7 pertaining to
QTL scans for carcass traits (Model 1).
11.
Additional file 6: Table S4. Structure of the F2 pedigree (GG x NZW).
12.
Abbreviations
GG: Giant grey; NZW: New Zealand White; BAC: Bacterial artificial
chromosomes; GWAS: Genome-wide association study; LD: Linkage
disequilibrium; MSTN: Myostatin; OCU: Oryctolagus cuniculus chromosome;
SNP: Single nucleotide polymorphism; Bp: Base pairs; Mb: Mega base pairs;
QTL: Quantitative trait locus.
Competing interests
The authors declare that they have no competing interests.
Authors’ contributions
IS designed the experiment, supervised the study, tested markers, performed
genotyping and data quality control, carried out the linkage and QTL
mapping analyses and drafted the manuscript, GAB contributed to write the
manuscript, MR genotyped the SNP, JB generated the pedigree and
supervised the phenotyping, DM phenotyped animals and collected blood.
All authors read and approved the final manuscript.
Acknowledgements
The project was supported by the German Research Foundation (DFG,
project STE 1461/2-2). We acknowledge technical support from Nora Thaben
for DNA isolation and microsatellite genotyping.
Author details
1
Department for Crop and Animal Sciences, Breeding Biology and Molecular
Genetics, Faculty of Live Science, Humboldt-Universität zu Berlin, Invalidenstr.
42, 10115 Berlin, Germany. 2Department of Genetics and Animal Breeding,
Agricultural University of Kraków, Al. Mickiewicza 24/28, 30-059 Kraków,
Poland.
13.
14.
15.
16.
17.
18.
19.
20.
Received: 16 May 2014 Accepted: 16 December 2014
21.
References
1. Chantry-Darmon C, Urien C, de Rochambeau H, Allain D, Pena B, Hayes H, et al.
A first-generation microsatellite-based integrated genetic and cytogenetic map
for the European rabbit (Oryctolagus cuniculus) and localization of angora and
albino. Anim Genet. 2006;37(4):335–41.
2. Korstanje R, Gillissen GF, den Bieman MG, Versteeg SA, van Oost B, Fox RR, et al.
Mapping of rabbit chromosome 1 markers generated from a microsatelliteenriched chromosome-specific library. Anim Genet. 2001;32(5):308–12.
3. Korstanje R, Gillissen GF, Versteeg SA, van Oost BA, Bosma AA, Rogel-Gaillard C,
et al. Mapping of rabbit microsatellite markers using chromosome-specific
libraries. J Hered. 2003;94(2):161–9.
4. Chantry-Darmon C, Urien C, Hayes H, Bertaud M, Chadi-Taourit S, Chardon
P, et al. Construction of a cytogenetically anchored microsatellite map in
rabbit. Mamm Genome. 2005;16(6):442–59.
5. Ferrand N, Azevedo M, Mougel F. A diallelic short tandem repeat (CCCCG)4
or 5, located in intron 1 of rabbit alpha-globin gene. Anim Genet.
2000;31(1):74–5.
22.
23.
24.
25.
26.
27.
van Haeringen WA, den Bieman M, van Zutphen LF, van Lith HA.
Polymorphic microsatellite DNA markers in the rabbit (Oryctolagus
cuniculus). J Exp Anim Sci. 1996;38(2):49–57.
Korstanje R, Gillissen GF, Kodde LP, Den Bieman M, Lankhorst A, Van Zutphen
LF, et al. Mapping of microsatellite loci and association of aorta atherosclerosis
with LG VI markers in the rabbit. Physiol Genomics. 2001;6(1):11–8.
Mougel F, Mounolou JC, Monnerot M. Nine polymorphic microsatellite loci
in the rabbit. Oryctolagus cuniculus Anim Genet. 1997;28(1):58–9.
Rico C, Rico I, Webb N, Smith S, Bell D, Hewitt G. Four polymorphic
microsatellite loci for the European wild rabbit. Oryctolagus cuniculus Anim
Genet. 1994;25(5):367.
Surridge AK, Bell DJ, Rico C, Hewitt GM. Polymorphic microsatellite loci in
the European rabbit (Oryctolagus cuniculus) are also amplified in other
lagomorph species. Anim Genet. 1997;28(4):302–5.
Sternstein I, Reissmann M, Maj D, Bieniek J, Brockmann GA. A new single
nucleotide polymorphism in the rabbit (Oryctolagus cuniculus) myostatin
(MSTN) gene is associated with carcass composition traits. Anim Genet.
2014;45(4):596–9.
Chantry-Darmon C, Rogel-Gaillard C, Bertaud M, Urien C, Perrocheau M,
Chardon P, et al. 133 new gene localizations on the rabbit cytogenetic map.
Cytogenet Genome Res. 2003;103(1–2):192–201.
Zijlstra C, de Haan NA, Korstanje R, Rogel-Gaillard C, Piumi F, van Lith HA,
et al. Fourteen chromosomal localizations and an update of the cytogenetic
map of the rabbit. Cytogenet Genome Res. 2002;97(3–4):191–9.
Hayes H, Rogel-Gaillard C, Zijlstra C, De Haan NA, Urien C, Bourgeaux N,
et al. Establishment of an R-banded rabbit karyotype nomenclature by FISH
localization of 23 chromosome-specific genes on both G- and R-banded
chromosomes. Cytogenet Genome Res. 2002;98(2–3):199–205.
Chantry-Darmon C, Bertaud M, Urien C, Chadi-Taourit S, Perrocheau M,
Rogel-Gaillard C, et al. Expanded comparative mapping between man and
rabbit and detection of a new conserved segment between HSA22 and
OCU4. Cytogenet Genome Res. 2005;111(2):134–9.
Rogel-Gaillard C, Zijlstra C, Bosma AA, Thepot D, Fontaine ML, Devinoy E,
et al. Assignment of the rabbit whey acidic protein gene (WAP) to rabbit
chromosome 10 by in situ hybridization and description of a large region
surrounding this gene. Cytogenet Cell Genet. 2000;89(1–2):107–9.
Rogel-Gaillard C, Piumi F, Billault A, Bourgeaux N, Save JC, Urien C, et al.
Construction of a rabbit bacterial artificial chromosome (BAC) library:
application to the mapping of the major histocompatibility complex to
position 12q.1.1. Mamm Genome. 2001;12(3):253–5.
Geldermann H, Müller E, Moser G, Reiner G, Bartenschlager H, Cepica S, et al.
Genome-wide linkage and QTL mapping in porcine F2 families generated
from Pietrain, Meishan and Wild Boar crosses. Genomweite Kopplungs- und
QTL-Kartierung in porcinen F2-Familien, erzeugt aus Kreuzungen von Pietrain,
Meishan und Wildschwein. J Anim Breed Genet. 2003;120(6):363–93.
Tortereau F, Servin B, Frantz L, Megens H-J, Milan D, Rohrer G, et al. A high
density recombination map of the pig reveals a correlation between sexspecific recombination and GC content. BMC Genomics. 2012;13(1):586.
Archibald AL, Haley CS, Brown JF, Couperwhite S, McQueen HA, Nicholson
D, et al. The PiGMaP consortium linkage map of the pig (Sus scrofa). Mamm
Genome. 1995;6(3):157–75.
Kappes SM, Keele JW, Stone RT, McGraw RA, Sonstegard TS, Smith TP, et al.
A second-generation linkage map of the bovine genome. Genome Res.
1997;7(3):235–49.
Dracopoli NC, O'Connell P, Elsner TI, Lalouel J-M, White RL, Buetow KH, et al.
The CEPH consortium linkage map of human chromosome 1. Genomics.
1991;9(4):686–700.
Cox A, Ackert-Bicknell CL, Dumont BL, Ding Y, Bell JT, Brockmann GA, et al.
A new standard genetic map for the laboratory mouse. Genetics.
2009;182(4):1335–44.
Elamin K. Sex effects on carcass and non carcass traits of sudanese mature
belladi rabbits. Wayamba J Anim Sci. 2013;5:598–604.
Hernández P, Pla M, Blasco A. Prediction of carcass composition in the
rabbit. Meat Sci. 1996;44(1–2):75–83.
Michalik D, Lewczuk A, Wilkiewicz-Wawro E, Brzozowski W. Prediction of the
meat content of the carcass and valuable carcass parts in French lop rabbits
using some traits measured in vivo and post mortem. Czech J Anim Sci.
2006;51(9):406–15.
Hernandez P, Pla M, Oliver MA, Blasco A. Relationships between meat
quality measurements in rabbits fed with three diets of different fat type
and content. Meat Sci. 2000;55(4):379–84.
Sternstein et al. BMC Genetics (2015) 16:16
28. Hernandez P, Pla M, Blasco A. Relationships of meat characteristics of two
lines of rabbits selected for litter size and growth rate. J Anim Sci.
1997;75(11):2936–41.
29. Hernández P, Pla M, Blasco A. Carcass characteristics and meat quality of
rabbit lines selected for different objectives: II. Relationships between meat
characteristics. Livest Prod Sci. 1998;54(2):125–31.
30. Boman IA, Klemetsdal G, Blichfeldt T, Nafstad O, Vage DI. A frameshift
mutation in the coding region of the myostatin gene (MSTN) affects carcass
conformation and fatness in Norwegian White Sheep (Ovis aries). Anim
Genet. 2009;40(4):418–22.
31. Grobet L, Martin LJ, Poncelet D, Pirottin D, Brouwers B, Riquet J, et al. A
deletion in the bovine myostatin gene causes the double-muscled
phenotype in cattle. Nat Genet. 1997;17(1):71–4.
32. McPherron AC, Lee SJ. Double muscling in cattle due to mutations in the
myostatin gene. Proc Natl Acad Sci U S A. 1997;94(23):12457–61.
33. Lei MM, Nie QH, Peng X, Zhang DX, Zhang XQ. Single nucleotide polymorphisms
of the chicken insulin-like factor binding protein 2 gene associated with
chicken growth and carcass traits. Poult Sci. 2005;84(8):1191–8.
34. Wang W, Meng Q, Hu X, Fei J, Feng J, Liu W, et al. Chromosome location and
association of haplotypes of insulin-like growth factor binding protein-2 with
production performance in swine. Biochem Genet. 2008;46(7–8):381–91.
35. Hoeflich A, Wu M, Mohan S, Foll J, Wanke R, Froehlich T, et al. Overexpression
of insulin-like growth factor-binding protein-2 in transgenic mice reduces
postnatal body weight gain. Endocrinology. 1999;140(12):5488–96.
36. Cavanagh CR, Jonas E, Hobbs M, Thomson PC, Tammen I, Raadsma HW.
Mapping Quantitative Trait Loci (QTL) in sheep. III. QTL for carcass
composition traits derived from CT scans and aligned with a meta-assembly
for sheep and cattle carcass QTL. Genet Sel Evol. 2010;42:36.
37. Bevova MR, Aulchenko YS, Aksu S, Renne U, Brockmann GA. Chromosome-wise
dissection of the genome of the extremely big mouse line DU6i. Genetics.
2006;172(1):401–10.
38. Botstein D, White RL, Skolnick M, Davis RW. Construction of a genetic
linkage map in man using restriction fragment length polymorphisms.
Am J Hum Genet. 1980;32(3):314–31.
39. Boman IA, Klemetsdal G, Nafstad O, Blichfeldt T, Vage DI. Impact of two
myostatin (MSTN) mutations on weight gain and lamb carcass classification
in Norwegian White Sheep (Ovis aries). Genet Sel Evol. 2010;42:4.
40. Clop A, Marcq F, Takeda H, Pirottin D, Tordoir X, Bibe B, et al. A mutation
creating a potential illegitimate microRNA target site in the myostatin gene
affects muscularity in sheep. Nat Genet. 2006;38(7):813–8.
41. McPherron AC, Lawler AM, Lee SJ. Regulation of skeletal muscle mass in mice
by a new TGF-beta superfamily member. Nature. 1997;387(6628):83–90.
42. Schuelke M, Wagner KR, Stolz LE, Hubner C, Riebel T, Komen W, et al.
Myostatin mutation associated with gross muscle hypertrophy in a child.
N Engl J Med. 2004;350(26):2682–8.
43. Stinckens A, Luyten T, Bijttebier J, Van den Maagdenberg K, Dieltiens D,
Janssens S, et al. Characterization of the complete porcine MSTN gene and
expression levels in pig breeds differing in muscularity. Anim Genet.
2008;39(6):586–96.
44. Kreuzer S, Reissmann M, Brockmann GA. Gene test to elucidate the ETEC
F4ab/F4ac receptor status in pigs. Vet Microbiol. 2013;162(1):293–5.
45. Green P, Falls K, Crooks S. Documentation for CRIMAP, version 2.4. St. Louis,
Missouri USA: Washington University School of Medicine; 1990.
46. Seaton G, Hernandez J, Grunchec JA, White I, Allen J, De Koning DJ, Wei W,
Berry D, Haley C, Knott S: GridQTL: A Grid Portal for QTL Mapping of
Compute Intensive Datasets. Belo Horizonte, Brazil: Proceedings of the 8th
World Congress on Genetics Applied to Livestock Production,: 13–18
August 2006; 2006
47. Churchill GA, Doerge RW. Empirical threshold values for quantitative trait
mapping. Genetics. 1994;138(3):963–71.
48. Visscher PM, Thompson R, Haley CS. Confidence intervals in QTL mapping
by bootstrapping. Genetics. 1996;143(2):1013–20.
Page 12 of 12
Submit your next manuscript to BioMed Central
and take full advantage of:
• Convenient online submission
• Thorough peer review
• No space constraints or color figure charges
• Immediate publication on acceptance
• Inclusion in PubMed, CAS, Scopus and Google Scholar
• Research which is freely available for redistribution
Submit your manuscript at
www.biomedcentral.com/submit