Transcriptome analysis between invasive Pomacea canaliculata and indigenous Cipangopaludina cahayensis reveals genomic divergence and diagnostic microsatellite/SSR markers
Bạn đang xem bản rút gọn của tài liệu. Xem và tải ngay bản đầy đủ của tài liệu tại đây (2.52 MB, 13 trang )
Mu et al. BMC Genetics (2015) 16:12
DOI 10.1186/s12863-015-0175-2
RESEARCH ARTICLE
Open Access
Transcriptome analysis between invasive
Pomacea canaliculata and indigenous
Cipangopaludina cahayensis reveals genomic
divergence and diagnostic microsatellite/SSR
markers
Xidong Mu1, Guangyuan Hou2, Hongmei Song1, Peng Xu2, Du Luo1, Dangen Gu1, Meng Xu1, Jianren Luo1,
Jiaen Zhang3 and Yinchan Hu1*
Abstract
Background: Pomacea canaliculata is an important invasive species worldwide. However, little is known about the
molecular mechanisms behind species displacement, adaptational abilities, and pesticide resistance, partly because
of the lack of genomic information that is available for this species. Here, the transcriptome sequences for the
invasive golden apple snail P. canaliculata and the native mudsnail Cipangopaludina cahayensis were obtained by
next-generation-sequencing and used to compare genomic divergence and identify molecular markers.
Results: More than 46 million high quality sequencing reads were generated from P. canaliculata and C. cahayensis
using Illumina paired-end sequencing technology. Our analysis indicated that 11,312 unigenes from P. canaliculata
and C. cahayensis showed significant similarities to known proteins families, among which a total of 4,320 specific
protein families were identified. KEGG pathway enrichment was analyzed for the unique unigenes with 17 pathways
(p-value < 10−5) in P. canaliculata relating predominantly to lysosomes and vitamin digestion and absorption, and
with 12 identified in C. cahayensis, including cancer and toxoplasmosis pathways, respectively. Our analysis also
indicated that the comparatively high number of P450 genes in the P. canaliculata transcriptome may be associated
with the pesticide resistance in this species. Additionally, 16,717 simple sequence repeats derived from expressed
sequence tags (EST-SSRs) were identified from the 14,722 unigenes in P. canaliculata and 100 of them were examined
by PCR, revealing a species-specific molecular marker that could distinguish between the morphologically similar
P. canaliculata and C. cahayensis snails.
Conclusions: Here, we present the genomic resources of P. canaliculata and C. cahayensis. Differentially expressed
genes in the transcriptome of P. canaliculata compared with C. cahayensis corresponded to critical metabolic
pathways, and genes specifically related to environmental stress response were detected. The CYP4 family of P450
cytochromes that may be important factors in pesticide metabolism in P. canaliculata was identified. Overall, these
findings will provide valuable genetic data for the further characterization of the molecular mechanisms that
support the invasive and adaptive abilities of P. canaliculata.
Keywords: Biological invasion, Pomacea canaliculata, Cipangopaludina cahayensis, EST-SSR, Transcriptome
* Correspondence:
1
Pearl River Fisheries Research Institute, Chinese Academy of Fishery
Sciences, Key Laboratory of Tropical&Subtropical Fishery Resource
Application&Cultivation, Ministry of Agriculture, Guangzhou 510380, China
Full list of author information is available at the end of the article
© 2015 Mu et al.; licensee BioMed Central. This is an Open Access article distributed under the terms of the Creative
Commons Attribution License ( which permits unrestricted use, distribution, and
reproduction in any medium, provided the original work is properly credited. The Creative Commons Public Domain
Dedication waiver ( applies to the data made available in this article,
unless otherwise stated.
Mu et al. BMC Genetics (2015) 16:12
Background
Biologically invasive species are one of the major threats
to global biodiversity, and they can cause substantial
economic losses as well as pose a public health risk
[1-8]. The golden apple snail (Pomacea canaliculata) is
native to South America and is beginning to emerge
worldwide, among others China. It has become a highly
damaging invasive species, affecting agriculture and fisheries, as well as pubilc heatlth [9-14]. The snail was first
introduced to Zhongshan (Guangdong Province, China)
as a human food source or aquarium pet [15]. It adapted
quickly and is now found at least 11 provinces in southern China [16]. Currently, P. canaliculata has invaded
local habitats, including rice fields and ponds, causing
severe crop damage and substantial ecological destruction such as the destruction of aquatic product resources [9,17,18] and the displacement of the native
mudsnail Cipangopaludina cahayensis. In addition, P.
canaliculata serves as a major intermediate host for the
nematode Angiostrongylus cantonensis, which has led
to the emergence of human eosinophilic meningitis in
China [16,19].
Genetic divergence between the alien and native species
may play an important role in the highly adaptive nature
of P. canaliculata. However, few genomic resources are
available for P. canaliculata and C. cahayensis, and this
lack of information has hindered the understanding of
possible molecular mechanisms [20]. Previous studies
using mitochondrial DNA have provided insights into
the continental expansion and molecular phylogeny of
P. canaliculata [12,13,18,21-24], but any genomic factors pertaining to competition and displacement are still unknown.
Recently, next generation sequencing technologies have
revolutionized the fields of genomics and transcriptomics,
providing an opportunity for the rapid and cost-effective
generation of genome-scale data [25]. These technologies
have been applied successfully in many invasive species, including Bemisia tabaci [26,27], Anguillicola crassus [28],
Aedes aegypti [29] and Mytilus galloprovincialis [30]. In the
present study, we sequenced and assembled the transcriptome of the native C. cahayensis from mainland China and
the invasive P. canaliculata using de novo sequence assembly. Transcriptome divergence between the native and
invasive species was examined to identify important candidate genes related to competitiveness, resistance to environmental stress, and invasive potential. This approach
enabled the prediction of expressed sequence tag-simple
sequence repeat (EST-SSR) markers to facilitate gene mapping and genetic variation analysis in P. canaliculata.
Result and discussion
Sequencing data and de novo assembly
Using Illumina paired-end sequencing technology, the
transcriptome sequencing produced 65,198,546 reads
Page 2 of 13
with a total length of 6.5 Gb for C. cahayensis, which
generated 161,941 contigs and 151,518 unigenes
(Table 1). For P. canaliculata, 94,808,488 reads were obtained, and 94,518 contigs and 76,082 unigenes were
generated (Table 1). Using the SOAP de novo assembly
program, high quality reads were assembled into 160,256
contigs longer than 200 bp, with a mean length of
1,080 bp and a N50 of 1,004 bp for the native C.
cahayensis. For P. canaliculata, 94,518 contigs longer
than 200 bp, with a mean length of 916 bp and a N50 of
1,854 bp were generated. In C. cahayensis, the lengths of
104,713 (65.34%) of the contigs ranged from 200 to
500 bp, 28,918 (18.04%) contigs ranged from 500 to
1,000 bp, and 15,191 (9.50%) contigs ranged from 1000
to 2,000 bp; the remaining contigs were longer than
2,000 bp (Figure 1). In P. canaliculata, the lengths of
41,544 (43.95%) of the contigs ranged from 200 to
500 bp, 19,289 (20.41%) contigs ranged from 500 to
1000 bp, and 17,619 (18.16%) contigs ranged from 1000
to 2,000 bp; the remaining contigs were longer than
2,000 bp. The related data were submitted to the NCBI
data under accession numbers: SRA191276 (P. canaliculata) and SRA192725 (C. cahayensis).
Functional annotation
To annotate the C. cahayensis and P. canaliculata sequences, searches were conducted against the NCBI
non-redundant protein (Nr) database, the Swiss-Prot
protein database, Cluster of Orthologous Groups (COG),
and Kyoto Encyclopedia of Genes and Genomes (KEGG)
database using BLASTX (E-value ≤ 1 × 10⁻⁵). The alignment results were used to predict unigene transcriptional orientations and coding regions. Gene ontology
(GO) terms were assigned to the annotated sequences
and 14,864 sequences from C. cahayensis and 56,300 sequences from P. canaliculata were categorized into the
three GO categories, biological process, cellular component, and molecular function (Figure 2). We found that
the distribution and percentages of the assigned gene
functions were similar in both species. In the biological
process category, death (22.1%) was prominent, while in
the molecular function category, cell (30%–31%) and cell
Table 1 Transcriptome summary for indigenous
Cipangopaludina cahayensis and Pomacea canaliculata
Cipangopaludina
cahayensis
Pomacea
canaliculata
Total number of reads
65,198,546
94,808,488
Total base pair (bp)
6,519,854,600
3,507,914,056
Total number of contigs
161,941
94,518
Mean length of contigs (bp)
1,080
916
Total number of Unigenes
151,518
76,082
Mean length of Unigenes (bp) 1,004
1,854
Mu et al. BMC Genetics (2015) 16:12
Page 3 of 13
Figure 1 Assessment of transcriptome assembly quality of Cipangopaludina cahayensis (A) and Pomacea canaliculata (B).
part (30%–31%) were prominently represented. In the
cellular component category, binding (47.8%–49%) was
predominant, followed by catalytic activity (36%). Overall, the transcriptome sequencing yielded a great number
of unique genes in the two species, in agreement with
similar results reported in other species [20]. Several differences were noted between the two species, with more
genes noted in P. canaliculata (56,300 genes) compared
with in C. cahayensis (14,864 genes). Furthermore, the
percentage of genes annotated as metabolic process/
pigmentation under the biological process category was
higher in P. canaliculata (15.7%/7.46%) compared with
C. cahayensis (7.93%/1.6%), implying a possible relation
to various environmental stressors. Moreover, the percentage of genes annotated as metallochaperone activity
and translation regulator activity under the cellular component category was much higher in P. canaliculata
compared with C. cahayensis. These results indicated
that P. canaliculata might contain additional genes that
are able to confer high competitiveness or strong resistance to envrionmental stress compared to C. cahayensis.
Furthermore, all of the C. cahayensis and P. canaliculata unigenes were subjected to functional prediction
and classification using the COG database. The unigenes
were assigned to 25 COG categories (Figure 3), among
which “general function prediction” represented the largest group (4,081 (17.9%) genes for C. cahayensis; 4,346
(19%) genes for P. canaliculata). For C. cahayensis, the
next most represented category was translation, ribosomal
structure and biogenesis (1915 (8.41%) genes), while for P.
canaliculata, replication, recombination and repair (1,883
(8.23%) genes,) was the next most represented category.
To identify differentially regulated biological pathways
between C. cahayensis and P. canaliculata, the annotated unigenes were mapped to reference pathways in
the KEGG database [31]. We found that 13,351 C.
cahayensis unigenes mapped to 276 pathways and
13,808 P. canaliculata genes mapped to 240 pathways,
with different pathway associations between the two species. In C. cahayensis, the largest number of genes included cancer (577 (4.32%) genes; pathway: ko05200),
focal adhesion (496 (3.72%) genes; pathway: ko04510),
ubiquitin mediated proteolysis (427 (3.2%) genes; pathway: ko04120), and Huntington’s disease (333 (2.49%)
genes; pathway: ko05016). In P. canaliculata, the predominant pathways were metabolic (2241 (16.23%)
Mu et al. BMC Genetics (2015) 16:12
Page 4 of 13
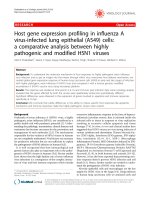
Figure 2 Comparing functional annotations of contigs between Cipangopaludina cahayensis (red) and invasive Pomacea canaliculata
(blue) transcriptome. The distribution of gene ontology (GO) terms is given for each of each of the three main GO categories (biological
process, molecular function, and cellular component).
Mu et al. BMC Genetics (2015) 16:12
Page 5 of 13
Figure 3 Clusters of orthologous group (COG) classifications for Cipangopaludina cahayensis (A) and Pomacea canaliculata (B)
transcriptome. All unigenes were aligned to COG database to predict and classify possible functions.
genes; pathway: ko01100), cancer (530 (3.84%) genes;
pathway: ko05200), focal adhesion (415 (3.01%) genes;
pathway: ko04510) and Huntington’s disease (348
(2.52%) genes; pathway: ko05016). Collectively, these
transcriptome sequences and pathway annotations provide an essential resource for further screening and expression analysis of candidate genes related to the
invasive abilities of P. canaliculata.
Analysis of protein families and genes
A total of 15,632 protein families were identified based
on sequence similarities (Figure 4); 13,490 families for C.
cahayensis and 13,453 families for P. canaliculata. When
the transcriptomes of the two species were compared, a
total of 11,312 protein families were found to be conserved between the C. cahayensis and P. canaliculata
transcriptomes, and 2142 and 2178 families for P. canaliculata and C. cahayensis, respectively, were found to
be differentially expressed. Some of the differentially
expressed proteins may be responsible for the unique
features of each of these species. An enriched analysis of
the GO terms assigned to the 11,312 conserved protein
families, identified 12 protein families that were significantly enriched (Table 2), including RNA transport (380
(2.6%) genes), spliceosome (383 (2.62%) genes), and
endoplasmic reticulum protein processing (358 (2.45%)
genes), which are related to protein transportation and
metabolism. The finding that GO terms related to protein transportation and metabolism were enriched is inconsistent with the results reported for other invasive
species such as Bemisia tabaci [32], possibly suggesting
the critical roles of these pathways in these two species.
We identified a total of 12 protein families (p-value < 10−5)
encoded by the differentially expressed genes in C.
cahayensis (Table 3), including those assigned to pathways
pertaining to cancer (97 (6.92%) genes), toxoplasmosis (87
(6.21%) genes), and apoptosis (71 (5.06%) genes). In P.
canaliculata, we identified a total of 17 protein families
(p-value < 10−5) encoded by the differentially expressed
genes, including those assigned to pathways pertaining to
lysosomes (84 (4.02%) genes), vitamin digestion and
absorption (71 (3.4%) genes), ECM-receptor interaction
Mu et al. BMC Genetics (2015) 16:12
Page 6 of 13
Figure 4 Protein families from the transcriptomes of
Cipangopaludina cahayensis and Pomacea canaliculata. Protein
families were identified for all the translated genes of the two
transcriptomes using Blastp and a Markov Cluster algorithm (MCL),
with the total number of protein families belonging to each
category listed in the figure for the 11,312 protein families
belonging to the two transcriptomes.
(57 (2.73%) genes), and metabolism of xenobiotics by
cytochrome P450 (49 (2.35%) genes). We used reads per
kilobase per million mapped reads (RPKM) to analyze the
expression levels of P. canaliculata genes and identified
20 annotated genes with very high expression levels
(RPKM > 2000), which were predicted to be involved in
cell and protein structure (ferritin [Swiss-Prot: C7TNT3]
and augerpeptide hhe53 [Swiss-Prot: P0CI21]) and ribosomes (60S ribosomal proteins and 40S ribosomal
protein S8) (Table 4).
P. canaliculata has become an important pest in
China and has exhibitied resistance to pesticides such as
metaldehyde and niclosamide ethanolamine salt [33-35];
however, the molecular mechanisms underlying this resistance are still unclear. To detect unique resistance-
related sequences, the unigenes were edited manually to
remove redundant and overlying short sequences and
the edited sequences were then used to identify genes
encoding proteins related to the metabolism of pesticides. We identified P450 cytochromes (CYPs), a major
family of enzymes involved in detoxification and metabolism, as potential major detoxification component
proteins [36-38]. Previous studies have reported a correlation between increased exposure to metabolic neurotoxic pesticides and over-expression of P450 genes in
many pest species [39-46]. In our study, 210 P450related sequences were identified in P. canaliculata and
only 159 were found in C. cahayensis, indicating that the
number of P450 genes may be one of the contributory
factors to pesticides resistance in P. canaliculata. While
the number of P450 genes detected is not necessarily
related to gene expression levels, an increased gene
number of genes may increase metabolic enzyme detoxification activity, and contribute to the development of a
progressive resistance in P. canaliculata. These findings
will enhance the understanding of pesticide metabolism
and help in the development of effective treatments for
invasive species. To investigate the relationship between
the P450 sequences from both species a phylogenetic
tree was constructed using the neighbor joining (NJ)
method in conjunction with bit-score values. Sixty of the
sequences showed high homology and were classified
into the CYP2, CYP3, and CYP4 families based on their
similarity to sequences in the Nr database. These sequences clustered into three clades in the phylogentic
tree that corresponded to the same three P450 families
(Figure 5). We found a high concentration of P. canaliculata genes in the CYP4 family, possibly implying that
these genes played important roles in the metabolism of
pesticides in this invasive species. While these finding
are insightful, they need to be examined further using
Table 2 Statistically common enriched Gene Ontology (GO) terms between Cipangopaludina cahayensis and Pomacea
canaliculata for the 11,312 protein families
KO term
No. of DEGs
No. of genes
p-value
Pathways
ko03050
87 ((0.6%))
104 (0.38%)
1.177307e-10
proteasome
ko04141
358 (2.45%)
533 (1.96%)
1.450501e-10
protein processing in endoplasmic reticulum
ko03013
380 (2.6%)
571 (2.1%)
2.417814e-10
RNA transport
ko00190
222 (1.52%)
315 (1.16%)
7.983256e-10
oxidative phosphorylation
ko00020
111 (0.76%)
148 (0.54%)
7.634897e-08
citrate cycle (TCA cycle)
ko00010
143 (0.98%)
199 (0.73%)
1.168776e-07
Glycolysis/Gluconeogenesis
ko04130
65 (0.45%)
80 (0.29%)
2.460867e-07
SNARE interactions in vesicular transport
ko00280
131 (0.9%)
183 (0.67%)
5.546992e-07
Valine, leucine and isoleucine degradation
ko03040
383 (2.62%)
609 (2.24%)
2.553937e-06
spliceosome
ko00030
69 (0.47%)
89 (0.33%)
2.854414e-06
pentose phosphate pathway
ko04910
287 (1.97%)
453 (1.67%)
1.953777e-05
insulin signaling pathway
ko04380
155 (1.06%)
232 (0.85%)
3.401093e-05
osteoclast differentiation
Mu et al. BMC Genetics (2015) 16:12
Page 7 of 13
Table 3 Statistically unique protein families in Cipangopaludina cahayensis and Pomacea canaliculata
KO term
No. of DEGs*
No. of genes**
p-value
Pathway
Cipangopaludina cahayensis
ko05145
87 (6.21%)
316 (2.37%)
8.262866e-18
toxoplasmosis
ko04210
71 (5.06%)
251 (1.88%)
2.041735e-15
apoptosis
ko05222
64 (4.56%)
264 (1.98%)
8.751653e-11
small cell lung cancer
ko05144
23 (1.64%)
55 (0.41%)
1.741389e-09
malaria
ko04621
47 (3.35%)
190 (1.42%)
1.417618e-08
NOD-like receptor signaling pathway
ko05014
29 (2.07%)
102 (0.76%)
3.722068e-07
amyotrophic lateral sclerosis (ALS)
ko05200
97 (6.92%)
577 (4.32%)
1.527724e-06
pathways in cancer
ko05146
39 (2.78%)
170 (1.27%)
1.852183e-06
amoebiasis
ko00590
29 (2.07%)
119 (0.89%)
1.106722e-05
arachidonic acid metabolism
ko05416
35 (2.5%)
158 (1.18%)
1.392634e-05
viral myocarditis
ko05210
27 (1.93%)
116 (0.87%)
5.248618e-05
colorectal cancer
ko05323
20 (1.43%)
76 (0.57%)
7.901248e-05
rheumatoid arthritis
Pomacea canaliculata
ko00940
22 (1.05%)
23 (0.17%)
1.61937e-17
Phenylpropanoid biosynthesis
ko04977
71 (3.4%)
172 (1.25%)
7.427869e-17
vitamin digestion and absorption
ko00140
52 (2.49%)
120 (0.87%)
1.004048e-13
Steroid hormone biosynthesis
ko04512
57 (2.73%)
158 (1.14%)
5.811497e-11
ECM-receptor interaction
ko00830
49 (2.35%)
126 (0.91%)
6.057395e-11
Retinol metabolism
ko00980
49 (2.35%)
129 (0.93%)
1.610139e-10
Metabolism of xenobiotics by cytochrome P450
ko00130
24 (1.15%)
41 (0.3%)
2.008634e-10
Ubiquinone and other terpenoid-quinone biosynthesis
ko00591
45 (2.15%)
116 (0.84%)
4.002728e-10
linoleic acid metabolism
ko00533
22 (1.05%)
38 (0.28%)
1.543998e-09
glycosaminoglycan biosynthesis - keratan sulfate
ko00740
21 (1.01%)
37 (0.27%)
5.989671e-09
riboflavin metabolism
ko00360
26 (1.24%)
54 (0.39%)
1.007722e-08
Phenylalanine metabolism
ko00982
47 (2.25%)
142 (1.03%)
6.201926e-08
drug metabolism-cytochrome P450
ko00627
41 (1.96%)
119 (0.86%)
1.229762e-07
aminobenzoate degradation
ko04142
84 (4.02%)
321 (2.32%)
1.553304e-07
lysosome
ko00590
45 (2.15%)
138 (1%)
1.921892e-07
arachidonic acid metabolism
ko00983
47 (2.25%)
147 (1.06%)
2.012819e-07
drug metabolism-other enzymes
ko02020
16 (0.77%)
31 (0.22%)
2.208469e-06
two-component system
*The number of differentially expressed genes (DEGs) that belong to a KEGG pathway.
**The total number of orthologous genes that belong to a KEGG pathway.
RACE technology and RT-PCR before they can be
accepted.
Detection of intraspecific genetic variation
EST-SSRs serve as effective molecular markers for genetic
mapping, comparative genomics and population genetic
analysis in many invasive species. Characterization of
EST-SSRs may enable breakthroughs in the detection of
cryptic species, aid in defining the number and location
of establishment events, and help trace the routes of
alien species as they spread into new regions [47-51].
Compared with traditional methods, EST-SSRs are more
transferable and advantageous than random genomic
SSRs, enabling improved genetic studies related to population genetics [52]. Unitl now, only a few SSRs have been
identified in P. canaliculata [20,53], which has hampered
marker applications in this species. To further understand
the invasive and adaptive mechanism in P. canaliculata,
six P. canaliculata samples were collected from three. invasive regions/habitats in mainland China and examined
for polymorphisms. A total of 16,717 potential SSRs were
identified. As shown in Table 5, the di-nucleotide repeats
were the most abundant (10,554, 63.1%), followed by tri(4,480, 26.8%), tetra- (1,021, 6.10%), hexa-(341, 2.0%), and
penta-nucleotide (321, 1.9%) repeats. The most abundant
repeat combination was AG/CT (40.4%), followed by
Mu et al. BMC Genetics (2015) 16:12
Page 8 of 13
Table 4 Highly expressed genes in the transcriptome of Pomacea canaliculata
Gene ID
Number of reads*
RPKM**
Swissprot annotation
E-value
370469
7963.2
Ferritin
2.00E-79
Unigene0070417
178665
6508.7
Temptin
4.00E-22
Unigene0099572
1758831
6234.6
Auger peptide hhe53
1.00E-11
Unigene0095431
309172
5711.9
Cysteine-rich secretory protein Mr30
6.00E-50
Unigene0102121
48348
5217.9
Polyubiquitin
7.00E-39
Unigene0069599
333123
4748.7
Elongation factor 1-alpha, somatic form
0
Unigene0122375
169714
4112.1
Fibrinogen C domain-containing protein 1-B
1.00E-53
Unigene0115512
780688
4335.5
Paramyosin
0
Unigene0087254
227698
4289.3
Metalloproteinase inhibitor 3
7.00E-07
Unigene0114631
361080
4118.2
Actin, adductor muscle
0
Unigene0069690
284495
4020.1
Tubulin beta chain
0
Unigene0121686
60035
3534.1
60S ribosomal protein L36
2.00E-31
Unigene0006316
82422
2973.3
40S ribosomal protein S8
1.00E-89
Unigene0102783
157410
2712.7
60S ribosomal protein L5
1.00E-123
Unigene0033792
48918
2226.8
60S ribosomal protein L24
4.00E-57
Unigene0099167
208322
2530.9
Myosin, essential light chain, adductor muscle
1.00E-47
Unigene0083872
75749
2346.9
60S ribosomal protein L44
3.00E-47
Unigene0099241
78798
2247.8
60S ribosomal protein L7a
2.00E-113
Unigene0034297
55506
2045.0
60S ribosomal protein L23a
1.00E-57
Unigene0123696
49155
2011.4
Ubiquitin-60S ribosomal protein L40
7.00E-68
Unigene0034597
*The total number of reads mapped to each gene.
**Gene expression levels were determined by calculating the number of reads for each gene and then normalizing to RPKM.
AT/AT (18.3%), AAG/CTT (7.8%), AAT/ATT (4.7%),
AC/GT (4.0%) and ATC/ATG (3.4%) (Figure 6A).
Based on the SSR-containing sequences, 8,428 SSR
primers were developed and 100 SSRs (Additional file
1: Table S1) were selected to design EST-SSR primers
based on the information (name and longer length of
gene identified). Of the 100 SSRs examined by PCR
amplification, 26 (26.0%) PCR products exhibited more
than one band, which may have resulted from high heterozygosity, while the others SSRs generated bands of
the expected length. In total, 143 amplicons were detected from the 100 primer pairs. The number of
amplicons per primer pair ranged from one to three,
with an average of 1.43 (Figure 6B). To estimate ESTSSR marker novelty, the amplicons were evaluated
against previously reported P. canaliculata markers
[20,53]. We found that the 100 EST-SSR markers had
not been reported previously. Thus, other EST-SSR
primers can be designed from the 8,428 identified ESTSSR to contribute further to the characterization of the
invasive and adaptive processes. P. canaliculata and C.
cahayensis have very similar morphological features,
especially at the immature stages, which makes early
identification difficult. Therefore, a molecular means
for the identification and characterization of these two
species is essential. Using the P. canaliculata SSR
primers, we identified a unique amplicon (FSLssr64;
Additional file 1: Table S1) that was present in P. canaliculata but absent in C. cahayensis (Figure 6C). Thus,
FSLssr64 could serve as a species-specific molecular
marker to distinguish these two species and aid in the
prevention and detection of invasive P. canaliculata in
different regions.
Conclusions
The transcriptomes of the invasive golden apple snail
(P. canaliculata) and the native mudsnail (C. cahayensis)
were characterized using the Illumina next-generation
sequencing technique. This allowed the identification of
a number of the differentially expressed genes, some of
which were found to be related specifically to environmental stress; for example, the CYP4 family of cytochrome P450s. These findings can contribute to a better
understanding of pesticide metabolism and will provide
valuable genetic data to facilitate future studies towards
understanding the successful invasive and adaptive
mechanism of P. canaliculata. In addition, the 16,717
EST-SSRs predicted in this study should provide a solid
genetic basis for molecular markers development and
aid in ecological studies pertaining to genetic variation
in P. canaliculata.
Mu et al. BMC Genetics (2015) 16:12
Page 9 of 13
Figure 5 Neighbor-joining phylogenetic analysis of cytochrome P450 from Cipangopaludina cahayensis (CC) and Pomacea canaliculata
(PC). CYP represent cytochrome P450.
Methods
Ethics statement
Sample collection, RNA extraction, and next generation
sequencing
This study was approved by the Animal Care and Use
committee of Aquatic Invasive Risk Assessment Center,
Pearl River Fisheries Research Institute, Chinese Academy
of Fishery Sciences.
P. canaliculata (20–25 mm shell length; 25.23 ± 0.34 g;
10 individuals) and C.cahayensis (20.4–23.2 mm shell
length; 22.43 ± 0.46 g; 10 individuals) were collected
without the use of chemicals and grown in the Aquatic
Mu et al. BMC Genetics (2015) 16:12
Page 10 of 13
Table 5 Summary of EST-SSRs identified in the Pomacea
canaliculata transcriptome
Searching item
Numbers
Total number of Unigene examined
135,121
Total size of examined Unigene (bp)
117,356,620
Total number of identified SSRs
16,717
Number of Unigene containing SSR
14,722
Number of Unigene containing more than 1 SSR
1,748
Number of SSRs present in compound formation
753
Di-nucleotide
10,554 (63.1%)
Tri-nucleotide
4,480 (26.8%)
Tetra-nucleotide
1,021 (6.10%)
Penta-nucleotide
321 (1.9%)
Hexa-nucleotide
341 (2.0%)
Invasive Risk Assessment Center, Pearl River Fisheries
Research Institute, Chinese Academy of Fishery Sciences,
Guangzhou, China. Tissues samples from the foot, muscle,
liver, and kidney were rinsed separately with water pretreated by diethyl pyrocarbonate to cleanse the samples
and inactivate RNases [32]. Total RNA of each sample
was extracted using a Trizol Kit (Promega) according to
the manufacturer’s instructions. RNA quality was assessed
using a 2100 Bioanalyzer (Agilent Technologies, Santa
Clara, CA) and RNase-free agarose gel electrophoresis,
with the total RNA concentration measured using a 2100
Bioanalyzer. Equal amounts of RNA from each sampled
tissue were combined for subsequent experiments and
RNA purity was assessed at absorbance ratios of OD260/
280 and OD260/230. RNA integrity was confirmed by 1%
agarose gel electrophoresis.
Figure 6 Frequencies and polymorphisms of classified SSR repeat types and molecular characterization of Pomacea canaliculata. (A):
The graph shows the frequency of each repeat motif classified, considering the sum of the frequencies for complementary sequences (for
example, the sum of frequencies for the dinucleotides AC and its complementary GT). (B) Polymorphism and validation of a subset of the
microsatellite primer pairs for six P. canaliculata samples by agarose-gel profiling. 1–6 represent GZ1, GZ2, HN1, HN2, SG1, and SG2, respectively.
(C) The SSR primer (FSLssr64) for species-specific identification between P. canaliculata and C. cahayensis.
Mu et al. BMC Genetics (2015) 16:12
De novo assembly and gene annotation of Illumina reads
Transcriptome de novo assembly was carried out with
the short-read assembly program Trinity [54]. The Trinity program has three independent modules: Inchworm,
Chrysalis, and Butterfly. Inchworm assembled the RNA
sequencing data into unique transcripts that we called
Inchworm contigs; Chrysalis clustered the Inchworm
contigs, then constructed complete de Bruijn graphs for
each cluster and partitioned the full read set among
these disjoint graphs; and Butterfly processed the individual graphs in parallel, tracing the paths based on
reads and pair-end information, ultimately reporting
full-length transcripts for alternatively spliced isoforms.
After assembly, the TIGR Gene Indices clustering tools
(TGICL) [55] were used to cluster and remove redundant transcripts. The remaining sequences after TGICL
clustering were defined as unigenes. BLASTX searches
(E-value < 10−5) were conducted to screen the unigenes
against the Nr database ( />Swiss-Prot protein database (asy. ch/sprot/),
the KEGG pathway database ( />kegg/), and COG database (.
gov/cog/). High scoring alignments were used to determine the unigene sequence direction. When alignment
results varied between databases, the results from the
Nr database were preferentially selected, followed by
the Swiss-Prot, KEGG and COG databases. When a
unigene sequence did not match entries in any of these
databases, ESTScan was used to predict the coding regions and determine sequence directionality.
Functional annotation and differential expression analysis
of unigenes
Unigene sequences were aligned to the protein databases
(listed above) using BLASTX (E-value < 10−5) and to the
nucleotide sequence database Nt (E-value < 10−5) using
BLASTN to obtain both protein and functional annotation information. Based on the annotations in the protein databases, Blast2GO [56] was used to obtain GO
annotations for the aligned unigene sequences and the
Web Gene Ontology Annotation Plot (WEGO) software
[57] was used to establish GO functional classifications
for all unigenes. The unigenes were aligned to the COG
database to predict and classify possible functions and
the KEGG database was used [31] to obtain pathway annotations (E-value threshold 10−5). RPKM was used to
calculate unigene expression levels, which eliminated the
influence of gene length and sequencing level on the estimation of gene expression
Page 11 of 13
showed high sequence homology were eliminated and
presumed to be allelic variants or different parts of the
same gene. Thirty P450 gene sequences (Additional file 1:
Table S1) with a range of bit-score values were identified
and aligned using MUSCLE [58], and their phylogenetic
relationships and genotype classifications were determined
using MEGA 5 software [59]. The NJ method [60] was
used to create phylogenetic trees, with positions containing alignment gaps or missing data eliminated via pairwise
deletion. Tree branch strength was evaluated via a bootstrap analysis of 1000 replication trees.
Development and detection of EST-SSR markers
MIcroSAtellite (MISA) ( />misa/) was used for microsatellite mining. SSRs were considered to contain motifs of two to six nucleotides and a
minimum of five contiguous repeat units. Based on the
MISA results, Primer 6.0 was used with the default settings to design primer pairs that would generate PCR
products ranging from 100 to 280 bp in length. A total of
100 pairs of primers were designed (Additional file 1:
Table S1) and validated by PCR in six P. canaliculata samples, including Guangzhou 1–2 (GZ1-2), Hainan1-2
(HN1-2), and Shaoguang1-2 (SG1-2) that were collected
from three major invasive regions in Guangdong Province,
China. PCR amplification was carried out as follows: an
initial denaturation at 94°C for 4 min; 33 cycles of 94°C
for 1 min (denaturation), 50°C for 30 s (annealing), and
72°C for 45 s (extension); followed by a final extension at
72°C for 8 min. The PCR products were analyzed by electrophoresis on a 8.0% non-denaturing polyacrylamide gel
and silver stained.
Additional file
Additional file 1: Table S1. 60 P450-related gene sequences for
phylogenetic tree in Cipangopaludina cahayensis and Pomacea canaliculata.
Competing interests
The authors declare that they have no competing interests.
Authors’ contributions
XDM designed the study, analyzed the data, and drafted the whole
manuscript. GYH, PX, and HMS extracted the RNA, analyzed the
bioinformatics data and participated in the manuscript revision. HMS
extracted the RNA and helped draft the manuscript. DL, DEG and MX
collected samples, assisted with data analysis. JRL and JEZ analyzed the data
and helped draft the manuscript. YCH co-designed the experiments and
obtained the funds. All authors read and approved the final manuscript.
Acknowledgements
This work was supported by the National Natural Science Foundation of
China (31300468, u1131006) and Agricultural Biological Resources Protection
and Utilization Project (2130108).
Analysis of genes related to pesticide
BLASTX searches against the Nr database (E-value < 10−5)
were used to detect genes related to pesticide resistance.
Sequences that returned redundant BLAST results or
Author details
1
Pearl River Fisheries Research Institute, Chinese Academy of Fishery
Sciences, Key Laboratory of Tropical&Subtropical Fishery Resource
Application&Cultivation, Ministry of Agriculture, Guangzhou 510380, China.
Mu et al. BMC Genetics (2015) 16:12
2
Center for Applied Aquatic Genomics, Chinese Academy of Fishery Sciences,
Beijing 100141, China. 3Department of Ecology, College of Agriculture, South
China Agricultural University, Key Laboratory of Ecological Agriculture,
Guangzhou 510642, China.
Received: 26 August 2014 Accepted: 27 January 2015
References
1. Pimentel DS, McNair J, Janecka J, Wightman J, Simmonds C, O’Connell C,
et al. Economic and environmental threats of alien plant, animal, and
microbe invasions. Agr Ecosyst Environ. 2001;84:1–20.
2. Pimental D, Zuniga R, Morrison D. Update on the environmental and
economic costs associated with alien-invasive species in the United States.
Ecol Econ. 2005;52:273–88.
3. Simberloff D. The politics of assessing risk for biological invasions: the USA
as a case study. Trends Ecol Evol. 2005;20:216–22.
4. Kennedy TA, Naeem S, Howe KM, Knops JMH, Tilman D, Reich P.
Biodiversity as a barrier to ecological invasion. Nature. 2002;417:636–8.
5. Allendorf FW, Lundquist LL. Introduction: population biology, evolution, and
control of invasive species. Conserv Biol. 2003;17:24–30.
6. Lowe MR, Wu W, Peterson MS, Brown-Peterson NJ, Slack WT, Schofield PJ.
Survival, growth and reproduction of non-native Nile tilapia II: fundamental
niche projections and invasion potential in the northern Gulf of Mexico.
PLoS One. 2012;7:e41580.
7. Carey MP, Wahl DH. Native fish diversity alters the effects of an invasive
species on food webs. Ecology. 2010;91:2965–74.
8. Ma YZ. Exotic invasion losses an annual 200$ plus billion. Econ weekly.
2009;21:43–5.
9. Carlsson NOL, Bronmark C, Hansson L. Invading herbivory: the golden apple
snail alters ecosystem functioning in Asian wetlands. Ecology. 2004;85:1575–80.
10. Kwong KL, Robert KY, Qiu JW. The potential of the invasive snail Pomacea
canaliculata as a predator of various life-stages of five species of freshwater
snails. Malacologia. 2009;51:343–56.
11. Kwong KL, Dudgeon D, Wong PK, Qiu JW. Secondary production and diet
of an invasive snail in freshwater wetlands: implications for resource
utilization and competition. Biol Invasions. 2010;12:1153–64.
12. Rawlings TA, Hayes KA, Cowie RH, Collins TM. The identity, distribution, and
impacts of non-native apple snails in the continental United States. BMC
Evol Biol. 2007;7:97.
13. Hayes KA, Cowie RH, Jørgensen A, Schultheiß R, Albrecht C, Thiengo SC.
Molluscan models in evolutionary biology: apple snails (Gastropoda:
Ampullariidae) as a system for addressing fundamental questions. Am
Malacol Bull. 2009;27:47–58.
14. Fang L, Wong PK, Lin L, Lan C, Qiu JW. Impact of invasive apple snails in
Hong Kong on wetland macrophytes, nutrients, phytoplankton and
filamentous algae. Freshwater Biol. 2010;55:1191–204.
15. Yang YX, Hu YC, Li XH, Wang XJ, Mu XD, Song HM, et al. Historical invasion,
expansion process and harm investigation of Pomacea canaliculata in
China. Chinese Agri Sci Bull. 2010;26:245–50.
16. Lv S, Zhang Y, Liu HX, Hu L, Yang K, Steinmann P, et al. Invasive snails and
an emerging infectious disease: results from the first national survey on
Angiostrongylus cantonensis in China. PLoS Neglect Trop D. 2009;3:e368.
17. Liu YF, Li F, Li YF, Liu WH, Zeng QG, Su WJ. The distribution situation,
damage and early warning on diffusion risk of golden apple snail, Pomacea
canaliculata lamark in Human. Acta Hydro Sinica. 2011;35:1067–71.
18. Carlsson NOL, Lacoursiere JO. Herbivory on aquatic vascular plants by the
introduced golden apple snail (Pomacea canaliculata) in Lao PDR. Biol
Invasions. 2005;7:233–41.
19. Lv S, Zhang Y, Liu HX, Hu L, Liu Q, Wei FR, et al. Phylogenetic evidence for
multiple and secondary introductions of invasive snails: Pomacea species in
the People’s Republic of China. Divers Distrib. 2013;19:147–56.
20. Sun J, Wang M, Wang H, Zhang H, Zhang X, Thiyagarajan V, et al. De novo
assembly of the transcriptome of an invasive snail and its multiple
ecological applications. Mol Ecol Resour. 2012;12:1133–44.
21. Hayes KA, Joshi RC, Thiengo SC, Cowie RH. Out of South America: multiple
origins of non-native apple snails in Asia. Divers Distrib. 2008;14:701–12.
22. Hayes KA, Cowie RH, Thiengo SC. A global phylogeny of apple snails:
Gondwanan origin, generic relationships, and the influence of outgroup
choice (Caenogastropoda: Ampullariidae). Biol J Linn Soc. 2009;98:61–76.
Page 12 of 13
23. Hayes KA, Cowie RH, Thiengo SC, Strong EE. Comparing apples with apples:
clarifying the identities of two highly invasive neotropical Ampullariidae
(Caenogastropoda). Zool J Linn Soc. 2012;166:723–53.
24. Matsukura K, Okuda M, Cazzaniga NG, Wada T. Genetic exchange between
two freshwater apple snails, Pomacea canaliculata and Pomacea maculata
invading East and Southeast Asia. Biol Invasions. 2013;15:2039–48.
25. Morozova O, Hirst M, Marra MA. Applications of new sequencing
technologies for transcriptome analysis. Annu Rev Genom Hum G.
2009;10:135–51.
26. Wang XW, Luan JB, Li JM, Su YL, Xia J, Liu SS. Transcriptome analysis and
comparison reveal divergence between two invasive whitefly cryptic
species. BMC Genomics. 2011;12:458.
27. Wang YL, Wang YJ, Luan JB, Yan GH, Liu SS, Wang XW. Analysis of the
transcriptional differences between indigenous and invasive whiteflies
reveals possible mechanisms of whitefly invasion. PLoS One. 2013;8:e62176.
28. Heitlinger E, Bridgett S, Montazam A, Taraschewski H, Blaxter M. The
transcriptome of the invasive eel swim bladder nematode parasite
Anguillicola crassus. BMC Genomics. 2013;14:87.
29. Akbari OS, Antoshechkin I, Amrhein H, Williams B, Diloreto R, Sandler J, et al.
he developmental transcriptome of the mosquito Aedes Aegypti, an
invasive species and major arbovirus vector. G3. 2013;3:1493–509.
30. Lockwood BL, Sanders JG, Somero GN. Transcriptomic responses to heat
stress in invasive and native blue mussels (genus Mytilus): molecular
correlates of invasive success. J Exp Biol. 2010;213:3548–58.
31. Kanehisa M, Araki M, Goto S, Hattori M, Hirakawa M, Itoh M, et al. KEGG for
linking genomes to life and the environment. Nucleic Acids Res.
2008;36:D480–4.
32. Wang XW, Zhao QY, Luan JB, Wang YJ, Yan GH, Liu SS. Analysis of a native
whitefly transcriptome and its sequence divergence with two invasive
whitefly species. BMC Genomics. 2012;13:529.
33. Yeh FL, Lai PS, Huang DJ. Preliminary studies of molluscicide resistance of
apple snails, Pomacea canaliculata in Taiwan. Bull Malacol. 2010;34:49–62.
34. Liu XM. Study on distinctions of pesticides resistance and its physiology
biochemistry in different populations of Pomacea canaliculata. 1st ed.
Nanning: Guangxi University Press; 2011
35. He MQ, Luo MZ, Zhang JE, Song CX. Damage status and control counter
measure of Pomacea canaliculata in Guangdong. Guizhou Agr Sci.
2011;39:100–3.
36. Tijet N, Helvig C, Feyereisen R. The cytochrome P450 gene superfamily in
Drosophila melanogaster: annotation, intron-exon organization and
phylogeny. Gene. 2001;262:189–98.
37. Daborn P, Yen J, Bogwitz M, Le Goff G, Feil E, Jeffers S, et al. A single P450
allele associated with insecticide resistance in Drosophila. Science.
2002;297:2253–6.
38. Puinean AM, Foster SP, Oliphant L, Denholm I, Field LM, Millar NS, et al.
Amplification of a cytochrome P450 gene is associated with resistance to
neonicotinoid insecticides in the aphid Myzus persicae. PLoS Genet.
2010;6:e1000999.
39. Anzenbacher P, Anzenbacherova E. Cytochromes P450 and metabolism of
xenobiotics. Cell Mol Life Sci. 2001;58:737–47.
40. Bogwitz MR, Chung H, Magoc L, Rigby S, Wong W, O’Keefe M, et al.
CYP12A4 confers lufenuron resistance in anatural population of Drosophila
melanogaster. Proc Natl Acad Sci U S A. 2005;102:12807–12.
41. Joußen N, Heckel DG, Haas M, Schuphan I, Schmidt B. Metabolism of
imidacloprid and DDT by P450 CYP6G1 expressed in cell cultures of
Nicotiana tabacum suggests detoxification of these insecticides in
Cyp6g1-overexpressing strains of Drosophila melanogaster, leading to
resistance. Pest Manag Sci. 2008;64:65–73.
42. Baldwin WS, Marko PB, Nelson DR. The cytochrome P450 (CYP) gene
superfamily in Daphnia pulex. BMC Genomics. 2009;10:169.
43. Jones RT, Bakker SE, Stone D, Shuttleworth SN, Boundy S, McCart C, et al.
Homology modelling of Drosophila cytochrome P450 enzymes associated
with insecticide resistance. Pest Manag Sci. 2010;66:1106–15.
44. Zhu F, Parthasarathy R, Bai H, Woithe K, Kaussmann M, Nauen R, et al. A
brain-specific cytochrome P450 responsible for the majority of deltamethrin
resistance in the Qtc279 strain of Tribolium castaneum. Proc Natl Acad Sci
U S A. 2010;107:8557–62.
45. Bass C, Carvalho R, Oliphant L, Puinean A, Field L, Nauen R, et al.
Overexpression of a cytochrome P450 monooxygenase, CYP6ER1, is
associated with resistance to imidacloprid in the brown planthopper,
Nilaparvata lugens. Insect Mol Biol. 2011;20:763–73.
Mu et al. BMC Genetics (2015) 16:12
Page 13 of 13
46. Mitchell SN, Stevenson BJ, Müller P, Wilding CS, Egyir-Yawson A, Field SG,
et al. Identification and validation of a gene causing cross-resistance
between insecticide classes in Anopheles gambiae from Ghana. Proc Natl
Acad Sci U S A. 2012;109:6147–52.
47. Herborg LM, Weetman D, Oosterhout C, Hanfling B. Genetic population
structure and contemporary dispersal patterns of a recent European invader,
the Chinese mitten crab, Eriocheir sinensis. Mol Ecol. 2007;16:231–42.
48. Darling JA, Bagley MJ, Roman J, Tepolt CK, Geller JB. Genetic patterns across
multiple introductions of the globally invasive crab genus Carcinus. Mol
Ecol. 2008;17:4992–5007.
49. Cao LL, Zhou LZ, Zhang BW. Genetic patterns of an invasive Procambarus
clarkii population in the three river basins of Anhui Province. Biodiver Sci.
2010;18:398–407.
50. Yue GH, Li JL, Bai ZY, Wang CM, Feng F. Genetic diversity and population
structure of the invasive alien red swamp crayfish. Biol Invasions.
2012;12:2697–706.
51. Zhan A, Perepelizin PV, Ghabooli S, Paolucci E, Sylvester F, Sardiña P, et al.
Scale-dependent post-establishment spread and genetic diversity in an
invading mollusc inSouth America. Divers Distrib. 2012;18:1042–55.
52. Zhang L, Yan HF, Wu W, Yu H, Ge XJ. Comparative transcriptome analysis
and marker development of two closely related Primrose species (Primula
poissonii and Primula wilsonii). BMC Genomics. 2013;14:329.
53. Chen L, Xu HG, Li H, Wu J, Ding H, Liu Y. Isolation and characterization of
sixteen polymorphic microsatellite loci in the golden apple snail Pomacea
canaliculata. Int J Mol Sci. 2011;12:5993–8.
54. Grabherr MG, Haas BJ, Yassour M, Levin JZ, Thompson DA, Amit I, et al.
Full-length transcriptome assembly from RNA-Seq data without a reference
genome. Nature Biotechnol. 2011;29:644–52.
55. Pertea G, Huang XQ, Liang F, Antonescu V, Sultana R, Karamycheva S, et al.
TIGR Gene Indices clustering tools (TGICL): a software system for fast
clustering of large EST datasets. Bioinformatics. 2003;19:651–2.
56. Conesa A, Gotz S, Garcia-Gomez JM, Terol J, Talon M, Robles M. Blast2GO: a
universal tool for annotation, visualization and analysis in functional genomics
research. Bioinformatics. 2005;21:3674–6.
57. Ye J, Fang L, Zheng H, Zhang Y, Chen J, Zhang Z, et al. WEGO: a web tool
for plotting GO annotations. Nucleic Acids Res. 2006;34:W293–7.
58. Edgar RC. MUSCLE: multiple sequence alignment with high accuracy and
high throughput. Nucleic Acids Res. 2004;32:1792–7.
59. Tamura K, Peterson D, Peterson N, Stecher G, Nei M, Kumar S. MEGA5:
molecular evolutionary genetics analysis using maximum likelihood,
evolutionary distance, and maximum parsimony methods. Mol Biol Evol.
2011;28:2731–9.
60. Saitou N, Nei M. The neighbor-joining method: a new method for reconstructing
phylogenetic trees. Mol Biol Evol. 1987;4:406–25.
Submit your next manuscript to BioMed Central
and take full advantage of:
• Convenient online submission
• Thorough peer review
• No space constraints or color figure charges
• Immediate publication on acceptance
• Inclusion in PubMed, CAS, Scopus and Google Scholar
• Research which is freely available for redistribution
Submit your manuscript at
www.biomedcentral.com/submit