A colorectal cancer prediction model using traditional and genetic risk scores in Koreans
Bạn đang xem bản rút gọn của tài liệu. Xem và tải ngay bản đầy đủ của tài liệu tại đây (470.41 KB, 7 trang )
Jung et al. BMC Genetics (2015) 16:49
DOI 10.1186/s12863-015-0207-y
RESEARCH ARTICLE
Open Access
A colorectal cancer prediction model using
traditional and genetic risk scores in Koreans
Keum Ji Jung1, Daeyoun Won2, Christina Jeon3, Soriul Kim1, Tae Il Kim4, Sun Ha Jee3* and Terri H Beaty5
Abstract
Background: Genome-wide association studies have identified numerous single nucleotide polymorphisms (SNPs)
as associated with colorectal cancer (CRC) risk in populations of European descent. However, their utility for
predicting risk to CRC in Asians remains unknown. A case-cohort study (random sub-cohort N = 1,685) from
the Korean Cancer Prevention Study-II (KCPS-II) (N = 145,842) was used. Twenty-three SNPs identified in previous
47 studies were genotyped on the KCPS-II sub-cohort members. A genetic risk score (GRS) was calculated by summing
the number of risk alleles over all SNPs. Prediction models with or without GRS were evaluated in terms of the area
under the receiver operating characteristic curve (AUROC) and the continuous net reclassification index (NRI).
Results: Seven of 23 SNPs showed significant association with CRC and rectal cancer in Koreans, but not with colon
cancer alone. AUROCs (95% CI) for traditional risk score (TRS) alone and TRS plus GRS were 0.73 (0.69–0.78) and 0.74
(0.70–0.78) for CRC, and 0.71 (0.65–0.77) and 0.74 (0.68–0.79) for rectal cancer, respectively. The NRI (95% CI) for a
prediction model with GRS compared to the model with TRS alone was 0.17 (-0.05-0.37) for CRC and 0.41
(0.10–0.68) for rectal cancer alone.
Conclusion: Our results indicate genetic variants may be useful for predicting risk to CRC in the Koreans,
especially risk for rectal cancer alone. Moreover, this study suggests effective prediction models for colon and
rectal cancer should be developed separately.
Keywords: Single nucleotide polymorphisms, Gene-traditional risk score, Colorectal cancer
Background
According to the Korean National Cancer Center, the incidence of colorectal cancer (CRC), the 3rd most common
cancer in Korea, has increased from 21.2/100,000 people
in 1999 to 39.0/100,000 people in 2011 [1]. Steady increases in the incidence of CRC should be expected, partly
due to environmental factors such as increased Western
dietary patterns. Early discovery of high-risk groups could
be helpful in managing risk factors and ultimately in reducing CRC incidence and mortality [2].
Previous studies have proposed CRC prediction models
but these attained only limited predictive power [3,4].
Some models reflect only one aspect of the associated risk
factors and failed to incorporate both the genetic and
traditional risk factors (including environmental factors)
* Correspondence:
3
Institute for Health Promotion and Department of Epidemiology and Health
Promotion, Graduate School of Public Health, Yonsei University, 50 Yonse-ro,
Seodaemun-gu, Seoul, South Korea
Full list of author information is available at the end of the article
of CRC [3-5]. Moreover, many previous models did not
distinguish between the colon and rectal cancer, which are
distinct by anatomic sites and other characteristics [2,6].
In fact, previous publications have reported colon and rectal cancer show different associations with traditional risk
factors [7-9]. Therefore, to develop more effective prediction models, we should 1) include information on both
genetic and traditional risk factors, and 2) distinguish between colon and rectal cancers.
For our CRC predictive model, the most appropriate
traditional risk factors were determined from a prospective cohort study of the general Korean population. Also,
after incorporating genetic factors into the model, its
utility was carefully evaluated. Our study provides evidence that considering genetic factors as well as traditional risk factors in risk prediction models can improve
their utility.
© 2015 Jung et al.; licensee BioMed Central. This is an Open Access article distributed under the terms of the Creative
Commons Attribution License ( which permits unrestricted use, distribution, and
reproduction in any medium, provided the original work is properly credited. The Creative Commons Public Domain
Dedication waiver ( applies to the data made available in this article,
unless otherwise stated.
Jung et al. BMC Genetics (2015) 16:49
Page 2 of 7
Results
We attained 633,210 person-years (PY) after following
145,842 study subjects through December 2012. During
the follow-up period, 258 CRC patients were verified from
the National Cancer Center cancer registry database. Overall incidence rate per 100,000 PY was 40.7.
Table 1 shows the characteristics of all study participants.
Participants from the KCPS-II cohort and sub-cohort
had similar characteristics of age, sex, BMI, smoking
status, alcohol drinking, exercise, and family history. In
each cohort, the case group was older and had higher
BMI and fasting blood glucose than did the control group.
Also, in each cohort, the patient group showed higher
rates of smoking and more cases reported a family history
of CRC.
Table 2 shows the estimated hazards ratio (HR) of various factors contributing to the risk of CRC. Each cohort
showed similar findings between participants in the whole
KCPS-II cohort and the sub-cohort participants. Age, sex,
fasting serum glucose, smoking status, exercise, and family
history were ultimately selected as predictors for CRC.
Table 3 shows allelic association with CRC, colon, and
rectal cancer, respectively. Depending on the cancer location (colon or rectum), each SNP showed a different pattern of association. A total of 5 out of 23 SNPs showed
significant association only with rectal cancer, but not on
colon cancer. A total of 2 out of 23 SNPs showed a positive association across both colon and rectum cancer, although it was only moderately significant.
In this study, the GRS was based on 7 SNPs (rs3802842,
rs4939827, rs6983267, rs10505477, rs10795668, rs961253,
and rs9929218). Overall these GRS followed a normal distribution (data not shown).
Table 4 shows the predictive power of models incorporating GRS with TRS for CRC, and rectal cancer using
both the ROC area and NRI. AUROC (95% CI) for TRS
alone was 0.73 (0.69-0.78) for CRC, and 0.71 (0.65–0.77)
for rectal cancer alone. The AUROC (95% CI) for the
combined model with both TRS and GRS was increased,
especially for rectal cancer [0.74 (0.68-0.79)]. NRI (95%
CI) for the model with GRS compared to the model
with only TRS was 0.17 (-0.05–0.37) for CRC, and 0.41
(0.10–0.68) for rectal cancer. Table 4 also shows the risk
of CRC and rectal cancer alone after dividing GRS into
quartiles. Compared with participants in the lowest quartile, those with the highest quartile of GRS had a 2.65-fold
higher risk for CRC and a 10.83-fold higher risk for rectal
cancer alone, respectively.
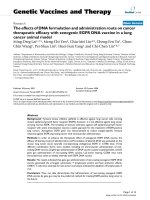
Figure 1 shows the combined risk of CRC and rectal
cancer separately after dividing each GRS and TRS into
quartiles. As the GRS increased into quartile 4 (Q4), the
CRC risk increased. Also, as the TRS increased in quartile
4 (Q4), the CRC risk increased even more. Participants
with TRS and GRS in the highest quartile (Q4) were determined to have about 25 times higher risk of CRC than
those with TRS and GRS in the lowest quartile (Q1). Likewise, participants with TRS and GRS in the highest quartile (Q4) were determined to have about 40 times as much
risk of rectal cancer compared to those with TRS and GRS
in the lowest quartile (Q1).
Discussion
Gene-based prediction of CRC in literatures
The heritability of risk to CRC is estimated to be ~35%
[10] but only about 5% of CRC cases can be attributable
to highly penetrant mutations in recognized genes.
Table 1 General characteristics of study participants: The Korean Cancer Prevention Study-II and the KCPS-II sub-cohort
KCPS-II cohort (Whole participants)
CRC
No CRC
N
258
145,584
Age, year
50.7 ± 10.5
41.1 ± 10.3
KCPS-II sub-cohort (Case-cohort design)
P
CRC
173
1,514
<0.001
49.7 ± 10.9
40.1 ± 9.4
No CRC
P
<0.001
Sex, % of female
24.1
37.9
<0.001
25.0
37.6
0.001
Body mass index, kg/m2
24.3 ± 2.7
23.6 ± 3.2
<0.001
24.3 ± 2.7
23.5 ± 3.2
0.001
Fasting blood glucose, mg/dL
99.0 ± 25.3
91.0 ± 19.0
<0.001
98.2 ± 27.8
90.1 ± 17.9
<0.001
Total cholesterol, mg/dL
197.7 ± 37.1
189.0 ± 33.8
0.002
195.6 ± 36.9
189.3 ± 41.8
0.037
Systolic blood pressure, mmHg
Smoking status, %
Alcohol drinking (yes), %
123.4 ± 16.3
117.9 ± 14.4
<0.001
121.8 ± 14.7
117.6 ± 14.3
0.037
Ex
31.0
17.7
<0.001
29.6
15.8
<0.001
Current
29.9
29.2
30.7
30.2
73.6
74.0
74.4
76.7
0.881
0.496
Exercise (yes), %
63.2
59.6
0.228
62.5
61.8
0.850
Family history of CRC (yes), %
5.0
2.3
0.005
5.1
2.0
0.011
Values are mean ± standard deviation (SD) for continuous data.
Body mass index (BMI) = weight in kilograms divided by height in meters squared.
CRC: Colorectal cancer, KCPS-II: The Korean Cancer Prevention Study-II.
Jung et al. BMC Genetics (2015) 16:49
Page 3 of 7
Table 2 Hazard ratios for risk factors on risk of CRC: The Korean Cancer Prevention Study-II and the KCPS-II sub-cohort
KCPS-II cohort (Whole participants)
KCPS-II sub-cohort (Case-cohort design)
Traditional risk factors
HR (95% CI)
HR (95% CI)
Age, year
1.07 (1.06-1.08)
1.08 (1.07-1.10)
Sex (female)
0.65 (0.45-0.92)
0.71 (0.50-1.11)
Log (fasting serum glucose), mg/dL
1.81 (0.99-3.30)
2.16 (0.96-4.83)
Smoking status
Ex-smoker
1.45 (1.03-2.05)
1.74 (1.12-2.72)
Current smoker
1.28 (0.90-1.83)
1.40 (0.91-2.17)
Exercise (yes)
0.91 (0.70-1.17)
0.68 (0.49-0.94)
Family history of CRC (yes)
2.40 (1.34-4.30)
3.49 (1.70-7.17)
Per 1 SD of TRS increase
1.34 (1.29-1.39)
1.30 (1.24-1.36)
CRC: colorectal cancer, HR: hazard ratios, CI: confidence interval, SD: standard deviation, TRS: traditional risk score,
TRS combined information on above 6 risk factors: age, sex, fasting serum glucose, exercise, and family history of CRC.
KCPS-II: The Korean Cancer Prevention Study-II.
Table 3 Allelic odds ratios for subtype of CRC in the Korean Cancer Prevention Study II sub-cohort
SNPs*
Reference number in
Additional file 2: Table S1
Colorectal cancer
Colon cancer
Rectal cancer
Chr.
RA
RAF
OR (95% CI)
OR (95% CI)
OR (95% CI)
1.46 (1.14-1.86)
1.30 (0.93-1.81)
1.50 (1.10-2.04)
rs3802842
4,7,19,29,32,34, 36
11
C
0.40
rs4444235
4,7,32,38
14
C
0.52
1.02 (0.80-1.29)
1.01 (0.73-1.40)
1.03 (0.76-1.40)
rs4939827
7,10,29,30,34,41,42,43,44,45,46
18
T
0.22
1.32 (1.01-1.71)
1.04 (0.71-1.52)
1.55 (1.11-2.16)
rs6983267
7,16,17,18,19,20,21,22,23,24,25,26,27,28
8
G
0.43
1.14 (0.91-1.43)
0.85 (0.61-1.17)
1.46 (1.08-1.97)
rs10505477
11,12,13,14,15
8
G
0.43
1.15 (0.92-1.45)
0.88 (0.64-1.21)
1.44 (1.06-1.94)
rs10795668
7,20,30,31,32,33,34
10
G
0.64
1.20 (0.92-1.55)
0.93 (0.66-1.32)
1.45 (1.03-2.05)
rs11169552
1
12
T
0.34
0.98 (0.76-1.25)
1.05 (0.75-1.47)
0.93 (0.67-1.28)
rs6687758
1,2
1
G
0.29
0.96 (0.74-1.25)
1.14 (0.80-1.63)
0.85 (0.60-1.20)
rs7014346
29
8
G
0.69
0.94 (0.73-1.21)
1.08 (0.76-1.54)
0.86 (0.62-1.18)
rs11903757
3
2
T
0.96
0.79 (0.45-1.42)
0.75 (0.35-1.63)
0.91 (0.42-1.96)
rs3217810
3
12
C
0.95
0.98 (0.19-5.21)
0.44 (0.08-2.45)
NE
rs10411210
20,28
19
T
0.18
0.91 (0.66-1.25)
0.82 (0.52-1.30)
1.00 (0.67-1.50)
rs961253
4,7,11,19,20,34, 38,47
20
A
0.10
1.38 (0.97-1.97)
1.19 (0.72-1.98)
1.45 (0.93-2.26)
rs6691170
1,2,4
1
T
0.09
NE
rs9929218
20,21,31,38,40
16
A
0.15
1.21 (0.87-1.68)
1.16 (0.74-1.83)
1.20 (0.78-1.82)
rs10911251
3
1
C
0.46
1.01 (0.80-1.29)
0.80 (0.58-1.12)
1.22 (0.90-1.66)
rs7758229
10
6
T
0.22
1.06 (0.80-1.41)
0.91 (0.60-1.37)
1.20 (0.84-1.71)
rs59336
3
12
T
0.63
0.94 (0.73-1.20)
0.79 (0.57-1.12)
1.09 (0.79-1.52)
rs3217901
37
12
G
0.65
1.10 (0.87-1.39)
1.51 (1.08-2.11)
0.83 (0.61-1.12)
rs10936599
1,4,5,6,7,8
3
T
0.61
1.09 (0.87-1.38)
1.07 (0.77-1.48)
1.11 (0.81-1.50)
rs647161
9
5
C
0.69
0.95 (0.73-1.22)
0.72 (0.51-1.01)
1.25 (0.88-1.77)
rs7136702
1
12
T
0.53
1.08 (0.85-1.37)
1.10 (0.79-1.54)
1.02 (0.75-1.39)
rs4779584
4,19,20,30,32,33,36,39
15
T
0.84
0.97 (0.70-1.34)
0.91 (0.58-1.43)
1.02 (0.67-1.55)
CRC: colorectal cancer, Chr.: chromosome, RA: risky allele, RAF: risky allele frequency, OR: odds ratio, CI: confidence interval, NE: not estimated due to small
number, SNP with ORs in bold were selected for genetic risk score calculations.
*List of references and detailed information were summarized in Additional file 2: Table S1.
Jung et al. BMC Genetics (2015) 16:49
Page 4 of 7
Table 4 Area under receiver operating characteristic curve by subtype of CRC: Korean Cancer Prevention Study II
sub-cohort
Colorectal cancer
TRS
GRS
Colon cancer
HR (95% CI)*
HR (95% CI)
HR (95% CI)*
HR (95% CI)
HR (95% CI)*
Q1
1.00
1.00
1.00
1.00
1.00
1.00
Q2
1.97 (0.95-4.11)
2.03 (0.98-4.22)
1.60 (0.52-4.94)
1.60 (0.52-4.95)
2.28 (0.87-6.01)
2.40 (0.91-6.31)
Q3
2.57 (1.29-5.14)
2.62 (1.31-5.24)
2.19 (0.76-6.32)
2.16 (0.75-6.24)
2.88 (1.15-7.24)
3.02 (1.20-7.59)
Q4
11.29 (6.06-21.1)
11.54 (6.19-21.5)
13.33 (5.31-33.5)
13.27 (5.29-33.3)
10.16 (4.36-23.7)
10.59 (4.54-24.7)
Q1
1.00
1.00
1.00
Q2
1.42 (0.77-2.61)
0.95 (0.47-1.91)
3.95 (0.93-16.84)
Q3
1.68 (0.92-3.07)
0.77 (0.37-1.59)
7.06 (1.70-29.28)
Q4
2.65 (1.43-4.91)
AUROC
0.73 (0.69-0.78)†
0.74 (0.70-0.78)
NRI
-
P for NRI
Rectal cancer
HR (95% CI)
1.17 (0.55-2.50)
0.76 (0.70-0.83)†
10.83 (2.58-45.40)
0.75 (0.69-0.81)
0.71 (0.65-0.77)†
0.74 (0.68-0.79)
0.17 (-0.05-0.37)
−0.17 (-0.33-0.21)
-
0.41 (0.10-0.68)
0.108
0.688
0.008
CRC: colorectal cancer, TRS: traditional risk score, GRS: genetic risk score, HR: hazard ratio, CI: confidence interval, AUROC: Area under receiver operating
characteristic curve, NRI: net reclassification index.
*Combined model, †AUROC for TRS alone, AUROC for TRS + GRS.
Recent genome-wide association studies (GWASs) have
identified a number of common genetic markers significantly associated with CRC [6,11-13]. However, most of
these GWAS results have been from populations of
European descent. In any GWAS results, the risk associated with any one marker is individually modest, because
these markers are rarely causal but merely tag regions
haplotypes spanning chromosomal regions. Thus, predicted risks for individuals tend to be very modest and
rarely exceed thresholds that would trigger any clinical
intervention, and at best these predicted risk might be useful for identifying sub-groups of high-risk subjects carrying
multiple risk alleles. Companies such as DeCODEme and
23andme include panels of common SNPs in their testing
panels and report predicted risk for complex diseases such
as CRC, yet research suggests any prediction based on genetic markers identified through genome-wide studies is of
questionable clinical utility [6].
Present study findings
During the follow-up period which included 633,210
person-year coverage, 258 incident CRC cases (196 men
and 62 women) occurred. This case-cohort study evaluated the ability to predict risk based on TRS alone, and
these plus a GRS which aggregates information from 7
genetic markers shown to be associated with risk of CRC
in Koreans. While most genetic epidemiologic studies
have focused on the combined outcome CRC (colon or
rectal cancer), but showed less improvement for CRC and
colon cancer alone in our Korean sub-cohort study. The
rectal cancer prediction model using both TRS and GRS
had an increased AUROC by about 3% compared to the
AUC from a TRS model (Table 4). The prediction model
for rectal cancer alone showed a substantial increase in
NRI of about 41%.
We set out to develop and validate CRC risk prediction models and assess their performance in profiling
Figure 1 Combined effect of traditional risk score and genetic risk score on colorectal cancer: Korean Cancer Prevention Study-II.
Jung et al. BMC Genetics (2015) 16:49
individual genetic risk of CRC in Koreans. We developed
models incorporating age, gender, fasting serum glucose,
smoking, exercise, family history (FH) and genotype data
from 23 common genetic markers reported to significantly associate with CRC in over 47 previous publications. Several of these 23 SNPs (rs3802842,
rs4939827, rs6983267, rs10795668, rs961263, rs4779584,
and so on) have been well replicated in the scientific literature (Table 3). In Koreans, 7 SNPs (rs3802842,
rs4939827, rs6983267, rs10505477, rs10795668, rs961263,
rs9929218) among the 23 SNPs were associated with CRC
in our sub-cohort based on 258 incident cases. However,
some of these 7 SNPs showed positive association with
wide 95% confidence intervals.
CRC versus colon and rectal cancer
Previous GWAS using CRC as the outcome (combining
colon and rectal cancer together) reported genome-wide
significant associations between risk and multiple SNPs
[11-13]. But few studies have considered colon and rectal cancer separately. Some studies of environmental factor argue differences between CRC sub-types may be
important [8-9].
When we separated our CRC cases into colon and rectal
cancer groups, 7 out of 23 reported risk SNPs showed statistically significant association with CRC and rectal
cancer, but not with colon cancer (Table 3). These SNPs
showed consistent direction of association and effect size,
and the lack of statistical significance could just reflect a
loss of power due to smaller sample sizes.
This suggests future studies should also separate colon
and rectal cancer rather than just testing only the combined outcome CRC. Also, it raises the question of whether
separate prediction models for colon and rectal cancer
should be developed.
TRS versus GRS
In this study of CRC alone, TRS alone showed a strong
predictive power of 0.73, and the addition of a GRS
failed to show significant contribution or change. In the
combined risk models, however, that including both the
TRS and GRS, rectal cancer showed the greatest improvement (ROC area change = 3%; NRI = 0.41).
Recently, Dunlop et al. (2013) [6] conducted a ROC
analysis of models including genotype data alone or in
combination age, gender and FH showed very modest
discrimination across the full risk spectrum of risk, with
AUC = 0.59 and 0.57 (internal validation) or 0.56 and
0.57 (external validation sets). Their overall positive predictive value fell between 0.51 and 0.71.
The modest performance in individualized CRC risk
profiling is consistent with risk prediction studies for other
complex diseases (coronary heart disease [14], stroke
[15,16], and age-related macular degeneration [17]).
Page 5 of 7
The best predictive performances have been obtained
by combining genetic, demographic and environmental
variables [17]. In our study, GRS itself showed similar
ROC value (~0.6). However, when we combined GRS with
traditional risk factors (like age, sex, high fasting glucose,
smoking, exercise, and family history) the ROC increased
up to 0.74 for predicting CRC, and similar models for rectal cancer showed greater increase.
Limitation and strength
Major limitations included reliance on self-reported exposures at a single point in time, thus precluding the definitive exclusion of potential misclassification. The statistical
power of the current study is modest, as genotyping was
performed on a limited sample size of CRC cases and controls. A strong point of our study is the case-cohort design
drawn from an underlying large prospective cohort. Case
identifications were performed by record linkage to the
national cancer registry with verification.
Conclusion
In conclusion, findings in this current study provide some
evidence of improved prediction for CRC in models combining traditional and genetic risk factors. This emphasizes both genetic and traditional factors associated with
CRC should be considered when predicting risk.
Methods
Study subjects
We have used data on the Korean Metabolic Syndrome
Research Initiative in Seoul, initiated in 2005. We have
labeled this study as the Korean Cancer Prevention
Study-II (KCPS-II). A full description of KCPS-II has
been previously published [9,18]. Study members were
recruited from participants in routine health assessments
at health promotion centers in Seoul and GyeongGi
province, South Korea, between 2004 and 2011. Twenty
one centers holding electronic health records agreed to
linkage of participants’ records to national cancer registry for monitoring of cancer events. The initial study
population included 190,332 individuals (112,852 men,
77,480 women), aged 20-94 years. About 90% of participants were enrolled between 2005 and 2008, and the
remaining were enrolled prior to or after this period. We
have acquired both written consent forms and blood
samples from 157,526 participants. Among the total
157,526 participants, 174 participants who reported of
having prevalent CRC were excluded. In addition, 11,510
participants who had missing values on body mass index,
fasting blood glucose, total cholesterol, systolic blood
pressure, smoking status, alcohol drinking, and exercise
were excluded. Follow up of participants through December 2011, identified 258 out of these 145,842 participants
as incident cases of colorectal cancer.
Jung et al. BMC Genetics (2015) 16:49
For the case-cohort study, we selected a sub-cohort as
a 1% random sample of all participants. Two of 1,514
randomly selected participants were found to be diagnosed with CRC from our sub-cohort study, while 173
CRC cases were verified outside the sub-cohort. In short,
a total of 1,685 additional participants (1,514 plus 173
participants minus 2 participants) were included in our
case-cohort study design. Until 2012, the actual number
of CRC patients eligible for genetic testing was 173 among
all known CRC cases 258. The remaining 85 CRC patients
will be tested during the next phase of our study. The
Institutional Review Board of Yonsei University reviewed
and approved this study.
Traditional risk score
To develop the traditional risk score (TRS), Cox proportional hazards regression models were fitted first to a basic
set of classical risk factors: age, sex, smoking status, fasting
serum glucose, family history of colorectal cancer. The
TRS algorithm is given in online Additional file 1.
SNP genotyping
Twenty-three single-nucleotide polymorphisms (rs3802842,
rs4444235, rs4939827, rs6983267GG, rs10505477,
rs10795668, rs11169552, rs6687758, rs7014346, rs11903757,
rs3217810, rs10411210, rs961253, rs6691170, rs9929218,
rs10911251, rs7758229, rs59336, rs3217901, rs10936599,
rs647161, rs7136702TT, rs4779584) identified in previous
47 studies were genotyped (Table 3 and Additional file 2:
Table S1). DNA was isolated from peripheral blood of participants and genotyped at DNA Link Inc. (Seoul, Korea).
The genotyping was performed using SNP type assay
(Fluidigm, San Francisco, CA, USA) following the manufacturer’s recommendation. Genomic DNA flanking these
SNPs of interest was amplified with PCR reaction with
STA primer set and Qiagen 2X Mutiplex PCR Master Mix
(Qiagen) in 5 microliter reaction volume, containing 60 ng
of genomic DNA. PCR reactions were carried out as follows: 15 min at 95°C for 1 cycle, and 14 cycles on 95°C for
15 s and 60°C for 4 min. After amplification, the the STA
products were diluted 1:100 in DNA Suspension Buffer.
A 2.5 microliter of the diluted STA products were added
to a Sample Pre-Mix containing 3 microliter of 2X Fast
Probe Master Mix, 0.3 microliter of the SNP type 20X
Sample Loading Reagent, 0.1 microliter of the SNP type
Reagent, and 0.036 microliter of the ROX. After the Assay
Pre-Mix and the Sample Pre-Mix were loaded into
the 48.48 Dynamic Array, SNP type assay reaction was
carried out. Analysis was carried out using Fluidigm SNP
Genotyping Analysis software (version 4.0.1; Fluidigm). Internal quality control (QC) measures were employed to
ensure accuracy of the data. A total of 1,685 individuals
were genotyped on this platform.
Page 6 of 7
Anthropometric measurements
Each participant was interviewed using a structured questionnaire to collect information on smoking status and alcohol consumption as well as demographic characteristics,
such as age, gender, and family history of various diseases.
Cigarette smoking was classified into never smokers, exsmokers, and current smokers. Alcohol consumption was
divided into nondrinkers and current drinkers. Regular
physical activity was tracked as either “yes” or “no”. Participant height and weight were measured while the participants were wearing light clothing. Body mass index
(BMI) was calculated by dividing the weight (kg) by the
square height (m2). Systolic and diastolic blood pressures
were measured after a rest period of at least 15 min.
SNP selection and GRS calculation
Each SNP in this study was assumed to be associated
with risk following an additive genetic model, which is
considered to be generally robust even when the true
genetic model is not known or may be incorrectly specified [19]. The GRS was created by two methods: a simple count method (count GRS) and a weighted method
(weighted GRS) [14,20]. Both methods assumed each
SNP to be independently associated with the risk of CRC
(i.e. no interaction). We assumed an additive genetic
model for each SNP, applying a linear weighting of 0, 1, or
2 to genotypes containing 0, 1, or 2 of the reported risk alleles, respectively. This count model assumes each SNP in
the panel contributes equally to the risk for CRC and was
calculated by summing the values for each SNP. The
weighted GRS was calculated by multiplying each estimated beta-coefficient by the number of corresponding
risk alleles (0, 1, or 2).
In this study, traditional risk factor score (TRS) combined information on 6 risk factors: age, sex, fasting
serum glucose, smoking status, exercise status, and family history of CRC.
Outcome classification
The principle outcome variable was incidence of CRC
(n = 258 in whole participants, n = 173 in the sub-cohort),
based on data from the national cancer registry. According to the International Classification of Diseases, Tenth
Revision (ICD-10), CRC was coded as C18-C20 (C18 for
colon, C19 for rectosigmoid, and C20 rectum) [21].
Statistical analysis
All statistical tests were two-sided, and statistical significance was determined as p<0.05. To evaluate general
characteristics of the study population, means and standard deviations (SD) were calculated, and frequencies of
cigarette smoking, alcohol consumption, and physical
activity was determined. A χ2 goodness-of-fit test was
used to assess whether SNPs were in Hardy-Weinberg
Jung et al. BMC Genetics (2015) 16:49
Equilibrium and to determine differences in genotype frequencies between CRC cases and controls. The GRS was
categorized into quartiles. CRC risk associated with any
one genotype was estimated as OR and 95% confidence
interval (CI), and was computed using logistic regression
under an additive genetic model. We also used receiver
operating characteristic (ROC) curve analysis and calculated the area under the curve (AUC; also known as the C
statistic) and the continuous net reclassification index
(NRI) to evaluate the discrimination power of a CRC risk
model. Finally, Cox proportional hazards models were
used to estimate the effect of GRS and TRS on CRC risk
in our case-cohort design.
Availability of supporting data
The data set supporting the results of this article is available
in the LabArchives, in />
Page 7 of 7
4.
5.
6.
7.
8.
9.
10.
11.
Additional files
Additional file 1: The traditional risk score (TRS).
12.
Additional file 2: Table S1. Colorectal cancer related 47 references
selected for the present study.
13.
Abbreviations
GRS: Genetic risk score; TRS: Traditional risk score; CRC: Colorectal cancer;
OR: Odd ratio; CI: Confidence interval; SNP: Single nucleotide polymorphisms.
Competing interests
All authors declare that they have no competing interests.
Authors’ contributions
KJJ and SK: data analysis, and writing the manuscript; DW, CJ, and TK: writing
the manuscript, SHJ: study design, collecting data, and data analysis, THB:
writing the manuscript. All author read and approved the final manuscript.
14.
15.
16.
Acknowledgments
This work was supported by a grant from the National R&D Program for
Cancer Control; Ministry for Health, Welfare and Family Affairs, Republic of
Korea (1220180).
17.
Author details
1
Department of Public Health, Graduate School, Yonsei University, Seoul,
South Korea. 2The Catholic University of Korea, Seoul Saint Mary’s Hospital,
Seoul, South Korea. 3Institute for Health Promotion and Department of
Epidemiology and Health Promotion, Graduate School of Public Health,
Yonsei University, 50 Yonse-ro, Seodaemun-gu, Seoul, South Korea. 4Division
of Gastroenterology, Department of Internal Medicine, Yonsei University
College of Medicine, Seoul, South Korea. 5Johns Hopkins Bloomberg School
of Public Health, Baltimore, MD, USA.
18.
Received: 7 January 2015 Accepted: 22 April 2015
References
1. National Cancer Information Center. Cancer Incidence trend analysis.
accessed online Date on June 2014 at />subview.jsp?id=cancer_040104000000.
2. Yarnall JM, Crouch DJM, Lewis CM. Incorporating non-genetic risk factors
and behavioural modifications into risk prediction models for colorectal
cancer. Cancer Epidemiol. 2013;37(3):324–9.
3. The International Schizophrenia Consortium. Common polygenic variation
contributes to risk of schizophrenia and bipolar disorder. Nature.
2009;460(7256):748–52.
19.
20.
21.
Jiang H, Liu F, Wang Z, Na R, Zhang L, Wu Y, et al. Prediction of prostate
cancer from prostate biopsy in Chinese men using a genetic score derived
from 24 prostate cancer risk-associated SNPs. Prostate. 2013;73(15):1651–9.
Blakely T, Barendregt JJ, Foster RH, Hill S, Atkinson J, Sarfati D, et al. The
association of active smoking with multiple cancers: national census-cancer
registry cohorts with quantitative bias analysis. Cancer Causes Control.
2013;24(6):1243–55.
Dunlop MG, Tenesa A, Farrington SM, Ballereau S, Brewster DH, Koessler T,
et al. Cumulativeimpact of commongeneticvariants and otherriskfactors on
colorectalcancerrisk in 42,103 individuals. Gut. 2013;62(6):871–81.
Shin A, Joo J, Yang HR, Bak J, Park Y, Kim J, et al. Risk prediction model for
colorectal cancer: National Health Insurance Corporation study, Korea. PLoS
One. 2014;9(2):e88079.
Shin A, Joo J, Bak J, Yang HR, Kim J, Park S, et al. Site-specific risk factors for
colorectal cancer in a Korean population. PLoS One. 2011;6(8):e23196.
Shin HY, Jung KJ, Linton JA, Jee SH. Association between fasting glucose
levels and incidence of colorectal cancer in Korean men: the Korean cancer
prevention study-II. Metabolism 2014 Jul 10. [Epub ahead of print].
Lichtenstein P, Holm NV, Verkasalo PK, Iliadou A, Kaprio J, Koskenvuo M,
et al. Environmental and heritable factors in the causation of cancer–analyses
of cohorts of twins from Sweden, Denmark, and Finland. N Engl J Med.
2000;13(343(2)):78–85.
Tomlinson IP, Webb E, Carvajal-Carmona L, Broderick P, Howarth K, Pittman AM,
et al. A genome-wide association study identifies colorectal cancer susceptibility
loci on chromosomes 10p14 and 8q23.3. Nat Genet. 2008;40(5):623–30.
doi:10.1038/ng.111. Epub 2008 Mar 30.
Tenesa A, Farrington SM, Prendergast JG, Porteous ME, Walker M, Haq N,
et al. Genome-wide association scan identifies a colorectal cancer susceptibility
locus on 11q23 and replicates risk loci at 8q24 and 18q21. Nat Genet.
2008;40(5):631–7. doi:10.1038/ng.133. Epub 2008 Mar 30.
Spain SL, Carvajal-Carmona LG, Howarth KM, Jones AM, Su Z, Cazier JB,
et al. Refinement of the associations between risk of colorectal cancer
and polymorphisms on chromosomes 1q41 and 12q13.13. Hum Mol
Genet. 2012;21(4):934–46. doi:10.1093/hmg/ddr523. Epub 2011 Nov 10.
Ripatti S, Tikkanen E, Orho-Melander M, Havulinna AS, Silander K, Sharma A,
et al. A multilocus genetic risk score for coronary heart disease: case-control
and prospective cohort analyses. Lancet. 2010;376(9750):1393–400.
Ibrahim-Verbaas CA, Fornage M, Bis JC, Choi SH, Psaty BM, Meigs JB, et al.
Predicting stroke through genetic risk functions: the CHARGE Risk Score
Project. Stroke. 2014;45(2):403–12. Epub 2014 Jan 16.
Malik R, Bevan S, Nalls MA, Holliday EG, Devan WJ, Cheng YC, et al.
Wellcome Trust Case Control Consortium 2. Multilocus genetic risk score
associates with ischemic stroke in case-control and prospective cohort
studies. Stroke. 2014;45(2):394–402. Epub 2014 Jan 16.
Seddon JM, Reynolds R, Maller J, Fagerness JA, Daly MJ, Rosner B. Prediction
model for prevalence and incidence of advanced age-related macular
degeneration based on genetic, demographic, and environmental variables.
Invest Ophthalmol Vis Sci. 2009;50(5):2044–53. doi:10.1167/iovs.08-3064.
Epub 2008 Dec 30.
Jo J, Nam CM, Sull JW, Yun JE, Kim SY, Lee SJ, et al. Prediction of Colorectal
Cancer Risk Using a Genetic Risk Score: The Korean Cancer Prevention
Study-II (KCPS-II). Genomics Inform. 2012;10(3):175–83.
Balding DJ. A tutorial on statistical methods for population association
studies. Nat Rev Genet. 2006;7(10):781–91.
Cornelis MC, Qi L, Zhang C, Kraft P, Manson J, Cai T, et al. Joint effects of
common genetic variants on the risk for type 2 diabetes in U.S. men and
women of European ancestry. Ann Intern Med. 2009;150(8):541–50.
World Health Organization. International Statistical Classification of
Diseases and Related Health Problems. 10th Rev. Geneva: World Health
Organization; 1992.