experimental analysis of neural network based feature extractors for
Bạn đang xem bản rút gọn của tài liệu. Xem và tải ngay bản đầy đủ của tài liệu tại đây (315.69 KB, 6 trang )
Experimental Analysis of Neural Network Based Feature Extractors for
Cursive Handwriting Recognition
Ling Gang, Brijesh Verma and Siddhi Kulkarni
School of Information Technology, Griffith University-Gold Coast Campus
PMB 50, GCMC, Qld 9726, Australia
E-mail: ,
Web:
ABSTRACT
Artificial neural networks have been widely used in many
real world applications including classification of cursive
handwritten segmented characters. However, the feature
extraction ability of MLP based neural networks has not
been investigated properly. In this paper, a new MLP based
approach such as an auto-associator for feature extraction
from segmented handwritten characters is proposed. The
performance of Auto-Associator (AA), Multilayer
Perceptron (MLP) and Multi-MLP as a feature extractor
have been investigated and compared. The results and
detailed analysis of our investigation are presented in the
paper.
1. INTRODUCTION
1.1 Motivations and aims of the research
There are a number of classification techniques widely
used by researchers in many real world applications.
However, there are a very few researchers who have
tried MLP based neural networks as a feature extractor.
The need for research to further improve and embellish
current character recognition techniques has been widely
recognized. It is also recognised that the types of feature
extractors used contribute to some of the errors caused.
Therefore a need can be seen to find a new feature
extractor and investigate the NN-based feature extraction
techniques, to show which are indeed the best and most
efficient techniques to use.
1.2 Background
There are only a few empirical comparative studies of
NN-based feature extraction paradigms have been made.
The paradigms in Mao and Jain [1] are compared only
for exploratory data projection and two-dimensional
classification and in Lerner et al. [2] only for one
database. In the research carried out by Boaz Lerner,
Hugo Guterman, Mayer Aladjem [3]; the complex
architectures of more than two layers were not
considered as candidates for the classifier and the
number of output units was three, which is quite small.
The comparative studies of different MLP-based feature
extraction have not been considered yet. So it is
necessary to do more over this issue, the primary aim of
this research is to investigate the feature extraction
ability of Auto-Associator, MLP and Multi-MLP to
determine which one is more suitable and reliable to be
used in real-world handwriting character recognition
systems.
The origins of character recognition [4-6] can be found
as early as 1870. It first appeared as an aid to the visually
handicapped, and the first successful attempt was made
by the Russian scientist Tyurin in 1900 [7]. From then
on, many papers about neural networks [8-15] and
applications have been presented and widely used in
pattern recognition areas, the modern version of
character recognition appeared in the middle of the
1940s with the development of digital computers.
Thenceforth it was realized as a data processing
approach with application to the business world. The
principal of motivation for the development of character
recognition is the need to cope with enormous quantities
of paper such as bank checks, commercial forms,
government records, credit card imprints and mail
sorting generated by the expanding technological society.
Presently, the methodologies in character recognition
have advanced from the earlier use of primitive
techniques for the recognition of machine printed
numerals and a limited number of English letters to the
application of sophisticated techniques for the
recognition of a wide variety of complex handwriting
characters, symbols and word/script.
1.3 Organization of the paper
This paper consists of five sections. Section 1 presents
the motivations and background. Section 2 details
research methodology, proposing and describing the
methods that were employed in this research. Section 3
details experimental results, listing the results obtained
during the experiments. Section 4 provides a discussion,
an analysis of the experimental results and compares the
three different techniques that have been investigated.
Section 5 provides conclusions that have been drawn
from this research.
2. PROPOSED RESEARCH METHODOLOGY
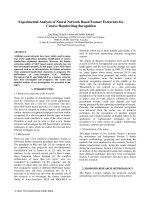
The Figure 1 below outlines the proposed research
methodology and it is described in the sections below.
0-7803-7278-6/02/$10.00 ©2002 IEEE
Figure 1. Block diagram of research methodology
2.1 Character acquisition and preprocessing
Before experiments could be carried out, there was a
need to process the original images. The techniques
employed to prepare input files for various techniques
are discussed in the following sections.
2.1.1 Character database acquisition
The training and test characters/words used in this
research came from the following directories on CEDAR
CD-ROM (Benchmark Database):
TRAIN/BINANUMS/BD/*
TEST/BINANUMS/BD/*
TRAIN/CITIES/BD/*
TEST/CITIES/BD/*
All the images were black & white lower case characters
and stored in PBM format. All useless white spaces
around the images have been removed.
2.1.2 Character resizing
Resizing was the first technique used to process the
images. The resizing process partially employed an
existing program written by R. Crane [16] using the C
programming language, which was modified by us, and
all the images were resized to 30 rows by 40 columns.
2.1.3 Chain code feature extraction
For all the training and test characters, the character
images were first boundaried, all the pixels of each
image were changed to the background colour, except
the outmost ones of the image. The images were then
processed using chain code technique with 8 directions.
After chain coding, each image was divided into some
small sub-images whose size was 10 rows by 10
columns. The numbers of each direction in a single sub-
window were added, and these numbers were recorded to
be used later. After all the images were chain coded, all
the numbers were divided by the biggest one among
them to create the inputs whose maximum value was 1
and minimum value was 0, each character had 12 * 8
=96 inputs.
3. EXPERIMENTAL METHOD
There were a total of three character feature
extraction/recognition techniques investigated in this
research: AA, MLP and Multi-MLP. The BP algorithm
was employed as a common training algorithm. The
networks used were feed-forward neural networks. There
was only one hidden layer for all kinds of networks in
this research. The number of neurons in the input layer of
all these extractor was governed by the size of the sub-
windows of the training characters. Training character
matrices had 30 rows by 40 columns, and the sub-
window had the size 10 rows by 10 columns. So each
image had 12 sub-windows, since each sub-window
contributed 8 elements, the number of units in the input
layer was 96.
3.1 Auto-associator (AA) feature extractor
An AA, as its name implies, is a network that learns an
input-output mapping such that the output is the same as
the input, in other words, the target data set is identical to
the input data set. Hence, an AA has configuration of d:
m: d with d units in both the input and output layers and
m<d in the hidden layer.
The dimensionality of the input and output is obviously
the same and the network is trained, using the error back
propagation algorithm, to generate output vectors o as
close as possible to the input vectors x by again
minimizing the mean squared error over all patterns in
the training set:
∑∑
= =
−=
p
p
k
k
p
k
p
k
xo
E
1 1
2)(2/1
where
o
p
k
represents the kth output of the nth input
vector
x
n
=(
x
n
1
….
x
n
k
, …
x
n
d
) and N is the number of
training patterns.
The key aspect of the auto associative MLP is that the
number of hidden units at the center of the network is
usually chosen to be much smaller than the input/output
dimensionality. As a result of this bottleneck, the hidden
units extract a low-dimensional representation of the
input data and such a network can therefore be used for
feature extraction.
0-7803-7278-6/02/$10.00 ©2002 IEEE
To be consistent with all the neural networks being
compared in this research, the training file was set to the
same format, they all consisted of two parts. The first
part was obtained by chain coding as described
previously. For the AA, the second part was exactly the
same as the first part.
3.2 MLP
The values of the MLP’s learning rate and momentum
were both set to 0.1 as those of the AA. The number of
inputs and outputs were set to 96 and 24, respectively.
The number of hidden units of MLP was set to 26.
The input vector of the MLP was obtained by employing
the chain code feature extractor as described previously,
the second part was the output vector. This part indicates
to the network which class the current character belongs
to.
3.3 Multi-MLP
For the Multi-MLP feature extractor, the situation was
different. The possible outputs governed the number of
neural networks instead of the number of output units.
Each neural network had only 2 units in the output layer,
in other words, each neural network was dedicated to
recognize one letter. The hidden units of these networks
were all set to 26.
The input vector to the Multi-MLP was the same as for
the AA and MLP, but the desired output of the Multi-
MLP only had two classes.
3.4 Criteria for training termination
When using the back propagation algorithm, the usual
criterion for termination is the reduction of the Root
Mean Squared (RMS) error to an acceptable level. There
is no general level for the RMS error, however, the
smaller, the better. It was found in experiments, the
convergence of the RMS error was very slow, therefore,
another criterion for termination that was considered,
was to set the network to stop training after a certain
number of iterations.
4. EXPERIMENTAL RESULTS
The proposed approaches were all implemented and run
on SP2 supercomputer and on the NIAS (UNIX)
machine at Griffith University. SP2 is an IBM-based
product that consists of eight RS/6000 390 machines and
14 RS/6000 590 machines connected by a high speed
switch. The operation system is UNIX. The
programming language used for implementation was C.
This section shows the results obtained by using the three
neural network based character feature extraction
techniques. In this research, the training data set consists
of 16 lowercase letters: a, b, c, d, e, h, i, l, m, n, o, r, s, t,
u, x. After training, the three techniques were assessed by
their classification rates for both training data and test
data. There were many experiments conducted, all of
them were very time consuming. Sometime it took more
than several days. Only the most relevant results shall be
shown in this and following sections.
4.1 Preliminary results
Before training these networks with 16 letters, some
preliminary experiments were conducted. In these
experiments, only the AA and the MLP were trained and,
instead of 16 letters, only four letters were chosen: a, c,
d, e. All training characters were hand printed characters.
There were 96 training pairs. Both the MLP and the AA
were trained with 2000 iterations. The number of test
characters was 181. The results are displayed in Table 1
below. There were two AAs were trained, one AA had
26 hidden units and the other AA had 96 hidden units.
As can be seen from Table 1, the classification rates of
the training data were 100%. The classification rates for
the test data were quite high as well. All of them were
between 82% and 87%. Of course, the classification
would be lower than these figures if the number of
classes increased, but these figures were very promising
for doing more research. Subsequent experiments used
more classes and larger datasets, more and more images
were segmented from the handwritten words, which were
very hard to recognize, so that these ANNs could be
trained with a more diverse and challenging training set.
TABLE 1. PRELIMINARY RESULTS
(#inputs: 96)
Classification
Rate (%)
MLP
/AA
No. of
hidden
units
No.
of
outp
uts
RMS
Training
set
Test
set
MLP 26 4 0.01252 100 82.3
AA 26 96 0.03259 100 86.7
AA 96 96 0.02989 100 83.9
4.2 Classification rates for the MLP
After doing some preliminary experiments, the number
of letters in the training and test database were increased
from 4 to 16. The numbers of characters in training and
test database were increased as well. The MLP based
network is a very popular character recognition
technique and has been widely used in many fields. So
the major comparison of work was conducted between
the MLP and the AA. The results in Table 1 (rows 1, 2)
were obtained by training the MLP with 352 hand
printed characters. The test data set presented to the MLP
was 280 hand printed characters. The MLP was trained
0-7803-7278-6/02/$10.00 ©2002 IEEE
with 2000 and 5000 iterations, respectively. As can be
seen from Table 2, the classification rate for the training
set was 99.7% for two MLPs, near 100%. Test sets of
two MLPs obtained high figures as well: 78.2%.
TABLE 2. CLASSIFICATION RATES USING MLP
(#inputs: 96, #outputs: 24, #hidden units: 26)
Classification Rate
(%)
Training
pairs
No. of
iterations
RMS
Training
set
Test
Set
352 2000 0.0141 99.7 78.2
352 5000 0.0118 99.7 78.2
506 5000 0.0184 94.4 52.8
656 5000 0.0604 91.5 55.1
951 5000 0.0678 94.2 60
The results in Table 2 (rows 3,4,5) were obtained by
adding more and more cursive characters to the previous
training data set. At the beginning, there were no cursive
characters, there were only 352 hand-printed characters
in the training data set. The number of cursive characters
was increased from 0 to 144, 304 and 599. Accordingly,
the number of training characters increased from 352 to
506, 656, 951.
TABLE 3. CLASSIFICATION RATES FOR TWO MLPS
Classification Rate (%)
Trai
ning
pairs
No. of
Iteratio
ns
RMS
Training
set
Test
set
Test
(top5)
656 5,000 0.0604 92.3 60.2 79.8
614 5,000 0.0505 93.9 60.8 86.1
The above table (Table 3) contains the classification
rates for two MLPs. The result in first row was trained
by all 16 letters including l, but tested without l. The
second one was trained and tested without l:
4.3 Classification rates for the AA
The comparison of performance between the AA and the
MLP was the major aim of this research. The results in
Table 4 (rows 1,2,3,4) were obtained by training the AA
with 352 characters. The test data set presented to the
AA was 280 characters. To achieve better results, two
AAs with a different number of hidden units were
trained. One AA had 26 hidden units, so the structure of
its classifier was 26 inputs, 26 hidden units and 24 output
units. The second AA had 96 hidden units, accordingly,
the structure of its classifier was 96 input units, 26
hidden units and 24 output units. The two kinds of AA
were trained for 2000 and 5000 iterations respectively.
TABLE 4. CLASSIFICATION RATES FOR AA
(#inputs: 96, #outputs: 96)
Classification
Rate(%)
No. of
training
chars
No. of
hidden
units
No.
of
Itera
tions
RMS
Training
set
Test
set
352 26 2000 0.0240 97.4 75
352 26 5000 0.0317 98.9 76.1
352 96 2000 0.0240 99.4 76.8
352 96 5000 0.0180 99.7 78.2
506 96 5000 0.0482 95.1 53.3
656 96 5000 0.0592 94.4 56.7
951 96 5000 0.0650 94.3 61.9
As can be seen from the above table, the AA with 96
hidden units outperforms the AA with 26 hidden units.
Therefore the subsequent experiments were only
conducted using an AA with 96 hidden units.
The results listed in Table 4 (last 3 rows) were obtained
by adding the previous training and test data sets, which
contained only hand printed characters, to some cursive
characters from data set B as used in the case with the
MLP. The number of iterations for all experiments was
5000. The number of hidden units of AA was 96. The
classifier had 26 hidden units. The training pairs were
increased from 352 to 506, 656 and 951. The test set had
1,056 training pairs. As can be seen from the above table,
the classification rates increased when the number of
training pairs increased. Of course, since the number of
training iterations for each AA was 5000, the
classification rate for the training set decreased when the
number of training pairs increased. As the RMS error
increased, the classification rates of the training set
decreased, in this case, from 95.1% to 94.3%.
Compared with its MLP counterpart, some letters
obtained higher classification rates. For example, letter l
obtained a 17.9% increase in classification rate, whereas
letter a decreased by 11.9%. No changes to the
classification rate of letter x. In total 8 letters of the AA
obtained higher classification rates than the MLP, 7
letters obtained lower classification rates, they were
letters a, b, d, e, h, i, m, respectively.
4.4 Classification rates for the Multi-MLP
Multi-MLP was the one that had 16 neural networks each
of which had only two classes. The training files were
different to each of these networks. Each network was
0-7803-7278-6/02/$10.00 ©2002 IEEE
designed to respond to a particular letter. Each network
had only two classes. The first one was trained to
respond to a given letter. The other one was trained to
respond to the rest of the letters. Since it was very time
consuming, only one experiment was conducted so far:
the number of training pairs for each network was 951,
the same as for the MLP and the AA. Some of its testing
results are listed in Table 5.
TABLE 5. CLASSIFICATION RATES OF MULTI-MLP
(#inputs: 96, #outputs: 2, #hidden units: 26)
Classification Rate (%)
Multi
-MLP
RMS
Training
set
Test
set
Test
(top5)
A 0.072687 93.5 56.3 81.0
B 0.065042 92.9 50.0 75.0
C 0.056367 96.7 65.4 94.3
D 0.046068 96.7 81.3 100
E 0.072770 90.3 57.6 79.7
H 0.117057 80.6 52.8 88.9
I 0.08604 90.3 57.9 86.3
L 0.12983 74.2 31.9 76.8
M 0.032646 98.4 72.7 95.5
N 0.102719 83.9 46.3 73.1
O 0.010263 83.9 67.0 91.3
R 0.072746 93.5 56.0 93.3
S 0.079608 90.3 56.9 81.5
T 0.046014 96.8 75.7 98.6
U 0.056317 95.2 64.7 100
X 0.056279 85.2 66.7 83.3
These results were obtained by training the multi-MLP
with the same training characters as those used to train
MLP and AA and test characters were the same as those
of MLP and AA as well. But the number of classes of
each network was only 2 rather than 24. The number of
iterations for all networks was 5000. As can be seen, the
RMS for different MLP were varied dramatically, and
the classification rates of these MLP were also different,
the highest one was 81.3%, the lowest one was 31.9%.
5. DISCUSSION
5.1 Classification rate
As can be seen from the tables in previous section,
among three feature extraction techniques, the AA
provided the top results for character recognition: 61.9%
for the test set and 94.3% for the training set, The second
best one was the MLP, followed by Multi-MLP, whose
classification rate for the training set was 94.1%, and the
test set was 57.1%. From the experiments we can
observe that increasing the number of training pairs for
the AA or the MLP is a good way to increase the
classification rates, but the characters added were all
cursive characters. Does that increase the classification
rates of the hand printed character section which has 280
out of a total of 1056 characters in test dataset? The
classification rates for only the 280 hand printed
characters rather than the whole test set were calculated.
From above, we can observe that when the number of
cursive characters in the training dataset of the MLP
increased from 0 to 599, the classification rates for
printed characters only increased by 0.7%. Meanwhile,
the classification rates for cursive characters dramatically
increased from 30.4% to 53.2%. As can be seen, when
the number of cursive characters in the training dataset of
the AA increased from 0 to 599, the classification rates
for printed characters only increased by 1.9%. Even so, it
is better than the MLP ‘s 0.7% increase. Meanwhile, the
classification rates for cursive characters dramatically
increased from 26.2% to 55.9%, the percentage increase
was 29.7%, while the MLP counterpart was 22.8%.
5.2 General problems with classification rates
It was found that when the number of training pairs was
increased to 951 and the number of iterations was set to
5,000, the best classification rate for handwritten
characters using the three feature extraction techniques
was less than 62%. Increasing the number of iterations
did little to improve the classification rates. It was
deduced that three main factors influenced the
classification rates obtained by these techniques: Small
training dataset, Difficulty of training and testing data,
Resizing problems, Similarity of characters.
5.2.1 Small training data set
As can be seen from the previous experiments, the
classification rate increased when the number of training
pairs increased. For example, when the number of
training pairs increased by 150 from 506 to 656. The
classification rate increased by 3.4 percent. When 295
more training pairs were added to obtain a total of 951,
the classification rate increased by 5.2 percent
accordingly. A 60 percent classification rate is quite high
considering that a maximum of 951 training pairs was
used. Due to time constraints, more training pairs were
not employed.
5.2.2 Difficulty of training and testing data
The other factor that influenced the recognition rate was
the nature of the handwritten data. As the characters
sampled were real world characters, it was found that the
actual writing styles of two different people could be
extremely diverse. Misclassification could easily occur
by both human and automated systems. The diversity of
characters was not only shown between people, but also
between samples of the same person. This increased the
difficulty of training and test data dramatically. The
following characters (Figure 2) are some samples for
lowercase b:
0-7803-7278-6/02/$10.00 ©2002 IEEE
Figure 2. Examples of lowercase b
The other important reason was that some training and
test samples were segmented from handwritten words,
sometimes they became very hard to recognize (Figure
3) even for a human.
(a) (b) (c)
Figure 3. Examples of segmented characters. (a) Lowercase r,
(b) Lowercase s, (c) Lowercase x.
5.2.3 Resizing problems
Because the sizes of training and test images were
different from each other, all the characters were resized
to the same size before being chain coded in order to
attain more comparable features. However, one of the
major disadvantages of resizing is that it can cause some
of the character’s characteristics to be lost, and that may
be critical for extracting features.
5.2.4 Similarity of characters
After analyzing the tables describing target and actual
outputs of each class, we found that some classes had
very high classification rates, whereas some others got as
low as 40%. After further analysis, it was found that
some letters were easily recognized as some other
particular letters. For example, the letter l was easily
recognized as letter e or letter i. It has been found that
about 20 percent of some letters were recognized as the
other letters, such as 19.6 percent of l’s were recognized
as e’s.
6. CONCLUSIONS
We have investigated neural network based 3 feature
extraction techniques. The Auto-associator feature
extractor proposed by us, achieved the highest
recognition rates. The highest rate for difficult
handwritten characters from CEDAR benchmark
database were approximately 61.9%. The classification
rate was quite high considering it only used 951 training
pairs and 5,000 iterations. The classification rates of the
MLP were lower than those of the AA. The best
classification result for handwritten characters was
60.0% (1.9% less than the AA). The recognition rates
and overall performance of the Multi-MLP were the
lowest of all three techniques tested. The highest
classification rate it provided was 57.1% (4.8% lower
than the AA and 2.9% lower than the MLP), and this
method took the longest training time.
References
[1] J. Mao, A. K. Jain, Artificial neural networks for feature extraction
and multivariate data projection. IEEE Trans. Neural Networks 6,
296 –317, 1995.
[2] B. Lerner, Toward a completely automatic neural network based
human chromosome analysis. IEEE Trans, Syst. Man Cyber. 28,
Part B, Special issue on artificial neural networks, 544-552, 1998.
[3] B. Lerner, H. Guterman, Mayer Aladjem, A comparative study of
neural network based feature extraction paradigms. Pattern
Recognition. Vol 20, 1999.
[4] M. E. Stevens, Introduction to the special issue on optical character
recognition (OCR), Pattern Recognition 2, 147 – 150, 1970.
[5] J. Rabinow, Whither OCR and whence Datamation. 38 – 42, July
1969.
[6] P. L. Andersson, Optical character recognition – a survey.
Datamation, 43 – 48, July 1969.
[7] J. Mantas, An overview of character recognition methodologies,
Pattern Recognition 19, 425 –430 1986.
[8] R. Davis and J. L. Yall, Recognition of handwritten characters – a
review, Image vision Comput. 4, 208 –218.
[9] Y. Cheng and C. H. Leung, Chain – code transform for chinese
character recognition, IEEE 1985, Proc. Int. Conf. Cyb. Soc.
Tucson, AZ, U.S.A. pp. 42 – 45, 1985.
[10] H. I. Avi-Itzhak, T. A. Diep, and H. Garland, “High accuracy
optical character recognition using neural networks with centroid
dithering”, IEEE Trans. Pattern Analysis and Machine
Intelligence, Vol. 17, pp. 218-224, 1995.
[11] S-W. Lee, “Off-Line Recognition of totally unconstrained
handwritten numerals using multilayer cluster neural network”,
IEEE Trans. Pattern Analysis and Machine Intelligence, Vol. 18,
pp. 648-652, 1996.
[12] S-B. Cho, “Neural-network classifiers for recognizing totally
unconstrained handwritten numerals”, IEEE Trans. on Neural
Networks, Vol. 8, pp. 43-53, 1997.
[13] N.W. Strathy, C.Y. Suen, and A. Krzyzak, “Segmentation of
handwritten digits using contour features”, ICDAR ‘93, pp. 577-
580, 1993.
[14] B. A. Yanikoglu, and P. A. Sandon, “Off-line cursive handwriting
recognition using style parameters”, Tech. Report PCS-TR93-192,
Dartmouth College, NH., 1993.
[15] J-H. Chiang, “A hybrid neural model in handwritten word
recognition”, Neural Networks, Vol. 11, pp. 337-346, 1998.
[16] R. Crane, A simplified approach to image processing: classical
and modern techniques in C. Prentice Hall. 1996.
0-7803-7278-6/02/$10.00 ©2002 IEEE