Astm d 86 17
Bạn đang xem bản rút gọn của tài liệu. Xem và tải ngay bản đầy đủ của tài liệu tại đây (1.12 MB, 29 trang )
This international standard was developed in accordance with internationally recognized principles on standardization established in the Decision on Principles for the
Development of International Standards, Guides and Recommendations issued by the World Trade Organization Technical Barriers to Trade (TBT) Committee.
Designation: D86 − 17
Standard Test Method for
Distillation of Petroleum Products and Liquid Fuels at
Atmospheric Pressure1
This standard is issued under the fixed designation D86; the number immediately following the designation indicates the year of original
adoption or, in the case of revision, the year of last revision. A number in parentheses indicates the year of last reapproval. A superscript
epsilon (´) indicates an editorial change since the last revision or reapproval.
This standard has been approved for use by agencies of the U.S. Department of Defense.
its vapor, may be hazardous to health and corrosive to
materials. Caution should be taken when handling mercury and
mercury containing products. See the applicable product Material Safety Data Sheet (MSDS) for details and EPA’s
website— additional information. Users should be aware that selling mercury
and/or mercury containing products into your state or country
may be prohibited by law.
1.6 This standard does not purport to address all of the
safety concerns, if any, associated with its use. It is the
responsibility of the user of this standard to establish appropriate safety and health practices and determine the applicability of regulatory limitations prior to use.
1.7 This international standard was developed in accordance with internationally recognized principles on standardization established in the Decision on Principles for the
Development of International Standards, Guides and Recommendations issued by the World Trade Organization Technical
Barriers to Trade (TBT) Committee.
1. Scope*
1.1 This test method covers the atmospheric distillation of
petroleum products and liquid fuels using a laboratory batch
distillation unit to determine quantitatively the boiling range
characteristics of such products as light and middle distillates,
automotive spark-ignition engine fuels with or without oxygenates (see Note 1), aviation gasolines, aviation turbine fuels,
diesel fuels, biodiesel blends up to 20 %, marine fuels, special
petroleum spirits, naphthas, white spirits, kerosines, and
Grades 1 and 2 burner fuels.
NOTE 1—An interlaboratory study was conducted in 2008 involving 11
different laboratories submitting 15 data sets and 15 different samples of
ethanol-fuel blends containing 25 % volume, 50 % volume, and 75 %
volume ethanol. The results indicate that the repeatability limits of these
samples are comparable or within the published repeatability of the
method (with the exception of FBP of 75 % ethanol-fuel blends). On this
basis, it can be concluded that Test Method D86 is applicable to
ethanol-fuel blends such as Ed75 and Ed85 (Specification D5798) or other
ethanol-fuel blends with greater than 10 % volume ethanol. See ASTM
RR:D02-1694 for supporting data.2
1.2 The test method is designed for the analysis of distillate
fuels; it is not applicable to products containing appreciable
quantities of residual material.
2. Referenced Documents
2.1 All standards are subject to revision, and parties to
agreement on this test method are to apply the most recent
edition of the standards indicated below, unless otherwise
specified, such as in contractual agreements or regulatory rules
where earlier versions of the method(s) identified may be
required.
1.3 This test method covers both manual and automated
instruments.
1.4 Unless otherwise noted, the values stated in SI units are
to be regarded as the standard. The values given in parentheses
are provided for information only.
2.2 ASTM Standards:3
D97 Test Method for Pour Point of Petroleum Products
D323 Test Method for Vapor Pressure of Petroleum Products
(Reid Method)
D4057 Practice for Manual Sampling of Petroleum and
Petroleum Products
D4175 Terminology Relating to Petroleum Products, Liquid
Fuels, and Lubricants
1.5 WARNING—Mercury has been designated by many
regulatory agencies as a hazardous material that can cause
central nervous system, kidney and liver damage. Mercury, or
1
This test method is under the jurisdiction of ASTM Committee D02 on
Petroleum Products, Liquid Fuels, and Lubricants and is the direct responsibility of
Subcommittee D02.08 on Volatility.
In the IP, the equivalent test method is published under the designation IP 123.
It is under the jurisdiction of the Standardization Committee.
Current edition approved May 1, 2017. Published June 2017. Originally
approved in 1921. Last previous edition approved in 2016 as D86 – 16a. DOI:
10.1520/D0086-17.
2
Supporting data have been filed at ASTM International Headquarters and may
be obtained by requesting Research Report RR:D02-1694.
3
For referenced ASTM standards, visit the ASTM website, www.astm.org, or
contact ASTM Customer Service at For Annual Book of ASTM
Standards volume information, refer to the standard’s Document Summary page on
the ASTM website.
*A Summary of Changes section appears at the end of this standard
Copyright © ASTM International, 100 Barr Harbor Drive, PO Box C700, West Conshohocken, PA 19428-2959. United States
1
D86 − 17
3.1.5 emergent stem effect, n—the offset in temperature
reading caused by the use of total immersion mercury-in-glass
thermometers in the partial immersion mode.
3.1.5.1 Discussion—In the partial immersion mode, a portion of the mercury thread, that is, the emergent portion, is at
a lower temperature than the immersed portion, resulting in a
shrinkage of the mercury thread and a lower temperature
reading.
3.1.6 end point (EP) or final boiling point (FBP), n—the
maximum corrected thermometer reading obtained during the
test.
3.1.6.1 Discussion—This usually occurs after the evaporation of all liquid from the bottom of the flask. The term
maximum temperature is a frequently used synonym.
3.1.7 front end loss, n—loss due to evaporation during
transfer from receiving cylinder to distillation flask, vapor loss
during the distillation, and uncondensed vapor in the flask at
the end of the distillation.
3.1.8 fuel ethanol (Ed75-Ed85), n—blend of ethanol and
hydrocarbon of which the ethanol portion is nominally 75 % to
85 % by volume denatured fuel ethanol.
D4175
3.1.9 initial boiling point (IBP), n—in D86 distillation, the
corrected temperature reading at the instant the first drop of
condensate falls from the lower end of the condenser tube.
3.1.10 percent evaporated, n—in distillation, the sum of the
percent recovered and the percent loss.
3.1.10.1 percent loss, n— in distillation, one hundred minus
the percent total recovery.
3.1.10.2 corrected loss, n—percent loss corrected for barometric pressure.
3.1.11 percent recovered, n—in distillation, the volume of
condensate collected relative to the sample charge.
3.1.11.1 percent recovery, n—in distillation, maximum percent recovered relative to the sample charge.
3.1.11.2 corrected percent recovery, n—in distillation, the
percent recovery, adjusted for the corrected percent loss.
3.1.11.3 percent total recovery, n—in distillation, the combined percent recovery and percent residue.
3.1.12 percent residue, n—in distillation, the volume of
residue relative to the sample charge.
3.1.13 rate of change (or slope), n—the change in temperature reading per percent evaporated or recovered, as described
in 13.2.
3.1.14 sample charge, n—the amount of sample used in a
test.
3.1.15 temperature lag, n—the offset between the temperature reading obtained by a temperature sensing device and the
true temperature at that time.
3.1.16 temperature measurement device, n—a thermometer,
as described in 6.3.1, or a temperature sensor, as described in
6.3.2.
3.1.16.1 temperature reading, n—the temperature obtained
by a temperature measuring device or system that is equal to
the thermometer reading described in 3.1.16.3.
D4177 Practice for Automatic Sampling of Petroleum and
Petroleum Products
D4953 Test Method for Vapor Pressure of Gasoline and
Gasoline-Oxygenate Blends (Dry Method)
D5190 Test Method for Vapor Pressure of Petroleum Products (Automatic Method) (Withdrawn 2012)4
D5191 Test Method for Vapor Pressure of Petroleum Products (Mini Method)
D5798 Specification for Ethanol Fuel Blends for FlexibleFuel Automotive Spark-Ignition Engines
D5842 Practice for Sampling and Handling of Fuels for
Volatility Measurement
D5949 Test Method for Pour Point of Petroleum Products
(Automatic Pressure Pulsing Method)
D5950 Test Method for Pour Point of Petroleum Products
(Automatic Tilt Method)
D5985 Test Method for Pour Point of Petroleum Products
(Rotational Method)
D6300 Practice for Determination of Precision and Bias
Data for Use in Test Methods for Petroleum Products and
Lubricants
D6708 Practice for Statistical Assessment and Improvement
of Expected Agreement Between Two Test Methods that
Purport to Measure the Same Property of a Material
E1 Specification for ASTM Liquid-in-Glass Thermometers
E77 Test Method for Inspection and Verification of Thermometers
E1272 Specification for Laboratory Glass Graduated Cylinders
E1405 Specification for Laboratory Glass Distillation Flasks
2.3 Energy Institute Standards:5
IP 69 Determination of Vapour Pressure—Reid Method
IP 123 Petroleum Products—Determination of Distillation
Characteristics
IP 394 Determination of Air Saturated Vapour Pressure
IP Standard Methods for Analysis and Testing of Petroleum
and Related Products 1996—Appendix A
3. Terminology
3.1 Definitions:
3.1.1 decomposition, n—of a hydrocarbon, the pyrolysis or
cracking of a molecule yielding smaller molecules with lower
boiling points than the original molecule.
3.1.2 decomposition point, n—in distillation, the corrected
temperature reading that coincides with the first indications of
thermal decomposition of the specimen.
3.1.3 dry point, n—in distillation, the corrected temperature
reading at the instant the last drop of liquid evaporates from the
lowest point in the flask.
3.1.4 dynamic holdup, n—in D86 distillation, the amount of
material present in the neck of the flask, in the sidearm of the
flask, and in the condenser tube during the distillation.
4
The last approved version of this historical standard is referenced on
www.astm.org.
5
Available from Energy Institute, 61 New Cavendish St., London, WIG 7AR,
U.K., .
2
D86 − 17
3.1.16.2 corrected temperature reading, n—the temperature
reading, as described in 3.1.16.1, corrected for barometric
pressure.
3.1.16.3 thermometer reading (or thermometer result),
n—the temperature of the saturated vapor measured in the neck
of the flask below the vapor tube, as determined by the
prescribed thermometer under the conditions of the test.
3.1.16.4 corrected thermometer reading, n—the thermometer reading, as described in 3.1.16.3, corrected for barometric
pressure.
4. Summary of Test Method
4.1 Based on its composition, vapor pressure, expected IBP
or expected EP, or combination thereof, the sample is placed in
one of four groups. Apparatus arrangement, condenser
temperature, and other operational variables are defined by the
group in which the sample falls.
4.2 A 100 mL specimen of the sample is distilled under
prescribed conditions for the group in which the sample falls.
The distillation is performed in a laboratory batch distillation
unit at ambient pressure under conditions that are designed to
provide approximately one theoretical plate fractionation. Systematic observations of temperature readings and volumes of
condensate are made, depending on the needs of the user of the
data. The volume of the residue and the losses are also
recorded.
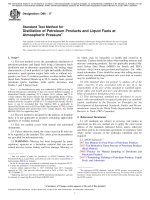
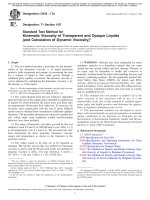
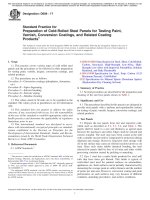
FIG. 1 Apparatus Assembly Using Gas Burner
temperature or at high altitude, or both. The presence of high
boiling point components in these and other fuels can significantly affect the degree of formation of solid combustion
deposits.
4.3 At the conclusion of the distillation, the observed vapor
temperatures can be corrected for barometric pressure and the
data are examined for conformance to procedural
requirements, such as distillation rates. The test is repeated if
any specified condition has not been met.
5.4 Volatility, as it affects rate of evaporation, is an important factor in the application of many solvents, particularly
those used in paints.
4.4 Test results are commonly expressed as percent evaporated or percent recovered versus corresponding temperature,
either in a table or graphically, as a plot of the distillation
curve.
5.5 Distillation limits are often included in petroleum product specifications, in commercial contract agreements, process
refinery/control applications, and for compliance to regulatory
rules.
5. Significance and Use
6. Apparatus
5.1 The basic test method of determining the boiling range
of a petroleum product by performing a simple batch distillation has been in use as long as the petroleum industry has
existed. It is one of the oldest test methods under the jurisdiction of ASTM Committee D02, dating from the time when it
was still referred to as the Engler distillation. Since the test
method has been in use for such an extended period, a
tremendous number of historical data bases exist for estimating
end-use sensitivity on products and processes.
6.1 Basic Components of the Apparatus:
6.1.1 The basic components of the distillation unit are the
distillation flask, the condenser and associated cooling bath, a
metal shield or enclosure for the distillation flask, the heat
source, the flask support, the temperature measuring device,
and the receiving cylinder to collect the distillate.
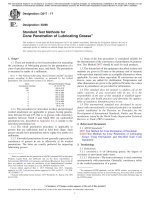
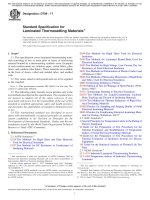
6.1.2 Figs. 1 and 2 are examples of manual distillation units.
6.1.3 In addition to the basic components described in 6.1.1,
automated units also are equipped with a system to measure
and automatically record the temperature and the associated
recovered volume in the receiving cylinder.
5.2 The distillation (volatility) characteristics of hydrocarbons have an important effect on their safety and performance,
especially in the case of fuels and solvents. The boiling range
gives information on the composition, the properties, and the
behavior of the fuel during storage and use. Volatility is the
major determinant of the tendency of a hydrocarbon mixture to
produce potentially explosive vapors.
6.2 A detailed description of the apparatus is given in Annex
A2.
6.3 Temperature Measuring Device:
6.3.1 Mercury-in-glass thermometers, if used, shall be filled
with an inert gas, graduated on the stem and enamel backed.
They shall conform to Specification E1 or IP Standard Methods
for Analysis and Testing of Petroleum and Related Products
5.3 The distillation characteristics are critically important
for both automotive and aviation gasolines, affecting starting,
warm-up, and tendency to vapor lock at high operating
3
D86 − 17
1–Condenser bath
2–Bath cover
3–Bath temperature sensor
4–Bath overflow
5–Bath drain
6–Condenser tube
7–Shield
8–Viewing window
9a–Voltage regulator
9b–Voltmeter or ammeter
9c–Power switch
9d–Power light indicator
10–Vent
11–Distillation flask
12–Temperature sensor
13–Flask support board
14–Flask support platform
15–Ground connection
16–Electric heater
17–Knob for adjusting level
of support platform
18–Power source cord
19–Receiver cylinder
20–Receiver cooling bath
21–Receiver cover
FIG. 2 Apparatus Assembly Using Electric Heater
4
D86 − 17
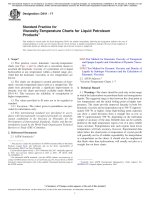
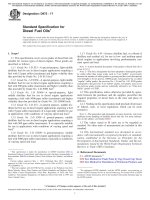
FIG. 3 PTFE Centering Device for Ground Glass Joint
1996—Appendix A, or both, for thermometers ASTM 7C/IP
5C and ASTM 7F for the low range thermometers, and ASTM
8C/IP 6C and ASTM 8F for the high range thermometers.
6.3.1.1 Thermometers that have been exposed for an extended period above an observed temperature of 370 °C shall
not be reused without a verification of the ice point or checked
as prescribed in Specification E1 and Test Method E77.
NOTE 2—At an observed thermometer reading of 370 °C, the temperature of the bulb is approaching a critical range in the glass and the
thermometer may lose its calibration.
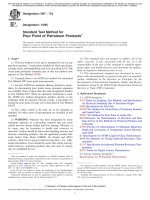
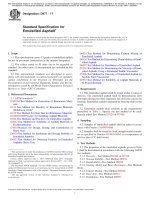
FIG. 4 Example of Centering Device Designs for Straight-Bore
Neck Flasks
6.3.2 Temperature measurement systems other than those
described in 6.3.1 are satisfactory for this test method, provided that they exhibit the same temperature lag, emergent
stem effect, and accuracy as the equivalent mercury-in-glass
thermometer.
6.3.2.1 The electronic circuitry or the algorithms, or both,
used shall include the capability to simulate the temperature lag
of a mercury-in-glass thermometer.
6.3.2.2 Alternatively, the sensor can also be placed in a
casing with the tip of the sensor covered so that the assembly,
because of its adjusted thermal mass and conductivity, has a
temperature lag time similar to that of a mercury-in-glass
thermometer.
FIG. 5 Position of Thermometer in Distillation Flask
NOTE 3—In a region where the temperature is changing rapidly during
the distillation, the temperature lag of a thermometer can be as much as 3
s.
6.3.3 In case of dispute, the referee test method shall be
carried out with the specified mercury-in-glass thermometer.
6.5 Automated equipment manufactured in 1999 and later
shall be equipped with a device to automatically shut down
power to the unit and to spray an inert gas or vapor in the
chamber where the distillation flask is mounted in the event of
fire.
6.4 Temperature Sensor Centering Device:
6.4.1 The temperature sensor shall be mounted through a
snug-fitting device designed for mechanically centering the
sensor in the neck of the flask without vapor leakage. Examples
of acceptable centering devices are shown in Figs. 3 and 4.
(Warning—The use of a plain stopper with a hole drilled
through the center is not acceptable for the purpose described
in 6.4.1.)
NOTE 6—Some causes of fires are breakage of the distillation flask,
electrical shorts, and foaming and spilling of liquid sample through the top
opening of the flask.
6.6 Barometer—A pressure measuring device capable of
measuring local station pressure with an accuracy of 0.1 kPa
(1 mm Hg) or better, at the same elevation relative to sea level
as the apparatus in the laboratory. (Warning—Do not take
readings from ordinary aneroid barometers, such as those used
at weather stations and airports, since these are precorrected to
give sea level readings.)
NOTE 4—Other centering devices are also acceptable, as long as they
position and hold the temperature sensing device in the proper position in
the neck of the distillation column, as shown in Fig. 5 and described in
10.5.
NOTE 5—When running the test by the manual method, products with
a low IBP may have one or more readings obscured by the centering
device. See also 10.14.3.1.
5
D86 − 17
TABLE 1 Group Characteristics
Group 1
Group 2
Sample
characteristics
Distillate type
Vapor pressure at
37.8 °C, kPa
$65.5
<65.5
100 °F, psi
$9.5
<9.5
(Test Methods D323, D4953, D5190, D5191,
D5842, IP 69 or IP 394)
Distillation, IBP °C
°F
EP °C
#250
#250
°F
#482
#482
Group 3
Group 4
<65.5
<9.5
<65.5
<9.5
#100
#212
>250
>482
>100
>212
>250
>482
7.4 Sample Conditioning Prior to Analysis:
7.4.1 Samples shall be conditioned to the temperature
shown in Table 2 before opening the sample container.
7.4.1.1 Groups 1 and 2—Samples shall be conditioned to a
temperature of less than 10 °C (50 °F) before opening the
sample container, except when the sample is to be immediately
tested and is already at the prescribed sample temperature in
Table 3.
7.4.1.2 Groups 3 and 4—If the sample is not fluid at ambient
temperature, it is to be heated to a temperature of 9 °C to 21 °C
above its pour point (Test Method D97, D5949, or D5985)
prior to analysis. If the sample has partially or completely
solidified during storage, it shall be vigorously shaken after
melting prior to opening the sample container to ensure
homogeneity.
7.4.1.3 If the sample is not fluid at room temperature, the
temperature ranges shown in Table 2 for the flask and for the
sample do not apply.
7. Sampling, Storage, and Sample Conditioning
7.1 Determine the Group characteristics that correspond to
the sample to be tested (see Table 1). Where the procedure is
dependent upon the group, the section headings will be so
marked.
7.5 Wet Samples:
7.5.1 Samples of materials that visibly contain water are not
suitable for testing. If the sample is not dry, obtain another
sample that is free from suspended water.
7.5.2 Groups 1 and 2—If such a sample cannot be obtained,
the suspended water can be removed by maintaining the
sample at 0 °C to 10 °C, adding approximately 10 g of anhydrous sodium sulfate per 100 mL of sample, shaking the
mixture for approximately 2 min, and then allowing the mixture to settle for approximately 15 min. Once the sample shows
no visible signs of water, use a decanted portion of the sample,
maintained between 1 °C and 10 °C, for the analysis. Note in
the report that the sample has been dried by the addition of a
desiccant.
7.2 Sampling:
7.2.1 Sampling shall be done in accordance with Practice
D4057 or D4177 and as described in Table 2.
7.2.1.1 Group 1—Condition the sample container to below
10°C, preferably by filling the bottle with the cold liquid
sample and discarding the first sample. If this is not possible
because, for instance, the product to be sampled is at ambient
temperature, the sample shall be drawn into a bottle prechilled
to below 10 °C, in such a manner that agitation is kept at a
minimum. Close the bottle immediately with a tight-fitting
closure. (Warning—Do not completely fill and tightly seal a
cold bottle of sample because of the likelihood of breakage on
warming.)
7.2.1.2 Groups 2, 3, and 4—Collect the sample at ambient
temperature. After sampling, close the sample bottle immediately with a tight-fitting closure.
7.2.1.3 If the sample received by the testing laboratory has
been sampled by others and it is not known whether sampling
has been performed as described in 7.2, the sample shall be
assumed to have been so sampled.
NOTE 9—Suspended water in hazy samples in Groups 1 and 2 can be
removed by the addition of anhydrous sodium sulfate and separating the
liquid sample from the drying agent by decanting without statistically
affecting the results of the test.6
7.5.3 Groups 3 and 4—In cases in which a water-free
sample is not practical, the suspended water can be removed by
shaking the sample with anhydrous sodium sulfate or other
suitable drying agent and separating it from the drying agent by
decanting. Note in the report that the sample has been dried by
the addition of a desiccant.
7.3 Sample Storage:
7.3.1 If testing is not to start immediately after collection,
store the samples as indicated in 7.3.2, 7.3.3, and Table 2. All
samples shall be stored away from direct sunlight or sources of
direct heat.
7.3.2 Group 1—Store the sample at a temperature below
10 °C.
8. Preparation of Apparatus
8.1 Refer to Table 3 and prepare the apparatus by choosing
the appropriate distillation flask, temperature measuring
device, and flask support board, as directed for the indicated
group. Bring the temperature of the receiving cylinder, the
flask, and the condenser bath to the indicated temperature.
NOTE 7—If there are no, or inadequate, facilities for storage below
10°C, the sample may also be stored at a temperature below 20 °C,
provided the operator ensures that the sample container is tightly closed
and leak-free.
8.2 Make any necessary provisions so that the temperature
of the condenser bath and the receiving cylinder will be
maintained at the required temperatures. The receiving cylinder shall be in a bath such that either the liquid level is at least
as high as the 100 mL mark or the entire receiving cylinder is
surrounded by an air circulation chamber.
7.3.3 Group 2—Store the sample at a temperature below
10 °C.
NOTE 8—If there are no, or inadequate, facilities for storage below
10°C, the sample may also be stored at a temperature below 20 °C,
provided the operator ensures that the sample container is tightly closed
and leak-free.
7.3.4 Groups 3 and 4—Store the sample at ambient or lower
temperature.
6
Supporting data have been filed at ASTM International Headquarters and may
be obtained by requesting Research Report RR:D02-1455.
6
D86 − 17
TABLE 2 Sampling, Storage, and Sample Conditioning
Temperature of sample bottle
Temperature of stored sample
Temperature of sample after
conditioning prior to analysis
Group 1
Group 2
°C
°F
°C
°F
°C
<10
<50
<10A
<50A
<10B
<10
<50
<10B
°F
<50
<50
If sample is wet
If resample is still wetD
Group 3
Group 4
ambient
ambient
ambient
ambient
Ambient or
Ambient or
9 °C to 21 °C above pour pointC
Ambient or
Ambient or
48 °F to 70 °F above pour pointC
dry in accordance with 7.5.3
resample
resample
dry in accordance with 7.5.2
A
Under certain circumstances, samples can also be stored at temperatures below 20 °C (68 °F). See also 7.3.2 and 7.3.3.
If sample is to be immediately tested and is already at the temperature prescribed in Table 3, see 7.4.1.1.
If sample is (semi)-solid at ambient temperature, see also 10.3.1.1.
D
If sample is known to be wet, resampling may be omitted. Dry sample in accordance with 7.5.2 and 7.5.3.
B
C
TABLE 3 Preparation of Apparatus and Specimen
Flask, mL
ASTM distillation thermometer
IP distillation thermometer range
Flask support board
diameter of hole, mm
Temperature at start of test
Flask
°C
°F
Flask support and shield
Receiving cylinder and sample
°C
°F
A
Group 1
Group 2
Group 3
Group 4
125
7C (7F)
low
B
38
125
7C (7F)
low
B
38
125
7C (7F)
low
C
50
125
8C (8F)
high
C
50
13–18
55–65
not above
ambient
13–18
55–65
not above
ambient
13–18
55–65
not above
ambient
not above
ambient
13–18
55–65
13–18
55–65
13–18A
55–65A
13–ambientA
55–ambientA
See 10.3.1.1 for exceptions.
8.2.1 Groups 1, 2, and 3—Suitable media for low temperature baths include, but are not limited to, chopped ice and
water, refrigerated brine, and refrigerated ethylene glycol.
8.2.2 Group 4—Suitable media for ambient and higher bath
temperatures include, but are not limited to, cold water, hot
water, and heated ethylene glycol.
dance with Group 1 of this test method and comparing the
50 % recovered temperature with that shown in Table 4.7
9.1.2.1 If the temperature reading is not within the values
shown in Table 4 for the respective apparatus being used (see
Note 11 and Table 4), the temperature measurement system
shall be considered defective and shall not be used for the test.
8.3 Remove any residual liquid in the condenser tube by
swabbing with a piece of soft, lint-free cloth attached to a cord
or wire.
NOTE 10—Toluene is used as a verification fluid for calibration; it will
yield almost no information on how well an electronic measurement
system simulates the temperature lag of a liquid-in-glass thermometer.
9.1.2.2 Reagent grade toluene and hexadecane (cetane),
conforming to the specifications of the Committee on Analytical Reagents of the American Chemical Society,8 shall be used.
However, other grades may also be used, provided it is first
ascertained that the reagent is of sufficient purity to permit its
use without lessening the accuracy of the determination.
9. Calibration and Standardization
9.1 Temperature Measurement System—Temperature measurement systems using other than the specified mercury-inglass thermometers shall exhibit the same temperature lag,
emergent stem effect, and accuracy as the equivalent mercuryin-glass thermometer. Confirmation of the calibration of these
temperature measuring systems shall be made at intervals of
not more than six months, and after the system has been
replaced or repaired.
9.1.1 The accuracy and the calibration of the electronic
circuitry or computer algorithms, or both, shall be verified by
the use of a standard precision resistance bench. When performing this verification, no algorithms shall be used to correct
the temperature for lag and the emergent stem effect (see
manufacturer’s instructions).
9.1.2 Verification of the calibration of temperature measuring devices shall be conducted by distilling toluene in accor-
NOTE 11—At 101.3 kPa, toluene is shown in reference manuals as
boiling at 110.6 °C when measured using a partial immersion thermometer. Because this test method uses thermometers calibrated for total
immersion, the results typically will be lower and, depending on the
7
Supporting data have been filed at ASTM International Headquarters and may
be obtained by requesting Research Report RR:D02-1580.
8
Reagent Chemicals, American Chemical Society Specifications, American
Chemical Society, Washington, DC. For Suggestions on the testing of reagents not
listed by the American Chemical Society, see Annual Standards for Laboratory
Chemicals, BDH Ltd., Poole, Dorset, U.K., and the United States Pharmacopeia
and National Formulary, U.S. Pharmacopeial Convention, Inc. (USPC), Rockville,
MD.
7
D86 − 17
TABLE 4 True and Min and Max D86 50 % Recovered Boiling Points (°C)A
Manual
Distillation conditions min D86
50 % boiling
point
Toluene
ASTM/IP true boiling point
110.6
Group 1, 2, and
3
105.9
Distillation
conditions
max D86
50 % boiling
point
Group 1, 2,
and 3
111.8
ASTM/IP true boiling point
287.0
Group 4
Hexadecane
272.2
Automated
Distillation condiDistillation contions min D86
ditions max
50 % boiling
D86 50 % boilpoint
ing point
Group 1, 2, and
3
108.5
Group 1, 2,
and 3
109.7
Group 4
Group 4
Group 4
283.1
277.0
280.0
A
The manual and automated temperatures show in this table are the values for the 95 % tolerance interval for the 99 % population coverage. The proposed tolerance
is approximately 3× sigma. Information on the values in this table can be found in RR:D02-1580.
sample container and bring the temperature of the sample to the
temperature indicated in Table 3.
thermometer and the situation, may be different for each thermometer. At
101.3 kPa, hexadecane is shown in reference manuals as boiling at
287.0 °C when measured using a partial immersion thermometer. Because
this test method uses thermometers calibrated for total immersion, the
results typically will be lower, and, depending on the thermometer and the
situation, may be different for each thermometer.
10.3 Groups 1, 2, 3, and 4—Check that the temperature of
the sample is as shown in Table 3. Pour the specimen precisely
to the 100 mL mark of the receiving cylinder, and transfer the
contents of the receiving cylinder as completely as practical
into the distillation flask, ensuring that none of the liquid flows
into the vapor tube.
9.1.3 A procedure to determine the magnitude of the temperature lag is described in Annex A3.
9.1.4 A procedure to emulate the emergent stem effect is
described in Appendix X4.
9.1.5 To verify the calibration of the temperature measurement system at elevated temperatures, use hexadecane. The
temperature measurement system shall indicate, at 50%
recovered, a temperature comparable to that shown in Table 4
for the respective apparatus under Group 4 distillation conditions.
NOTE 14—It is important that the difference between the temperature of
the specimen and the temperature of the bath around the receiving cylinder
is as small as practically possible. A difference of 5 °C can make a
difference of 0.7 mL.
10.3.1 Groups 3 and 4—If the sample is not fluid at ambient
temperature, it is to be heated to a temperature between 9 °C
and 21 °C above its pour point (Test Methods D97, D5949,
D5950, or D5985) prior to analysis. If the sample has partially
or completely solidified in the intervening period, it shall be
vigorously shaken after melting, and prior to sampling, to
ensure homogeneity.
10.3.1.1 If the sample is not fluid at ambient temperatures,
disregard the temperature range shown in Table 3 for the
receiving cylinder and sample. Prior to analysis, heat the
receiving cylinder to approximately the same temperature as
the sample. Pour the heated specimen precisely to the 100 mL
mark of the receiving cylinder, and transfer the contents of the
receiving cylinder as completely as practical into the distillation flask, ensuring that none of the liquid flows into the vapor
tube.
NOTE 12—Because of the high melting point of hexadecane, Group 4
verification distillations will have to be carried out with condenser
temperatures >20 °C.
9.2 Automated Method:
9.2.1 Level Follower—For an automated distillation
apparatus, the level follower/recording mechanism of the
apparatus shall have a resolution of 0.1 % volume or better
with a maximum error of 0.3 % volume between the 5 % and
100 % volume points. The calibration of the assembly shall be
verified in accordance with manufacturer’s instructions at
intervals of not more than three months and after the system
has been replaced or repaired.
NOTE 13—The typical calibration procedure involves verifying the
output with the receiver containing 5 % and 100 % volume of material
respectively.
NOTE 15—Any material that evaporates during the transfer will
contribute to the loss; any material that remains in the receiving cylinder
will contribute to the observed recovery volume at the time of the IBP.
9.2.2 Barometric Pressure—At intervals of not more than
six months, and after the system has been replaced or repaired,
the barometric reading of the instrument shall be verified
against a barometer, as described in 6.6.
10.4 If the sample can be expected to demonstrate irregular
boiling behavior, that is, bumping, add a few boiling chips to
the specimen. The addition of a few boiling chips is acceptable
for any distillation.
10. Procedure
10.5 Fit the temperature sensor through a snug-fitting
device, as described in 6.4, to mechanically center the sensor in
the neck of the flask. In the case of a thermometer, the bulb is
centered in the neck and the lower end of the capillary is level
with the highest point on the bottom of the inner wall of the
vapor tube (see Fig. 5). In the case of a thermocouple or
10.1 Record the prevailing barometric pressure.
10.2 Groups 1 and 2—Ensure that the sample is conditioned
in accordance with Table 2. Fit a low range thermometer
provided with a snug-fitting cork or stopper of silicone rubber,
or equivalent polymeric material, tightly into the neck of the
8
D86 − 17
FIG. 6 Example of One Manufacturer’s Recommended Placement
of Pt-100 Probe Relative to Distillation Flask Sidearm for Automated D86 Distillation Instrument
10.8.2 Automated Method—To reduce evaporation loss of
the distillate, use the device provided by the instrument
manufacturer for this purpose. Apply heat to the distillation
flask and contents with the tip of the receiver deflector just
touching the wall of the receiving cylinder. Note the start time.
Record the IBP to the nearest 0.1 °C (0.2 °F).
resistance thermometer, follow the manufacturer’s instructions
as to placement (see Fig. 6).
NOTE 16—If vacuum grease is used on the mating surface of the
centering device, use the minimum amount of grease that is practical.
10.6 Fit the flask vapor tube, provided with a snug-fitting
cork or rubber stopper of silicone, or equivalent polymeric
material, tightly into the condenser tube. Adjust the flask in a
vertical position so that the vapor tube extends into the
condenser tube for a distance from 25 mm to 50 mm. Raise and
adjust the flask support board to fit it snugly against the bottom
of the flask.
10.9 Regulate the heating so that the time interval between
the first application of heat and the IBP is as specified in Table
5.
10.10 Regulate the heating so that the time from IBP to 5 %
recovered is as indicated in Table 5.
10.7 Place the receiving cylinder that was used to measure
the specimen, without drying the inside of the cylinder, into its
temperature-controlled bath under the lower end of the condenser tube. The end of the condenser tube shall be centered in
the receiving cylinder and shall extend therein for a distance of
at least 25 mm, but not below the 100 mL mark.
10.11 Continue to regulate the heating so that the uniform
average rate of condensation from 5 % recovered to 5 mL
residue in the flask is 4 mL to 5 mL per minute. (Warning—
Due to the configuration of the boiling flask and the conditions
of the test, the vapor and liquid around the temperature sensor
are not in thermodynamic equilibrium. The distillation rate will
consequently have an effect on the measured vapor temperature. The distillation rate shall, therefore, be kept as constant as
possible throughout the test.)
10.11.1 In the context of this test method, “uniform average
rate of condensation” has the following intention. Heating of
the boiling flask shall be regulated to maintain as best as
possible a uniform flow of condensation, which will then
provide the most desired precision for the test. However, some
distillation tests can have one or more short-term rates of
condensation which deviate from the 4 mL ⁄min to 5 mL ⁄min
indicated in 10.11 and Table 5, this is a common occurrence for
some sample types. The periods of these short-term deviations
10.8 Initial Boiling Point:
10.8.1 Manual Method—To reduce evaporation loss of the
distillate, cover the receiving cylinder with a piece of blotting
paper, or similar material, that has been cut to fit the condenser
tube snugly. If a receiver deflector is being used, start the
distillation with the tip of the deflector just touching the wall of
the receiving cylinder. If a receiver deflector is not used, keep
the drip tip of the condenser away from the wall of the
receiving cylinder. Note the start time. Observe and record the
IBP to the nearest 0.5 °C (1.0 °F). If a receiver deflector is not
being used, immediately move the receiving cylinder so that
the tip of the condenser touches its inner wall.
9
D86 − 17
TABLE 5 Conditions During Test Procedure
Temperature of cooling bathA
Temperature of bath around
receiving cylinder
°C
°F
°C
°F
Time from first application of heat to
initial boiling point, min
Time from initial boiling point
to 5 % recovered, s
Uniform average rate of condensation
from 5 % recovered to 5 mL
in flask, mL/min
Time recorded from 5 mL residue to
end point, min
Group 1
Group 2
Group 3
Group 4
0–1
32–34
13–18
55–65
0–5
32–40
13–18
55–65
0–5
32–40
13–18
55–65
0–60
32–140
±3
±5
of charge
temperature
5–10
5–10
5–10
5–15
60–100
60–100
4–5
4–5
4–5
4–5
5 max
5 max
5 max
5 max
A
The proper condenser bath temperature will depend upon the wax content of the sample and of its distillation fractions. The test is generally performed using one single
condenser temperature. Wax formation in the condenser can be deduced from (a) the presence of wax particles in the distillate coming off the drip tip, (b) a higher distillation
loss than what would be expected based on the initial boiling point of the specimen, (c) an erratic recovery rate and (d) the presence of wax particles during the removal
of residual liquid by swabbing with a lint-free cloth (see 8.3). The minimum temperature that permits satisfactory operation shall be used. In general, a bath temperature
in the 0 °C to 4 °C range is suitable for kerosine, Grade No. 1 fuel oil and Grade No. 1-D diesel fuel oil. In some cases involving Grade No. 2 fuel oil, Grade No. 2-D diesel
fuel oil, gas oils and similar distillates, it may be necessary to hold the condenser bath temperature in the 38 °C to 60 °C range.
ture readings at prescribed percentages recovered or percentages recovered at prescribed temperature readings, or both.
10.14.1 Manual Method—Record all volumes in the graduated cylinder to the nearest 0.5 mL, and all temperature
readings to the nearest 0.5 °C (1.0 °F).
10.14.2 Automated Method—Record all volumes in the
receiving cylinder to the nearest 0.1 mL, and all temperature
readings to the nearest 0.1 °C (0.2 °F).
10.14.3 Group 1, 2, 3, and 4—In cases in which no specific
data requirements have been indicated, record the IBP and the
EP (FBP) or the dry point, or both, and temperature readings at
5 %, 15 %, 85 %, and 95 % recovered, and at each 10 %
multiple of volume recovered from 10 to 90, inclusive.
10.14.3.1 Group 4—When a high range thermometer is used
in testing aviation turbine fuels and similar products, pertinent
thermometer readings can be obscured by the centering device.
If these readings are required, perform a second distillation in
accordance with Group 3. In such cases, reading from a low
range thermometer can be reported in place of the obscured
high range thermometer readings, and the test report shall so
indicate. If, by agreement, the obscured readings are waived,
the test report shall so indicate.
10.14.4 When it is required to report the temperature
reading at a prescribed percent evaporated or recovered for a
sample that has a rapidly changing slope of the distillation
curve in the region of the prescribed percent evaporated or
recovered reading, record temperature readings at every 1 %
recovered. The slope is considered rapidly changing if the
change in slope ( C) of the data points described in 10.14.2 in
that particular area is greater than 0.6 (change of slope (F ) is
greater than 1.0) as calculated by Eq 1 (Eq 2).
may last for several percent of material condensed until the
temperature slope becomes constant again, and may occur at
several periods along the entire condensation range. These
deviations will typically correct after the temperature slope
again becomes constant. These short-term deviations shall not
occur over the entire range of condensation. Typically, these
short-term deviations should not occur for more than ten
contiguous percent volume. The precision of the temperature
readings will be significantly affected during these periods.
When the overall calculated average rate of condensation
between 5 % recovered and 5 mL residue is within the prescribed rate, the requirement of 10.11 and Table 5 is satisfied.
As example, those samples containing a 10 % ethanol-fuel
blend or those that exhibit a significant change of temperature
slope at points during the distillation can have a short-term rate
of condensation which deviates from the 4 mL ⁄min to
5 mL ⁄min indicated in 10.11 and Table 5.
NOTE 17—When testing gasoline samples, it is not uncommon to see
the condensate suddenly form non-miscible liquid phases and bead up on
the temperature measuring device and in the neck of the boiling flask at a
vapor temperature of around 160 °C. This may be accompanied by a sharp
(about 3 °C) dip in the vapor temperature and a drop in the recovery rate.
The phenomenon, which may be due to the presence of trace water in the
sample, may last for 10 s to 30 s before the temperature recovers and the
condensate starts flowing smoothly again. This point is sometimes
colloquially referred to as the Hesitation Point.
10.12 Repeat any distillation that did not meet the requirements described in 10.9, 10.10, and 10.11.
10.13 If a decomposition point is observed, discontinue the
heating and proceed as directed in 10.17.
NOTE 18—Characteristic indications of thermal decomposition are
evolution of fumes and erratic, typically decreasing, temperature readings
that occur during the final stages of the distillation.
10.14 In the interval between the IBP and the end of the
distillation, observe and record data necessary for the calculation and reporting of the results of the test as required by the
specification involved, or as previously established for the
sample under test. These observed data can include tempera-
Change of Slope ~ C ! 5
(1)
~ C 2 2 C 1! / ~ V 2 2 V 1! 2 ~ C 3 2 C 2! / ~ V 3 2 V 2!
Change of Slope ~ F ! 5
(2)
~ F 2 2 F 1! / ~ V 2 2 V 1! 2 ~ F 3 2 F 2! / ~ V 3 2 V 2!
10
D86 − 17
where:
C1 = temperature at the volume % recorded one reading
prior to the volume % in question, °C,
C2 = temperature at the volume % recorded in question, °C,
C3
final heat adjustment. If this is the case, it would be advisable to repeat the
test lowering final heat setting.
Groups 3 and 4, many Group 3 and 4 samples will have the same
distillation characteristics in regards to dry point and endpoint as Groups
1 and 2. With samples that contain higher temperature boiling materials it
may not be possible to detect a dry point or an end point before the
decomposition point occurs.
= temperature at the volume % recorded following the
volume % in question, °C,
= temperature at the volume % recorded one reading
prior to the volume % in question, °F,
= temperature at the volume % recorded in question, °F,
= volume % recorded following the volume % in question.
10.17 Allow the distillate to drain into the receiving
cylinder, after heating has been discontinued.
10.17.1 Manual Method—While the condenser tube continues to drain into the graduated cylinder, observe and note the
volume of condensate to the nearest 0.5 mL at 2 min intervals
until two successive observations agree. Measure the volume
in the receiving cylinder accurately, and record it to the nearest
0.5 mL.
10.17.2 Automated Method—The apparatus shall continually monitor the recovered volume until this volume changes
by no more than 0.1 mL in 2 min. Record the volume in the
receiving cylinder accurately to the nearest 0.1 mL.
10.15 When the residual liquid in the flask is approximately
5 mL, make a final adjustment of the heat. The time from the
5 mL of liquid residue in the flask to the EP (FBP) shall be
within the limits prescribed in Table 5. If this condition is not
satisfied, repeat the test with appropriate modification of the
final heat adjustment.
10.18 Record the volume in the receiving cylinder as
percent recovery. If the distillation was previously discontinued under the conditions of a decomposition point, deduct the
percent recovered from 100, report this difference as the sum of
percent residue and percent loss, and omit the procedure given
in 10.19.
NOTE 19—Since it is difficult to determine when there is 5 mL of
boiling liquid left in the flask, this time is determined by observing the
amount of liquid recovered in the receiving cylinder. The dynamic holdup
has been determined to be approximately 1.5 mL at this point. If there are
no front end losses, the amount of 5 mL in the flask can be assumed to
correspond with an amount of 93.5 mL in the receiving cylinder. This
amount has to be adjusted for the estimated amount of front end loss.
10.19 After the flask has cooled and no more vapor is
observed, disconnect the flask from the condenser, pour its
contents into a 5 mL graduated cylinder, and with the flask
suspended over the cylinder, allow the flask to drain until no
appreciable increase in the volume of liquid in the cylinder is
observed. Measure the volume in the graduated cylinder to the
nearest 0.1 mL, and record as percent residue.
10.19.1 If the 5 mL graduated cylinder does not have
graduations below 1 mL and the volume of liquid is less than
1 mL, prefill the cylinder with 1 mL of a heavy oil to allow a
better estimate of the volume of the material recovered.
10.19.1.1 If a residue greater than expected is obtained, and
the distillation was not purposely terminated before the EP,
check whether adequate heat was applied towards the end of
the distillation and whether conditions during the test conformed to those specified in Table 5. If not, repeat test.
F1
F2
F3
V1
V2
V3
= temperature at the volume % recorded following the
volume % in question, °F,
= volume % recorded one reading prior to the volume %
in question,
= volume % recorded at the volume % in question, and
10.15.1 If the actual front end loss differs more than 2 mL
from the estimated value, the test shall be rerun.
10.16 Observe and record the EP (FBP) or the dry point, or
both, as required, and discontinue the heating.
NOTE 20—The end point (final boiling point), rather than the dry point,
is intended for general use. The dry point can be reported in connection
with special purpose naphthas, such as those used in the paint industry.
Also, it is substituted for the end point (final boiling point) whenever the
sample is of such a nature that the precision of the end point (final boiling
point) cannot consistently meet the requirements given in the precision
section.
NOTE 21—Groups 1 and 2, once the final heat adjustment is made, the
vapor temperature/thermometer reading will continue to increase. As the
distillation nears the end point (final boiling point) the distillation typically
achieves dry point first. After the dry point has been achieved the vapor
temperature/thermometer reading should continue to increase. The bottom
of the flask will be dry but the sides and neck of the flask and the
temperature sensor will still have vapor condensate present. The vapor
condensate may have the appearance of a white cloud of fumes. This
vapor condensate/cloud of fumes should totally engulf the temperaturemeasuring sensor before the vapor temperature starts to decrease. If these
observations do not occur, the end point may not have been reached. It
would be advisable to repeat the test adding additional heat to the final
heat adjustment. Typically the vapor temperature will continue to rise as
the dry point is reached and the vapor cloud engulfs the temperaturemeasuring sensor. When the end point is near, the rate of temperature
increase will slow and level off. Once the endpoint is reached the vapor
temperature will start and continue to decrease. If the vapor temperature
starts to decrease but then increases and repeats this cycle while the vapor
temperature continues to increase you have added too much heat to the
NOTE 22—The distillation residues of this test method for gasoline,
kerosine, and distillate diesel are typically 0.9 % to 1.2 %, 0.9 % to 1.3 %,
and 1.0 % to 1.4 % volume, respectively.
NOTE 23—The test method is not designed for the analysis of distillate
fuels containing appreciable quantities of residual material (see 1.2).
10.19.2 Groups 1, 2, 3, and 4—Record the volume in the
5 mL graduated cylinder, to the nearest 0.1 mL, as percent
residue.
10.20 If the intent of the distillation is to determine the
percent evaporated or percent recovered at a predetermined
corrected temperature reading, modify the procedure to conform to the instructions described in Annex A4.
10.21 Examine the condenser tube and the side arm of the
flask for waxy or solid deposits. If found, repeat the test after
making adjustments described in Footnote A of Table 5.
11
D86 − 17
TABLE 6 Approximate Thermometer Reading Correction
Temperature Range
After applying the corrections and rounding each result to
the nearest 0.5 °C (1.0 °F) or 0.1 °C (0.2 °F), as appropriate to
the apparatus being used, use the corrected temperature readings in all further calculations and reporting.
CorrectionA per 1.3 kPa (10 mm Hg)
Difference in Pressure
°C
°F
°C
°F
10–30
30–50
50–70
70–90
90–110
110–130
130–150
150–170
170–190
190–210
210–230
230–250
250–270
270–290
290–310
310–330
330–350
350–370
370–390
390–410
50–86
86–122
122–158
158–194
194–230
230–266
266–302
302–338
338–374
374–410
410–446
446–482
482–518
518–554
554–590
590–626
626–662
662–698
698–734
734–770
0.35
0.38
0.40
0.42
0.45
0.47
0.50
0.52
0.54
0.57
0.59
0.62
0.64
0.66
0.69
0.71
0.74
0.76
0.78
0.81
0.63
0.68
0.72
0.76
0.81
0.85
0.89
0.94
0.98
1.02
1.07
1.11
1.15
1.20
1.24
1.28
1.33
1.37
1.41
1.46
NOTE 25—Temperature readings are not corrected to 101.3 kPa
(760 mm Hg) when product definitions, specifications, or agreements
between the parties involved indicate, specifically, that such correction is
not required or that correction shall be made to some other base pressure.
11.4 Correct the actual loss to 101.3 kPa (760 mm Hg)
pressure when temperature readings are corrected to 101.3 kPa
pressure. The corrected loss, Lc, is calculated from Eq 6 or Eq
7, as appropriate, or can be read from the tables presented as
Fig. X3.1 or Fig. X3.2.
11.1 The percent total recovery is the sum of the percent
recovery (see 10.18) and the percent residue (see 10.19).
Deduct the percent total recovery from 100 to obtain the
percent loss.
11.4.1 Calculate the corresponding corrected percent recovery in accordance with the following equation:
11.2 Do not correct the barometric pressure for meniscus
depression, and do not adjust the pressure to what it would be
at sea level.
R c 5 R1 ~ L 2 L c !
where:
L =
Lc =
R =
Rc =
NOTE 24—The observed barometric reading does not have to be
corrected to a standard temperature and to standard gravity. Even without
performing these corrections, the corrected temperature readings for the
same sample between laboratories at two different locations in the world
will, in general, differ less than 0.1 °C at 100 °C. Almost all data obtained
earlier have been reported at barometric pressures that have not been
corrected to standard temperature and to standard gravity.
(4)
percent loss or observed loss,
corrected loss,
percent recovery, and
corrected percent recovery.
P e 5 P r 1L
(9)
where:
L
= observed loss,
Pe = percent evaporated, and
Pr = percent recovered.
For Fahrenheit temperatures:
C f 5 0.00012 ~ 760 2 P ! ~ 4601t f !
(8)
11.5 To obtain the percent evaporated at a prescribed
temperature reading, add the percent loss to each of the
observed percent recovered at the prescribed temperature
readings, and report these results as the respective percent
evaporated, that is:
11.3 Correct temperature readings to 101.3 kPa (760 mm
Hg) pressure. Obtain the correction to be applied to each
temperature reading by means of the Sydney Young equation
as given in Eq 3, Eq 4, or Eq 5, as appropriate, or by the use
of Table 6. For Celsius temperatures:
(3)
(7)
NOTE 26—Eq 6 and 7 above have been derived from the data in Table
A4.3 and Eqs 5 and 6 in Test Method D86 – 95 and earlier versions. It is
probable that Eq 6 and 7 shown were the original empirical equations from
which the table and equations in the Test Method D86 – 95 and earlier
versions were derived.
11. Calculations
C c 5 0.00012 ~ 760 2 P ! ~ 2731t c !
(6)
L c 5 0.51 ~ L 2 0.5! / $ 11 ~ 760 2 P ! /60.0%
where:
L = observed loss,
Lc = corrected loss,
Pk = pressure, kPa, and
P = pressure, mm Hg.
A
Values to be added when barometric pressure is below 101.3 kPa (760 mm Hg)
and to be subtracted when barometric pressure is above 101.3 kPa.
C c 5 0.0009 ~ 101.3 2 P k ! ~ 2731t c !
L c 5 0.51 ~ L 2 0.5! / $ 11 ~ 101.3 2 P k ! /8.00%
11.6 To obtain temperature readings at prescribed percent
evaporated, and if no recorded temperature data is available
within 0.1 volume % of the prescribed percent evaporated, use
either of the two following procedures, and indicate on the
report whether the arithmetical procedure or the graphical
procedure has been used.
11.6.1 Arithmetical Procedure—Deduct the observed loss
from each prescribed percent evaporated to obtain the corresponding percent recovered. Calculate each required temperature reading as follows:
(5)
where:
= the observed temperature reading in °C,
tc
= the observed temperature reading in °F,
tf
Cc and Cf = corrections to be added algebraically to the
observed temperature readings,
= barometric pressure, prevailing at the time and
Pk
location of the test, kPa, and
P
= barometric pressure, prevailing at the time and
location of the test, mm Hg.
T 5 T L 1 ~ T H 2 T L ! ~ P r 2 P rL! / ~ P rH 2 P rL!
12
(10)
D86 − 17
residue and percent loss as observed in accordance with 10.19
and 11.1, respectively.
where:
= percent recovered corresponding to the prescribed
Pr
percent evaporated,
PrH = percent recovered adjacent to, and higher than Pr,
PrL = percent recovered adjacent to, and lower than Pr,
T
= temperature reading at the prescribed percent
evaporated,
TH = temperature reading recorded at PrH, and
= temperature reading recorded at PrL.
TL
12.6 Do not use the corrected loss in the calculation of
percent evaporated.
12.7 It is advisable to base the report on relationships
between temperature readings and percent evaporated when the
sample is a gasoline, or any other product classified under
Group 1, or in which the percent loss is greater than 2.0.
Otherwise, the report can be based on relationships between
temperature readings and percent evaporated or percent recovered. Every report must indicate clearly which basis has been
used.
12.7.1 In the manual method, if results are given in percent
evaporated versus temperature readings, report if the arithmetical or the graphical procedure was used (see 11.6).
Values obtained by the arithmetical procedure are affected by
the extent to which the distillation graphs are nonlinear.
Intervals between successive data points can, at any stage of
the test, be no wider than the intervals indicated in 10.18. In no
case shall a calculation be made that involves extrapolation.
11.6.2 Graphical Procedure—Using graph paper with uniform subdivisions, plot each temperature reading corrected for
barometric pressure, if required (see 11.3), against its corresponding percent recovered. Plot the IBP at 0 % recovered.
Draw a smooth curve connecting the points. For each prescribed percent evaporated, deduct the distillation loss to
obtain the corresponding percent recovered and take from the
graph the temperature reading that this percent recovered
indicates. Values obtained by graphical interpolation procedures are affected by the care with which the plot is made.
12.8 Report if a drying agent, as described in 7.5.2 or 7.5.3,
was used.
12.9 Fig. X1.1 is an example of a tabular report. It shows the
percent recovered versus the corresponding temperature reading and versus the corrected temperature reading. It also shows
the percent loss, the corrected loss, and the percent evaporated
versus the corrected temperature reading.
13. Precision and Bias
NOTE 27—See Appendix X1 for numerical examples illustrating the
arithmetical procedure.
13.1 Precision (Group 1, 2, 3 automated)—The precision of
this test method, as determined by the statistical examination of
the interlaboratory test results,9 is as follows:
11.6.3 In most automated instruments, temperature-volume
data are collected at 0.1 volume % intervals or less and stored
in memory. To report a temperature reading at a prescribed
percent evaporated, neither of the procedures described in
11.6.1 and 11.6.2 have to be used. Obtain the desired temperature directly from the database as the temperature closest to and
within 0.1 % volume of the prescribed percent evaporated.
NOTE 28—The precision was derived from data produced by automated
D86 apparatus. Typical examples of precision for manual apparatus can be
calculated from the information contained in Annex A4 (see A4.10).
NOTE 29—Information on the precision of percent evaporated or
percent recovered at a prescribed temperature can be found in Annex A4.
NOTE 30—For naphthas, solvents, and other similar materials where
percent recovered are reported and the percent loss is typically less than
one percent, the percent recovered temperatures can be considered
identical to the percent evaporated temperatures and precision can be
calculated as shown for Group 1, 2, 3.
12. Report
12.1 Report the following information (see Appendix X5
for examples of reports):
13.1.1 Repeatability—The difference between successive
test results, obtained by the same operator using the same
apparatus under constant operating conditions on identical test
material, would in the long run, in the normal and correct
operation of this test method, exceed the values in Table 7 only
in one case in twenty.
13.1.2 Reproducibility—The difference between two single
and independent test results, obtained by different operators
working in different laboratories on identical test material,
would in the long run, in normal and correct operation of this
test method, exceed the values in Table 7 only in one case in
twenty.
13.1.3 The precision statements were derived from a 2010
interlaboratory cooperative test program.9 Twenty six laboratories participated and analyzed twenty one sample sets comprised of; specification grade gasoline, both conventional and
12.2 Report the barometric pressure to the nearest 0.1 kPa
(1 mm Hg).
12.3 Report all volumetric readings in percentages.
12.3.1 Manual Method—Report volumetric readings to the
nearest 0.5, and all temperature readings to the nearest 0.5° C
(1.0 °F).
12.3.2 Automated Method—Report volumetric readings to
the nearest 0.1, and all temperature readings to the nearest one
tenth degree.
12.4 After barometric corrections of the temperature readings have been made, the following data require no further
calculation prior to reporting: IBP, dry point, EP (FBP),
decomposition point, and all pairs of corresponding values
involving percent recovered and temperature readings.
12.4.1 The report shall state if the temperature readings
have not been corrected for barometric pressure.
9
Supporting data have been filed at ASTM International Headquarters and may
be obtained by requesting Research Report RR:D02-1807. Contact ASTM Customer
Service at
12.5 When the temperature readings have not been corrected to 101.3 kPa (760 mm Hg) pressure, report the percent
13
D86 − 17
TABLE 7 Repeatability and Reproducibility for Group 1, 2, 3
(Automated)
(Valid Range 20 °C to 260 °C)
Percent
Evaporated
IBP
5
10
20
30
40
50
60
70
80
90
95
FBP
where:
Sc
=
Repeatability °C
1.4
0.9
0.9
0.8
0.9
1.0
1.1
1.5
1.1
1.8
2.0
+
+
+
+
+
+
+
+
+
+
+
2.7
2.8(0.43Sc
2.8(0.43Sc
2.8(0.43Sc
2.8(0.43Sc
2.8(0.43Sc
2.8(0.43Sc
2.8(0.43Sc
2.8(0.43Sc
2.8(0.43Sc
2.8(0.43Sc
2.8(0.43Sc
3.3
+
+
+
+
+
+
+
+
+
+
+
0.24)
0.24)
0.24)
0.24)
0.24)
0.24)
0.24)
0.24)
0.24)
0.24)
0.24)
TABLE 8 Repeatability and Reproducibility for Group 4
(Automated)A
Percent
Recovered
IBP
5%
10 %
20 %
30 %
40 %
50 %
60 %
70 %
80 %
90 %
95 %
FBP
Reproducibility °C
2.5
1.9
2.0
1.8
2.0
1.9
2.0
2.1
2.0
2.8
3.6
+
+
+
+
+
+
+
+
+
+
+
4.7
2.8(0.43Sc
2.8(0.43Sc
2.8(0.43Sc
2.8(0.43Sc
2.8(0.43Sc
2.8(0.43Sc
2.8(0.43Sc
2.8(0.43Sc
2.8(0.43Sc
2.8(0.43Sc
2.8(0.43Sc
7.1
+
+
+
+
+
+
+
+
+
+
+
0.24)
0.24)
0.24)
0.24)
0.24)
0.24)
0.24)
0.24)
0.24)
0.24)
0.24)
Repeatability °C
Reproducibility °C
0.018T
0.0109T
0.0094T
0.00728T
0.00582T
0.005T
1.0
0.00357T
0.00355T
0.00377T
0.0041T
0.01318(T-140)
2.2
0.055T
0.03T
0.022T
0.0208T
0.0165T
0.014T
3.0
0.0117T
0.0125T
0.0136T
0.015T
0.04105(T-140)
7.1
Valid Range °C
145
160
160
175
185
195
170
220
230
240
180
260
195
to
to
to
to
to
to
to
to
to
to
to
to
to
220
255
265
275
285
290
295
305
315
325
340
360
365
where:
T
= percent recovered temperature within valid range prescribed.
slope or rate of change of temperature in degrees Celcius calculated
using A4.10.1.
A
oxygenated, some containing up to 20 % ethanol. The temperature range covered was 20 °C to 220 °C. Information on
the type of samples and their average boiling points are in the
research report.
Refer to Annex A1 for tables of calculated repeatability and reproducibility.
13.2.3 The precision statements were derived from a 2005
interlaboratory cooperative test program.10 Sixteen laboratories participated and analyzed sample sets comprised of;
specification grade diesel, with a B5 and B20 biodiesel,
specification grade heating oil, aviation turbine fuels, marine
fuels, mineral spirits and toluene. The temperature range
covered was 145 °C to 365 °C. Information on the type of
samples and their average boiling points are in the research
report.
13.2 Precision (Group 4)—The precision of this test
method, as determined by the statistical examination of the
interlaboratory test results,10 is as follows:
NOTE 31—Information on the precision of percent evaporated or
percent recovered at a prescribed temperature can be found in Annex A4.
13.2.1 Repeatability—The difference between successive
test results, obtained by the same operator using the same
apparatus under constant operating conditions on identical test
material, would in the long run, in the normal and correct
operation of this test method, exceed the following values in
Table 8 only in one case in twenty.
13.2.2 Reproducibility—The difference between two single
and independent test results, obtained by different operators
working in different laboratories on identical test material,
would in the long run, in normal and correct operation of this
test method, exceed the following values in Table 8 only in one
case in twenty.
13.3 Bias:
13.3.1 Bias—Since there is no accepted reference material
suitable for determining the bias for the procedure in these test
methods, bias has not been determined.
13.3.2 Relative Bias between Manual and Automated
Apparatus—An interlaboratory study7 conducted in 2003 using
manual and automated apparatus has concluded that there is no
statistical evidence to suggest that there is a bias between
manual and automated results.
NOTE 32—See A2.1 for information on the application and use of
borosilicate and quartz distillation flasks.
14. Keywords
10
Supporting data (results of the 2005 Interlaboratory Cooperative Test Program) have been filed at ASTM International Headquarters and may be obtained by
requesting Research Report RR:D02-1621.
14.1 batch distillation; distillates; distillation; laboratory
distillation; petroleum products
14
D86 − 17
ANNEXES
(Mandatory Information)
A1. PRECISION TABLES FOR REPEATABILITY (r) AND REPRODUCIBILITY (R)
A1.1 Tables:
Recovered IBP
Temperature (°C)
145
150
155
160
165
170
175
180
185
190
195
200
205
210
215
220
IBP_GRP4
r_D86auto
R_D86auto
2.61
7.98
2.70
8.25
2.79
8.53
2.88
8.80
2.97
9.08
3.06
9.35
3.15
9.63
3.24
9.90
3.33
10.18
3.42
10.45
3.51
10.73
3.60
11.00
3.69
11.28
3.78
11.55
3.87
11.83
3.96
12.10
Recovered 5 %
Temperature (°C)
160
165
170
175
180
185
190
195
200
205
210
215
220
225
230
235
240
245
250
255
r_D86auto
1.74
1.80
1.85
1.91
1.96
2.02
2.07
2.13
2.18
2.23
2.29
2.34
2.40
2.45
2.51
2.56
2.62
2.67
2.73
2.78
Recovered 10 %
Temperature (°C)
160
165
170
175
180
185
190
195
200
205
210
215
220
225
230
235
240
245
T10_GRP4
r_D86auto
R_D86auto
1.50
3.52
1.55
3.63
1.60
3.74
1.65
3.85
1.69
3.96
1.74
4.07
1.79
4.18
1.83
4.29
1.88
4.40
1.93
4.51
1.97
4.62
2.02
4.73
2.07
4.84
2.12
4.95
2.16
5.06
2.21
5.17
2.26
5.28
2.30
5.39
250
255
260
265
T5_GRP4
R_D86auto
4.80
4.95
5.10
5.25
5.40
5.55
5.70
5.85
6.00
6.15
6.30
6.45
6.60
6.75
6.90
7.05
7.20
7.35
7.50
7.65
15
2.35
2.40
2.44
2.49
5.50
5.61
5.72
5.83
Recovered 20 %
Temperature (°C)
175
180
185
190
195
200
205
210
215
220
225
230
235
240
245
250
255
260
265
270
275
T20_GRP4
r_D86auto
R_D86auto
1.27
3.64
1.31
3.74
1.35
3.85
1.38
3.95
1.42
4.06
1.46
4.16
1.49
4.26
1.53
4.37
1.57
4.47
1.60
4.58
1.64
4.68
1.67
4.78
1.71
4.89
1.75
4.99
1.78
5.10
1.82
5.20
1.86
5.30
1.89
5.41
1.93
5.51
1.97
5.62
2.00
5.72
Recovered 30 %
Temperature (°C)
185
190
195
200
205
210
215
220
225
230
235
240
245
250
255
260
265
270
275
280
285
T30_GRP4
r_D86auto
R_D86auto
1.08
3.05
1.11
3.14
1.13
3.22
1.16
3.30
1.19
3.38
1.22
3.47
1.25
3.55
1.28
3.63
1.31
3.71
1.34
3.80
1.37
3.88
1.40
3.96
1.43
4.04
1.46
4.13
1.48
4.21
1.51
4.29
1.54
4.37
1.57
4.46
1.60
4.54
1.63
4.62
1.66
4.70
Recovered 40 %
Temperature (°C)
195
200
205
210
215
220
225
230
235
240
245
250
T40_GRP4
r_D86auto
R_D86auto
0.98
2.73
1.00
2.80
1.03
2.87
1.05
2.94
1.08
3.01
1.10
3.08
1.13
3.15
1.15
3.22
1.18
3.29
1.20
3.36
1.23
3.43
1.25
3.50
D86 − 17
255
260
265
270
275
280
285
290
1.28
1.30
1.33
1.35
1.38
1.40
1.43
1.45
3.57
3.64
3.71
3.78
3.85
3.92
3.99
4.06
Recovered 50 %
Temperature (°C)
170–295
T50_GRP4
r_D86auto
R_D86auto
1.0
3.0
Recovered 60 %
Temperature (°C)
220
225
230
235
240
245
250
255
260
265
270
275
280
285
290
295
300
305
T60_GRP4
r_D86auto
R_D86auto
0.79
2.57
0.80
2.63
0.82
2.69
0.84
2.75
0.86
2.81
0.87
2.87
0.89
2.93
0.91
2.98
0.93
3.04
0.95
3.10
0.96
3.16
0.98
3.22
1.00
3.28
1.02
3.33
1.04
3.39
1.05
3.45
1.07
3.51
1.09
3.57
Recovered 70 %
Temperature (°C)
230
235
240
245
250
255
260
265
270
275
280
285
290
295
300
305
310
315
T70_GRP4
r_D86auto
R_D86auto
0.82
2.88
0.83
2.94
0.85
3.00
0.87
3.06
0.89
3.13
0.91
3.19
0.92
3.25
0.94
3.31
0.96
3.38
0.98
3.44
0.99
3.50
1.01
3.56
1.03
3.63
1.05
3.69
1.07
3.75
1.08
3.81
1.10
3.88
1.12
3.94
Recovered 80 %
Temperature (°C)
240
245
250
255
260
265
270
275
280
285
290
295
300
305
T80_GRP4
r_D86auto
R_D86auto
0.90
3.26
0.92
3.33
0.94
3.40
0.96
3.47
0.98
3.54
1.00
3.60
1.02
3.67
1.04
3.74
1.06
3.81
1.07
3.88
1.09
3.94
1.11
4.01
1.13
4.08
1.15
4.15
310
315
320
325
16
1.17
1.19
1.21
1.23
4.22
4.28
4.35
4.42
Recovered 90 %
Temperature (°C)
180
185
190
195
200
205
210
215
220
225
230
235
240
245
250
255
260
265
270
275
280
285
290
295
300
305
310
315
320
325
330
335
340
T90_GRP4
r_D86auto
R_D86auto
0.74
2.70
0.76
2.78
0.78
2.85
0.80
2.93
0.82
3.00
0.84
3.08
0.86
3.15
0.88
3.23
0.90
3.30
0.92
3.38
0.94
3.45
0.96
3.53
0.98
3.60
1.00
3.68
1.03
3.75
1.05
3.83
1.07
3.90
1.09
3.98
1.11
4.05
1.13
4.13
1.15
4.20
1.17
4.28
1.19
4.35
1.21
4.43
1.23
4.50
1.25
4.58
1.27
4.65
1.29
4.73
1.31
4.80
1.33
4.88
1.35
4.95
1.37
5.03
1.39
5.10
Recovered 95 %
Temperature (°C)
260
265
270
275
280
285
290
295
300
305
310
315
320
325
330
335
340
345
350
355
360
T95_GRP4
r_D86auto
R_D86auto
1.58
4.93
1.65
5.13
1.71
5.34
1.78
5.54
1.85
5.75
1.91
5.95
1.98
6.16
2.04
6.36
2.11
6.57
2.17
6.77
2.24
6.98
2.31
7.18
2.37
7.39
2.44
7.59
2.50
7.80
2.57
8.00
2.64
8.21
2.70
8.42
2.77
8.62
2.83
8.83
2.90
9.03
Recovered FBP
Temperature (°C)
195–365
FBP_GRP4
r_D86auto
R_D86auto
2.2
7.1
D86 − 17
FIG. A2.1 125 mL Flask and 125 mL Flask with Ground Glass Joint
A2. DETAILED DESCRIPTION OF APPARATUS
Borosilicate = Quartz + 0.40
A2.1 Distillation Flasks—Flasks shall be of heat resistant
glass, constructed to the dimensions and tolerances shown in
Fig. A2.1 and Fig. A2.2. Flasks made of borosilicate glass shall
comply with the requirements of Specification E1405. Flasks
made of quartz shall be composed of 99.9+ % SiO2. Flasks
may also be constructed with a ground glass joint.
A2.2 Condenser and Condenser Bath—Typical types of
condenser and condenser baths are illustrated in Figs. 1 and 2.
A2.2.1 The condenser shall be made of seamless noncorrosive metal tubing, 560 6 5 mm in length, with an outside
diameter of 14 mm and a wall thickness of 0.8 mm to 0.9 mm.
NOTE A2.1—Since the thermal response of borosilicate glass and quartz
can be different, consider appropriate adjustments for the initial and final
heat regulation to attain the time limits stated in the procedure.
NOTE A2.2—For tests specifying dry point, specially selected flasks
with bottoms and walls of uniform thickness are desirable.
NOTE A2.3—Brass or stainless steel has been found to be a suitable
material for this purpose.
A2.1.1 Intralaboratory and interlaboratory data11 for motor
gasoline, kerosene, aviation turbine fuel, fuel oil, and diesel
fuel were assessed by Practice D6708 indicating that some
correction could improve the degree of agreement between
quartz and borosilicate flask results. The level of correction
could be considered practically not significant. Correction is
more probable at the IBP and FBP of both motor gasoline and
distillate fuels. Optimizing D86 parameters for motor gasoline
and distillate fuels may further minimize the differences in D86
IBP and FBP when using borosilicate versus quartz flask. Bias
can conceivably occur for materials and temperatures not
studied in this limited program.
A2.1.1.1 For motor gasoline in the temperature range of
25 °C to 220 °C:
Borosilicate = 1.0054 Quartz – 0.73
A2.1.1.2 For kerosene, aviation turbine fuel, fuel oil, and
diesel fuel in the temperature range of 140 °C to 350 °C:
A2.2.2 The condenser shall be set so that 393 mm 6 3 mm
of the tube is in contact with the cooling medium, with 50 mm
6 3 mm outside the cooling bath at the upper end, and with
114 mm 6 3 mm outside at the lower end. The portion of the
tube projecting at the upper end shall be set at an angle of 75°
6 3° with the vertical. The portion of the tube inside the
condenser bath shall be either straight or bent in any suitable
continuous smooth curve. The average gradient shall be 15° 6
1° with respect to the horizontal, with no 10 cm section having
a gradient outside of the 15° 6 3° range. The projecting lower
portion of the condenser tube shall be curved downward for a
length of 76 mm and the lower end shall be cut off at an acute
angle. Provisions shall be made to enable the flow of the
distillate to run down the side of the receiving cylinder. This
can be accomplished by using a drip-deflector, which is
attached to the outlet of the tube. Alternatively, the lower
portion of the condenser tube can be curved slightly backward
to ensure contact with the wall of the receiving cylinder at a
point 25 mm to 32 mm below the top of the receiving cylinder.
Fig. A2.3 is a drawing of an acceptable configuration of the
lower end of the condenser tube.
11
Supporting data have been filed at ASTM International Headquarters and may
be obtained by requesting Research Report RR:D02-1753. Contact ASTM Customer
Service at
17
D86 − 17
FIG. A2.2 Detail of Upper Neck Section
A2.2.3 The volume and the design of the bath will depend
on the cooling medium employed. The cooling capacity of the
bath shall be adequate to maintain the required temperature for
the desired condenser performance. A single condenser bath
may be used for several condenser tubes.
during operation. A typical shield would be 480 mm high,
280 mm long, and 200 mm wide, made of sheet metal of
0.8 mm thickness (22 gauge). The shield shall be provided with
at least one window to observe the dry point at the end of the
distillation.
A2.3 Metal Shield or Enclosure for Flask. (Manual units
only).
A2.3.2 Shield for Electric Heater (see Fig. 2)—A typical
shield would be 440 mm high, 200 mm long, and 200 mm
wide, made of sheet metal of approximately 0.8 mm thickness
(22 gauge) and with a window in the front side. The shield shall
A2.3.1 Shield for Gas Burner (see Fig. 1)—The purpose of
this shield is to provide protection for the operator and yet
allow easy access to the burner and to the distillation flask
18
D86 − 17
board (see A2.6) above the electric heater. The whole assembly
is adjustable from the outside of the shield.
A2.6 Flask Support Board—The flask support board shall
be constructed of ceramic or other heat-resistant material,
3 mm to 6 mm in thickness. Flask support boards are classified
as A, B, or C, based on the size of the centrally located
opening, the dimension of which is shown in Table 3. The flask
support board shall be of sufficient dimension to ensure that
thermal heat to the flask only comes from the central opening
and that extraneous heat to the flask other than through the
central opening is minimized. (Warning —Asbestoscontaining materials shall not be used in the construction of the
flask support board.)
A2.7 The flask support board can be moved slightly in
different directions on the horizontal plane to position the
distillation flask so that direct heat is applied to the flask only
through the opening in this board. Usually, the position of the
flask is set by adjusting the length of the side-arm inserted into
the condenser.
A2.8 Provision shall be made for moving the flask support
assembly vertically so that the flask support board is in direct
contact with the bottom of the distillation flask during the
distillation. The assembly is moved down to allow for easy
mounting and removal of the distillation flask from the unit.
FIG. A2.3 Lower End of Condenser Tube
be provided with at least one window to observe the dry point
at the end of the distillation.
A2.9 Receiving Cylinders—The receiving cylinder shall
have a capacity to measure and collect 100 mL 6 1.0 mL. The
shape of the base shall be such that the receiver does not topple
when placed empty on a surface inclined at an angle of 13°
from the horizontal.
A2.4 Heat Source
A2.4.1 Gas Burner (see Fig. 1), capable of bringing over the
first drop from a cold start within the time specified and of
continuing the distillation at the specified rate. A sensitive
manual control valve and gas pressure regulator to give
complete control of heating shall be provided.
A2.9.1 Manual Method—The cylinder shall be graduated at
intervals of 1 mL beginning at least at 5 mL and have a
graduation at the 100 mL mark. Construction details and
tolerances for the graduated cylinder are shown in Fig. A2.4.
A2.4.2 Electric Heater (see Fig. 2), of low heat retention.
A2.9.2 Automated Method—The cylinder shall conform to
the physical specifications described in Fig. A2.4, except that
graduations below the 100 mL mark are permitted, as long as
they do not interfere with the operation of the level follower.
Receiving cylinders for use in automated units may also have
a metal base.
NOTE A2.4—Heaters, adjustable from 0 W to 1000 W, have been found
to be suitable for this purpose.
A2.5 Flask Support
A2.5.1 Type 1—Use a Type 1 flask support with a gas burner
(see Fig. 1). This support consists of either a ring support of the
ordinary laboratory type, 100 mm or larger in diameter, supported on a stand inside the shield, or a platform adjustable
from the outside of the shield. On this ring or platform is
mounted a hard board made of ceramic or other heat-resistant
material, 3 mm to 6 mm in thickness, with a central opening
76 mm to 100 mm in diameter, and outside line dimensions
slightly smaller than the inside boundaries of the shield.
A2.9.3 If required, the receiving cylinder shall be immersed
during the distillation to above the 100 mL graduation line in a
cooling liquid contained in a cooling bath, such as a tall-form
beaker of clear glass or transparent plastic. Alternatively, the
receiving cylinder may be placed in a thermostated bath air
circulation chamber.
A2.10 Residue Cylinder—The graduated cylinder shall
have a capacity of 5 mL or 10 mL, with graduations into
0.1 mL subdivisions, beginning at 0.1 mL. The top of the
cylinder may be flared, the other properties shall conform to
Specification E1272.
A2.5.2 Type 2—Use a Type 2 flask support assembly with
electric heating (see Fig. 2 as one example). The assembly
consists of an adjustable system onto which the electric heater
is mounted with provision for placement of a flask support
19
D86 − 17
NOTE 1—1 mL graduations – minimum 5 mL to 100 mL
FIG. A2.4 100 mL Graduated Cylinder
A3. DETERMINATION OF THE DIFFERENCE IN LAG TIME BETWEEN AN ELECTRONIC TEMPERATURE MEASUREMENT SYSTEM AND A MERCURY-IN-GLASS THERMOMETER
A3.1 The response time of an electronic temperature measuring device is inherently more rapid than that of a mercuryin-glass thermometer. The temperature measuring device assembly in general use, consisting of the sensor and its casing,
or an electronic system and its associated software, or both, is
so designed that the temperature measuring system will simulate the temperature lag of the mercury-in-glass thermometer.
A3.3 Replace the electronic temperature measuring device
with a low range or a high range mercury-in-glass
thermometer, depending on the boiling range of the sample.
A3.2 To determine the difference in lag time between such
a temperature measuring system and a mercury-in-glass
thermometer, analyze a sample such as gasoline, kerosine, jet
fuel, or light diesel fuel with the electronic temperature
measurement system in place and in accordance with the
procedures described in this test method. In most cases this is
the standard distillation step performed with an automated unit.
A3.2.1 Do not use a single pure compound, a very narrow
boiling range product, or a synthetic blend of less than six
compounds for this test.
A3.2.2 Best results are obtained with a sample that is typical
of the sample load of the laboratory. Alternatively, use a
full-range mixture with a 5 % to 95 % boiling range of at least
100 °C.
A3.5 Calculate the values for the repeatability for the
observed slope (∆T/∆V) for the different readings in the test.
A3.4 Repeat the distillation with this thermometer, and
manually record the temperature at the various percent recovered as described in 10.14.
A3.6 Compare the test data obtained using these two temperature measuring devices. The difference at any point shall
be equal to, or less than, the repeatability of the method at that
point. If this difference is larger, replace the electronic temperature measuring device or adjust the electronics involved, or
both.
20
D86 − 17
TABLE A4.1 Precision for Percent Evaporated at a Prescribed Temperature—Gasoline (Consolidated Equation)
Valid Range E70 – E180°C (Automated Apparatus)
D86 Auto
r
0.00836 (150 – X)
R
0.0200 (150 – X)
where: X = percent evaporated at the prescribed temperature
A4. PROCEDURE TO DETERMINE THE PERCENT EVAPORATED OR PERCENT RECOVERED AT A PRESCRIBED TEMPERATURE READING
temperature, allow the distillate to drain into the receiving
graduate. Allow the contents of the flask to cool to below
approximately 40 °C and then drain its contents into the
receiving graduate. Note the volume of product in the receiving
graduate to the nearest 0.5 mL at 2 min intervals until two
successive observations agree.
A4.5.2.2 The amount recovered in the receiving graduate is
the percent recovery. Determine the amount of observed loss
by subtracting the percent recovery from 100.0.
A4.1 Many specifications require specific percentages
evaporated or recovered at prescribed temperature readings,
either as maxima, minima, or ranges. The procedures to
determine these values are frequently designated by the terms
Exxx or Rxxx, where xxx is the desired temperature.
NOTE A4.1—Regulatory standards on the certification of reformulated
gasoline under the complex model procedure require the determination of
E200 and E300, defined as the percent evaporated fuel at 93.3 °C (200 °F)
and 148.9 °C (300 °F), respectively. E158, the percent evaporated at a
distillation temperature of 70 °C (158 °F), is also used in describing fuel
volatility characteristics. Other typical temperatures are R 200 for kerosines and R 250 and R 350 for gas oils, where R 200, R 250, and R 350
are the percent recovered fuel at 200 °C, 250 °C, and 350 °C, respectively.
A4.6 Automated Distillation
A4.2 Determine the barometric pressure, and calculate the
correction to the desired temperature reading using Eq 3, Eq 4,
or Eq 5 for t = xxx°C (or tf = xxx°F).
A4.6.1 In the region between about 10 °C below and 10 °C
above the desired expected temperature reading determined in
A4.3, collect temperature-volume data at 0.1 % volume intervals or less.
A4.2.1 Manual Method—Determine this correction to
0.5 °C (1 °F).
A4.6.2 Continue the distillation, as described in Section 10,
and determine the percent loss, as described in 11.1.
A4.2.2 Automated Method—Determine this correction to
0.1 °C (0.2 °F).
A4.7 Calculations
A4.7.1 Manual Method—If a volume percent recovered
reading is not available at the exact temperature calculated in
A4.3, determine the percent recovered by interpolation between the two adjacent readings. Either the linear, as described
in 11.6.1, or the graphical procedure, as described in 11.6.2, is
permitted. The percent recovered is equal to Rxxx.
A4.3 Determine the expected temperature reading to yield
xxx °C (or xxx °F) after the barometric correction. To obtain
the expected value, add the absolute value of the calculated
correction to the desired temperature if the barometric pressure
is above 101.3 kPa. If the barometric pressure is below
101.3 kPa, subtract the absolute value of the calculated correction from the desired temperature.
A4.7.2 Automated Method—Report the observed volume to
0.1 % volume corresponding to the temperature closest to the
expected temperature reading. This is the percent recovered, or
Rxxx.
A4.4 Perform the distillation, as described in Section 10,
while taking into account A4.5 and A4.6.
A4.5.1 In the region between about 10 °C below and 10 °C
above the desired expected temperature reading determined in
A4.3 record the temperature reading in intervals of 1 volume
%.
A4.7.3 Manual and Automated Methods—To determine the
value of Exxx, add the observed loss to the percent recovered,
Rxxx, as determined in A4.7.1 or A4.7.2 and as described in
Eq 9.
A4.7.3.1 As prescribed in 12.6, do not use the corrected
loss.
A4.5.2 If the intent of the distillation is to solely determine
the value of Exxx or Rxxx, discontinue the distillation after at
least another 2 mL of distillate have been collected. Otherwise,
continue the distillation, as described in Section 10, and
determine the observed loss, as described in 11.1.
A4.5.2.1 If the intent of the distillation is to determine the
value of Exxx and the distillation was terminated after about
2 mL of distillate was collected beyond the desired
A4.8 Precision—The statistical determination of the precision of the volume % evaporated or recovered at a prescribed
temperature for automated apparatus were derived according to
Practice D6300 from a 2005 interlaboratory program.10Table
A4.1 shows the consolidated equations for volume percent
evaporated for gasoline, Table A4.2 shows the precision for
volume percent recovered for diesel. The precision is valid
only for the range of temperatures stated. The estimation of
A4.5 Manual Distillation
21
D86 − 17
TABLE A4.2 Precision for Percent Recovered at a Prescribed Temperature—Diesel (Rxxx)
Valid Range R200 – R300°C (Automated Apparatus)
R200C, R250C, R300C
D86 Auto
r
R
1.07
2.66
precision for temperature points outside the stated range can be
calculated from the procedures in A4.10 and the precision
tables in Annex A1.
VEP = the volume % recovered or evaporated corresponding
to the end point.
A4.10.1.4 In the event that the distillation end point occurs
prior to the 95 % point, the slope at the end point is calculated
as follows:
A4.9 The statistical determination of the precision of the
volume percent evaporated or recovered at a prescribed temperature for manual apparatus has not been directly measured
in an interlaboratory program. It can be shown that the
precision of the volume percent evaporated or recovered at a
prescribed temperature is equivalent to the precision of the
temperature measurement at that point divided by the rate of
change of temperature versus volume percent evaporated or
recovered. The estimation of precision becomes less precise at
high slope values.
S C ~ or S F ! 5 ~ T EP 2 T HR! / ~ V EP 2 V HR!
where:
TEP or THR
= the temperature, in °C or °F, at the percent
volume recovered indicated by the
subscript, and
VEP or VHR = the volume % recovered.
Subscript EP = end point, and
Subscript HR = highest reading, either 80 % or 90 %, prior
to the end point.
A4.10 Calculate the slope or rate of change in temperature
reading, SC (or SF), as described in A4.10.1 and Eq A4.1 and
using temperature values bracketing the desired temperature.
A4.10.1.5 For points between 10 % to 85 % recovered that
are not shown in Table A4.3, the slope is calculated as follows:
A4.10.1 Slope or Rate of Change of Temperature:
S C ~ or S F ! 5 0.05 ~ T ~ V110! 2 T ~ V210! !
NOTE A4.2—The slope can have a dramatic influence on precision for
some samples, typically those containing oxygenates, and the calculated
precision obtained using the values in Table A4.3 may not reflect this in
all cases. This can be due to the changing composition of the sample,
causing the slope to change rapidly over a short interval. This change may
occur either during the data increments prior to, or subsequent to, the data
point under calculation.
A4.10.3 Determine the repeatability or reproducibility, or
both, of the volume % evaporated or recovered at a prescribed
temperature from the following formulas:
where:
rvolume %
Rvolume %
r
(A4.1)
where:
SC =
=
SF
TU =
TL =
VU =
VL
(A4.3)
A4.10.2 Calculate the repeatability, r, or the reproducibility,
R, from the slope, SC (or SF) and the data in Tables A4.4 and
A4.5.
A4.10.1.1 To determine the precision of a result, it is
generally necessary to determine the slope or rate of change of
the temperature at that particular point. This variable, denoted
as SC or SF, is equal to the change in temperature, either in °C
or in °F, respectively, per percent recovered or evaporated.
A4.10.1.2 The precision of the IBP and EP does not require
any slope calculation.
A4.10.1.3 With the exception stated in A4.10.1.2, the slope
at any point during the distillation is calculated from the
following equations, using the values shown in Table A4.3:
S C ~ or S F ! 5 ~ T U 2 T L ! / ~ V U 2 V L !
(A4.2)
R
the slope, °C/volume %,
the slope, °F/volume %,
the upper temperature, °C (or °F),
the lower temperature, °C (or °F),
the volume % recovered or evaporated corresponding
to TU,
= the volume % recovered or evaporated corresponding
to TL, and
SC (SF)
r volume % 5 r/S C ~ S F !
(A4.4)
R volume % 5 R/S C ~ S F !
(A4.5)
= repeatability of the volume percent evaporated
or recovered,
= reproducibility of the volume percent evaporated or recovered,
= repeatability of the temperature at the prescribed temperature at the observed percent
distilled,
= reproducibility of the temperature at the prescribed temperature at the observed percent
distilled, and
= rate of change in temperature reading in °C (°F)
per the volume percent evaporated or
recovered.
A4.10.4 Examples on how to calculate the repeatability and
the reproducibility are shown in Appendix X2.
22
D86 − 17
TABLE A4.3 Data Points for Determining Slope, SC or SF
Slope at %
TL at %
TU at %
VU - V L
IBP
0
5
5
5
0
10
10
10
0
20
20
20
10
30
20
30
20
40
20
40
30
50
20
50
40
60
20
60
50
70
20
70
60
80
20
80
70
90
20
90
80
90
10
95
90
95
5
EP
95
VEP
VEP −95
TABLE A4.4 Repeatability and Reproducibility for Group 1
Manual
ReproducibilityA
Manual
RepeatabilityA
Evaporated
Point, %
IBP
5
10
20
30–70
80
90
95
FBP
°C
°F
°C
°F
3.3
1.9+0.86SC
1.2+0.86SC
1.2+0.86SC
1.2+0.86SC
1.2+0.86SC
1.2+0.86SC
1.2+0.86SC
3.9
6
3.4+0.86SF
2.2+0.86SF
2.2+0.86SF
2.2+0.86SF
2.2+0.86SF
2.2+0.86SF
2.2+0.86SF
7
5.6
3.1+1.74SC
2.0+1.74SC
2.0+1.74SC
2.0+1.74SC
2.0+1.74SC
0.8+1.74SC
1.1+1.74SC
7.2
10
5.6+1.74SF
3.6+1.74SF
3.6+1.74SF
3.6+1.74SF
3.6+1.74SF
1.4+1.74SF
1.9+1.74SF
13
A
SC or SF is the average slope (or rate of change) calculated in accordance with A4.10.1. Table A4.4 precision data obtained from RR study on both manual and automated
D86 units by North American and IP laboratories.
TABLE A4.5 Repeatability and Reproducibility for Groups 2, 3 and 4 (Manual Method)
RepeatabilityA
A
ReproducibilityA
°C
°F
°C
°F
IBP
5—95 %
FBP
1.0+0.35SC
1.0+0.41SC
0.7+0.36SC
1.9+0.35SF
1.8+0.41SF
1.3+0.36SF
2.8+0.93SC
1.8+1.33SC
3.1+0.42SC
5.0+0.93SF
3.3+1.33SF
5.7+0.42SF
% volume at
temperature reading
0.7+0.92/SC
0.7+1.66/SF
1.5+1.78/SC
1.53+3.20/SF
SC or SF is the average slope (or rate of change) calculated in accordance with A4.10.1. Table A4.5 has been derived from the monographs in Figs. 6 and 7 in D86–97.
APPENDIXES
(Nonmandatory Information)
X1. EXAMPLES ILLUSTRATING CALCULATIONS FOR REPORTING OF DATA
X1.1 The observed distillation data used for the calculation
of the examples below are shown in the first three columns of
Fig. X1.1.
X1.1.1 Temperature readings corrected to 101.3 kPa
(760 mm Hg) pressure (see 11.3) are as follows:
correction ~ °C ! 5 0.0009 ~ 101.3 2 98.6! ~ 2731t c !
(X1.1)
correction ~ °F ! 5 0.00012 ~ 760 2 740! ~ 4601t f !
(X1.2)
X1.1.2 Loss correction to 101.3 kPa (see 11.4) are as
follows. The data for the examples are taken from Fig. X1.1.
corrected loss 5 ~ 0.5 1 ~ 4.7 2 0.5!! /
(X1.3)
$ 11 ~ 101.3 2 98.6! /8.0% 5 3.6
X1.1.3 Recovery correction to 101.3 kPa (see 11.4.1) are as
follows:
corrected recovery 5 94.21 ~ 4.7 2 3.6! 5 95.3
(X1.4)
FIG. X1.1 Example of Test Report
23
D86 − 17
X1.2 Temperature Readings at Prescribed Percent
Evaporated
X1.2.3 Temperature reading at 90 % evaporated (85.3 %
recovered) (see 11.6.1) are as follows:
X1.2.1 Temperature reading at 10 % evaporated (4.7 %
observed loss = 5.3 % recovered) (see 11.6.1) are as follows:
T 10E ~ °C ! 5 33.71 @ ~ 40.3 2 33.7!
(X1.5)
~ 5.3 2 5 ! / ~ 10 2 5 ! # 5 34.1°C
T 10E ~ °F ! 5 92.71 @ ~ 104.5 2 92.7!
X1.2.2 Temperature reading at 50 % evaporated (45.3 %
recovered) (see 11.6.1) are as follows:
~ 45.3 2 40! / ~ 50 2 40! # 5 101.9°C
T 50E ~ °F ! 5 2011 @ ~ 228 2 201!
(X1.9)
~ 85.3 2 85! / ~ 90 2 85! # 5 182.8°C
T 90E ~ °F ! 5 358.91 @ ~ 394.8 2 358.9!
(X1.10)
~ 85.3 2 85! / ~ 90 2 85! # 5 361.0°F
X1.2.4 Temperature reading at 90 % evaporated (85.3 %
recovered) not corrected to 101.3 kPa pressure (see 11.6.1) are
as follows:
(X1.6)
~ 5.3 2 5 ! / ~ 10 2 5 ! # 5 93.1°F
T 50E ~ °C ! 5 93.91 @ ~ 108.9 2 93.9!
T 90E ~ °C ! 5 181.61 @ ~ 201.6 2 181.6!
(X1.7)
T 90E ~ °C ! 5 180.51 @ ~ 200.4 2 180.5!
(X1.11)
~ 85.3 2 85! / ~ 90 2 85! # 5 181.7°C
T 90E ~ °F ! 5 3571 @ ~ 392 2 357!
(X1.12)
~ 85.3 2 85! / ~ 90 2 85! # 5 359.1°F
NOTE X1.1—Results calculated from °C data may not correspond
exactly to results calculated from °F data because of errors in rounding.
(X1.8)
~ 45.3 2 40! / ~ 50 2 40! # 5 215.3°F
X2. EXAMPLES OF CALCULATION OF REPEATABILITY AND REPRODUCIBILITY OF VOLUME % (RECOVERED OR
EVAPORATED) AT A PRESCRIBED TEMPERATURE READING
TABLE X2.1 Distillation Data from a Group 1 Sample Manual
Distillation
Distillation Point
Recovered, mL
Temperature °C
Temperature °F
51.1
S F % 5 0.1 ~ T ~ 20! 2 T ~ 10! !
Volume (mL)
Recovered at
93.3 °C (200 °F)
50.1 ~ 201 2 182!
18.0
10
20
30
40
84
94
103
112
183
202
217
233
Distillation Point
Evaporated, mL
Temperature° C
Temperature° F
10
20
30
40
83
94
103
111
51.9
X2.2.2 From Table A4.4, determine the value of R, the
reproducibility at the observed percentage distilled. In this
case, the observed percentage distilled is 18 % and
Volume (mL)
Evaporated at
93.3 °C (200 °F)
18.4
R 5 2.011.74 ~ S C !
182
201
217
232
(X2.2)
52.011.74 3 1.1
53.9
R 5 3.611.74 ~ S F !
X2.1 Some specifications require the reporting of the volume % evaporated or recovered at a prescribed temperature.
Table X2.1 shows the distillation data of a Group 1 sample as
obtained by a manual unit.
53.611.74 3 1.9
56.9
X2.2.3 From the calculated value of R, determine the value
of volume, as described in A4.10.
X2.2 Example Calculation
R volume % 5 R/ ~ S C !
X2.2.1 For a Group 1 sample exhibiting distillation characteristics as per Table X2.1, as determined by a manual unit, the
reproducibility of the volume evaporated, Rvolume %, at
93.3 °C (200 °F) is determined as follows:
X2.2.1.1 Determine first the slope at the desired temperature:
S C % 5 0.1 ~ T ~ 20! 2 T ~ 10! !
53.9/1.1
53.5
R volume % 5 R/ ~ S F !
(X2.1)
56.9/1.9
50.1 ~ 94 2 83!
53.6
24
(X2.3)
D86 − 17
FIG. X3.1 Corrected Loss from Observed Loss and Barometric Pressure kPa
X3. TABLES OF CORRECTED LOSS FROM MEASURED LOSS AND BAROMETRIC PRESSURE
X3.1 The table presented as Fig. X3.1 can be used to
determine the corrected loss from the measured loss and the
barometric pressure in kPa.
X3.2 The table presented as Fig. X3.2 can be used to
determine the corrected loss from the measured loss and the
barometric pressure in mm Hg.
25