solar cell conversion efficiency limits chapter 5
Bạn đang xem bản rút gọn của tài liệu. Xem và tải ngay bản đầy đủ của tài liệu tại đây (291.41 KB, 12 trang )
SOLAR CELLS Chapter 5. Solar Cell Conversion-Efficiency Limits
- 5.1 -
Chapter 5.
SOLAR CELL
CONVERSION-EFFICIENCY LIMITS
5.1 Solar cell conversion efficiency and radiation spectrum
The conversion efficiency, η, of solar cells is calculated as the ratio between the
generated maximum power, P
m
, generated by a solar cell and the incident power, P
in
. The
incident power is equal to the irradiance of AM1.5 spectrum, normalized to 1000 W/m
2
. The
η is determined from the I-V measurement using Eq. (4.32).
in
ocsc
in
mpmp
in
m
P
FFVJ
P
VJ
P
P
===
η
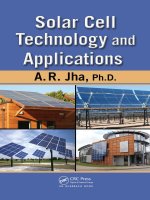
The irradiance of AM1.5 spectrum can be calculated from the spectral power density,
()
λ
P ,
(see Figure 5.1) using the following equation:
()
∫
∞
=
0
dλλPP
in
(5.1)
Using Eq. (2.3) that relates the photon flux density,
(
)
λ
Φ , to the spectral power density, Eq.
(5.2) can be written as:
()
∫
∞
=
0
dλ
λ
hc
λΦP
in
(5.2)
SOLAR CELLS Chapter 5. Solar Cell Conversion-Efficiency Limits
- 5.2 -
Figure 5.1. Spectral power density of black-body radiation at 6000 K, AMO and AM1.5
spectra.
5.2 Conversion efficiency limiting factors
5.2.1 Spectral mismatch
There are two principal losses that strongly reduce the energy conversion efficiency of
today’s solar cells. As discussed in Chapter 4, an important part of a solar cell is the absorber
layer, in which the photons of the incident radiation are efficiently absorbed resulting in a
creation of electron-hole pairs. The absorber layer of the solar cells is in most cases formed by
a semiconductor material, which has its distinct optical properties characterized by the band
gap energy, E
G
, and the complex refractive index, ñ = n - ik. In principle, only photons with
energy higher than the band gap energy of the absorber generate electron-hole pairs. Since the
electrons and holes tend to occupy energy levels at the bottom of the conduction band and the
top of the valence band, respectively, the extra energy that the electron-hole pairs receive
from the photons is released as heat into the semiconductor lattice in the thermalization
process. Photons with energy lower than the band gap energy of the semiconductor absorber
are in principle not absorbed and cannot generate electron-hole pairs. Therefore these photons
are not involved in the energy conversion process. The non-absorption of photons carrying
less energy than the semiconductor band gap and the excess energy of photons, larger than the
band gap, are the two main losses in the energy conversion process using solar cells. Both of
these losses are thus related to the spectral mismatch of the energy distribution of photons in
the solar spectrum and the band gap of a semiconductor material
We can determine the fraction of energy of the incident radiation spectrum that is
absorbed by a single junction solar cell. When we denote λ
G
as the wavelength of photons that
corresponds to the band gap energy of the absorber of the solar cell, only the photons with the
energy higher than the band gap are absorbed, it means photons with λ ≤ λ
G
. The fraction of
the incident power, p
abs
that is absorbed by a solar cell and used for energy conversion is
expressed as:
500 1000 1500 2000 2500
0
0.5
1
1.5
2
2.5
Wavelength [nm]
SPectral Power Density [W/m
2
nm]
Black body @ 6000K
AM0
AM1.5
SOLAR CELLS Chapter 5. Solar Cell Conversion-Efficiency Limits
- 5.3 -
()
()
∫
∫
∞
=
0
0
dλ
λ
hc
λΦ
dλ
λ
hc
λΦ
p
G
abs
λ
(5.3)
A part of the absorbed energy, the excess energy of photons, is lost due tot the thermalization
of photo-generated electrons and holes in the absorber material. The fraction of the absorbed
energy that the solar can deliver as useful energy,
p
use
, is described by Eq. (5.4):
()
()
∫
∫
=
G
G
dλ
λ
hc
λΦ
dλλΦE
p
G
use
λ
λ
0
0
(5.4)
We can determine the conversion efficiency limited by the spectral mismatch:
()
()
()
()
∫
∫
∫
∫
∞
==
G
GG
dλ
λ
hc
λΦ
dλλΦE
dλ
λ
hc
λΦ
dλ
λ
hc
λΦ
pp
G
useabs
λ
λλ
η
0
0
0
0
(5.5)
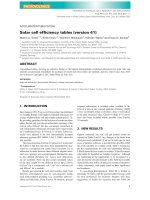
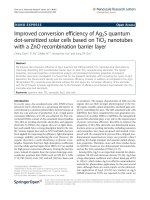
Figure 5.2 illustrates the fraction of the AM1.5 spectrum that can be converted into a usable
energy by a crystalline silicon solar cell.
Figure 5.2. The fraction of the AM1.5 spectrum that can be converted into a usable energy by
a crystalline silicon solar cell.
500 1000 1500 2000 2500
0
0.2
0.4
0.6
0.8
1
1.2
1.4
1.6
1.8
Wavelength [nm]
Spectral Power Density [W / m
2
.nm]
AM 1.5
c-Si Single Cell
λ
G
Non-absorption λ
G
< λ
ph
Thermalization E
ph
-E
G
SOLAR CELLS Chapter 5. Solar Cell Conversion-Efficiency Limits
- 5.4 -
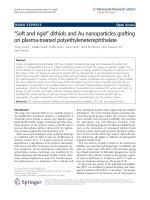
Figure 5.3 shows the conversion efficiency of a solar cells limited only by spectral mismatch
as a function of the band gap of a semiconductor absorber for three different radiation spectra,
black-body radiation at 6000 K, AM0 and AM1.5 solar radiation spectra. The figure
demonstrates that in the case of a crystalline silicon solar cell (
E
G
= 1.1 eV) the losses due to
the spectral mismatch account for almost 50 %. It also shows that an optimal absorber
material for a single junction solar cell has a band gap of 1.1 eV and 1.0 eV for AM0 and
AM1.5 spectrum, respectively. Note that the maximum conversion efficiency for the AM1.5
spectrum is higher than that for AM0, while the AM0 spectrum has a higher overall power
density. This is caused by the fact that the AM1.5 spectrum has a lower power density in parts
of the spectrum that are not contributing to the energy conversion process as can be seen in
Fig. 5.2. The dips in the AM1.5 spectrum also result in the irregular shape of the maximum
conversion efficiency as function of the band gap.
Figure 5.3. Maximum conversion efficiency for the black body spectrum at 6000 K, the AM0
and AM1.5 solar radiation spectra, limited only by the spectral mismatch as a function of the
band gap of a semiconductor absorber in single junction solar cells.
5.2.2 Solar cell optical properties
As mentioned in the previous section there are also other optical parameters than
E
G
that have influence on the conversion efficiency of a solar cell. These are optical constants of
the individual layers,that are expressed in the complex refractive index
ñ=n - ik. The optical
constants, refractive index,
n, and extinction coefficient, k, are function of the wavelength.
In general, when light arrives on an interface between two media, a part of the light is
reflected from and the other part is transmitted through the interface. The interface is therefore
characterized by the wavelength dependent reflectance,
R(
λ
), and transmittance, T(
λ
).
Reflectance is the ratio of the energy reflected from the surface of the interface to the total
0.5 1 1.5 2 2.5
0
0.1
0.2
0.3
0.4
0.5
Energy Band Gap [eV]
Efficiency
Black body @ 6000K
AM0
AM1.5
SOLAR CELLS Chapter 5. Solar Cell Conversion-Efficiency Limits
- 5.5 -
incident energy. There is a reflection of light at the interface between the first layer of a solar
cell and the incident medium, usually air, and there is also reflection at the interfaces between
the individual layers within the solar cell. All these processes result in a total reflectance
between the solar cell and air. This means that a part of the incident energy that can be
converted into a usable energy by the solar cell is lost by reflection. We shall denote the total
reflectance as
R*, which can be considered as the effective reflectance in the wavelength
range of interest.
In most c-Si solar cells one of the metal electrodes is placed on the front side of the
cell. The metal-covered area does not allow the light to enter the solar cell because it totally
reflects the light in wavelength range of interest. The area that is covered by the electrode
effectively decreases the active area of the solar cell through which the light enters the solar
cell. When we denote the total area of the cell
A
tot
and the cell area that is not covered by the
electrode
A
f
, the active area of the cell is determined by the ratio of A
f
/A
tot
. This ratio is called
the coverage factor and determines the so called shading losses. The design of the front
electrode is therefore of great importance since in order to minimize the losses due to the
series resistance of the front electrode, it should be designed with sufficient cross-section. The
optimal design of the front electrode is a trade-off between a high coverage factor and a
sufficiently low series resistance of the front electrode.
When light penetrates into a material, it will be absorbed as it propagates through the
material. The absorption of light in the material depends on its absorption coefficient which is
related to the extinction coefficient through Eq. (3.32). In general, light is absorbed in all
layers that form the solar cell. However, the solar cell is optimally designed when most of the
incident light is absorbed in the absorber layer. Due to the limited thickness of the absorber
layer, not all the light entering the absorber layer is absorbed. Incomplete absorption in the
absorber due to its limited thickness is an additional loss that lowers the efficiency of the
energy conversion. The incomplete absorption loss can be described by the internal optical
quantum efficiency,
QE
op
, which is the probability of a photon being absorbed in a material.
Since there is a chance that a high energetic photon can generate more than one electron-hole
pair, we define the quantum efficiency for carrier generation,
η
g
, which represents the number
of electron-hole pairs generated by one absorbed photon. Usually
η
g
is assumed to be unity.
5.2.3 Solar cell collection losses
Not all charge carries that are generated in a solar cell are collected at the electrodes.
The photo-generated carries are the excess carriers with respect to the thermal equilibrium and
are subjected to the recombination. The carriers recombine in the bulk, at the interfaces,
and/or at the surfaces of the junction. The recombination is determined by the electronic
properties of materials that form the junction, such as density of states introduced into the
band gap by the R-G centers. The concentration of R-G centers strongly influences the
minority-carrier lifetimes as discussed in Chapter 3.
The contributions of both the electronic and optical properties of the solar cell
materials to the photovoltaic performance are taken into account in the absolute external
quantum efficiency. The absolute external quantum efficiency is defined as the number of
charge carriers collected (from all layers of the device) per incident photon at each
wavelength λ. This quantum efficiency can be approximated as
() ()
(
)
λληλλ
elgop
QEQERQE )()1(
∗
−= , (5.6)
SOLAR CELLS Chapter 5. Solar Cell Conversion-Efficiency Limits
- 5.6 -
Where the QE
el
is the electrical quantum efficiency and is defined as the probability that a
photo-generated carrier is collected. When we combine the absolute external quantum
efficiency (Eq. (5.6)) and shading losses with the photon flux density of the spectrum of
incident radiation we can determine the expected short-circuit current density that a solar cell
can deliver. The maximal current density that the solar cell can deliver is determined by the
band gap of the absorber layer that determines which photons of the incident radiation can
generate electron-hole pairs. When we assume that all these photons are absorbed and all
generated carriers are collected the maximum current density, J
max
, is described as:
()
∫
=
G
dλλΦqJ
λ
0
max
(5.7)
The short-circuit current density is determined by the absolute external quantum efficiency
and the shading loss:
()
tot
f
elGoptsc
A
A
QEQERJJ
η
∗
−= 1
max
(5.8)
Combining Eq. (5.7) and Eq. (5.8) we obtain:
()
()
∫
∗
−=
G
dλλΦ
A
A
QEQERqJ
tot
f
elGoptsc
λ
η
0
1
(5.9)
Note that the upper limit of the integration is set at the wavelength corresponding to the band
gap of the absorber layer. Photons with larger wavelength (lower energy) cannot generate
electron hole pairs. Therefore QE
op
equals zero larger wavelengths.
5.2.4 Additional limiting factors
In chapter 4 we discussed that the V
oc
of a solar cell depends on the saturation current
and the photo-generated current (Eq. (4.29)) of the solar cell. The saturation current density
depends on the recombination in the solar cell that cannot be avoided and is referred to as the
fundamental recombination. This fundamental recombination depends on the doping of the
different regions (n-type and p-type regions) of a junction and the electronic quality of
materials forming the junction. The doping levels and the recombination determine the
voltage factor, qV
oc
/E
G
, that is the ratio of the maximum voltage developed by the solar cell
(V
oc
) to the voltage related to the band-gap of the absorber (E
G
/q).
The maximum power generated by a solar cell is dependent on the
fill factor, FF. In
case of a solar cell that behaves as an ideal diode only direct recombination occurs and the
maximal FF is a function of V
oc
and can be approximated by Eq. (4.31). In a practical solar
cell the FF is lower than the ideal value due to following reasons:
• The voltage drop due to the series resistance R
s
of a solar cell. The series resistance is
introduced by the resistance of the main current path through which the photo-generated
carriers arrive to the external circuit. The contributions to the series resistance come from
the bulk ressistance of the junction, the contact resistance between the junction and
electrodes, the resistance of the electrodes.
SOLAR CELLS Chapter 5. Solar Cell Conversion-Efficiency Limits
- 5.7 -
• The voltage drop due to the leakage current and characterized by the shunt resistance R
p
of a solar cell. The leakage current is caused by the current through local defects in the
junction or due to the shunts at the edges of solar cells.
• The recombination in a non-ideal solar cell results in a decrease of the FF.
5.2.5 Conversion efficiency
The conversion efficiency determined from the I-V measurement can be expressed as:
in
ocsc
P
FFVJ
=
η
Using Eq. (5.2) and Eq. (5.9) we can rewrite the expression for the conversion efficiency as
()
()
()
FFV
A
A
QEQER
dλ
λ
hc
λΦ
dλλΦq
oc
tot
f
elGopt
G
ηη
λ
*
0
0
0
0
1−=
∫
∫
∞
(5.10)
We can introduce the voltage factor (qV
oc
/E
G
) into Eq. (5.10) by expressing the V
oc
as:
q
E
E
qV
V
G
G
oc
oc
= (5.11)
()
()
()
FF
q
E
E
qV
A
A
QEQER
dλ
λ
hc
λΦ
dλλΦq
G
G
oc
tot
f
elGopt
G
ηη
λ
*
0
0
0
0
1−=
∫
∫
∞
(5.12)
By introducing a term
()
()
∫
∫
G
G
dλ
λ
hc
λΦ
dλ
λ
hc
λΦ
λ
λ
0
0
0
0
into the right side of Eq. (5.12) and manipulating it, the
conversion efficiency can be now written as
1
()
()
()
()
()
FF
E
qV
A
A
QEQER
dλ
λ
hc
λΦ
dλλΦE
dλ
λ
hc
λΦ
dλ
λ
hc
λΦ
G
oc
tot
f
elGopt
G
G
GG
****
0
0
0
0
0
0
0
0
1
ηη
λ
λλ
−=
∫
∫
∫
∫
∞
(5.13)
1
R.J. van Overstraeten, R.P. Mertens, Physics, Technology and Use of Photovoltaics, Adam Hilger Ltd, 1986.
1
2
3
4
5
6
7
8
SOLAR CELLS Chapter 5. Solar Cell Conversion-Efficiency Limits
- 5.8 -
Eq. (5.13) describes the conversion efficiency of a solar cell in terms of components that
represent particular losses in energy conversion.
1.
Loss due to non-absorption of long wavelengths
2.
Loss due to thermalization of the excess energy of photons
3.
Loss due to the total reflection
4.
Loss by incomplete absorption due to the finite thickness
5.
Loss due to recombination
6.
Loss by metal electrode coverage, shading losses
7.
Loss due to voltage factor
8.
Loss due to fill factor
Figure 5.4 shows the efficiency as a function of the band gap of the absorber of an ideal solar
cell, such that losses due to 3, 4, 6 are eliminated.
Figure 5.4. The detailed balance efficiency limit as a function of the band gap of a solar cell
illuminated by different incident spectra: Black body radiator at 6000K (blue dots); sampled
black body radiator (blue dashes); AM0 (black solid line); AM1.5 (red dash-dot).
SOLAR CELLS Chapter 5. Solar Cell Conversion-Efficiency Limits
- 5.9 -
5.3 Equivalent circuit
The
J-V characteristic of an illuminated solar cell that behaves as the ideal diode is
discribed by Eq. (4.27):
ph
J
kT
qV
JJ −
⎥
⎦
⎤
⎢
⎣
⎡
−
⎟
⎠
⎞
⎜
⎝
⎛
= 1exp
0
This behaviour can be described by a simple equivalent circuit, in which a diode and a current
source are connected in parallel. The equivalent circuit is shown in Figure 5.5a. The diode is
formed by a p-n junction. The first term in Eq. (4.27) describes the dark diode current density
and the second term describes the photo-generated current density. In practice the FF is
influenced by the series resistance, R
s
, and the shunt resistance, R
p
, of a solar cell. The
influence of these parameters on the J-V characteristic of the solar cell can be studied using
the equivalent circuit presented in Figure 5.5b. The J-V characteristic of the one-diode
equivalent circuit with the series resistance and the shunt resistance is described by (A is the
area of the solar cell):
()
ph
p
ss
J
R
AJRV
kT
AJRVq
JJ −
−
+
⎥
⎦
⎤
⎢
⎣
⎡
−
⎟
⎠
⎞
⎜
⎝
⎛
−
= 1exp
0
(5.14)
a)
b)
Figure 5.5. a) The equivalent circuit of an ideal solar cell. b) The equivalent circuit of a solar
cell with series and shunt resistance. R
s
is the series resistance, R
p
is the shunt resistance.
I
ph
V
+
-
II
d
I
I
ph
V
+
-
II
d
I
R
s
R
p
V
+
-
I
I
d
I
ph
R
s
R
p
V
+
-
I
I
d
I
ph
SOLAR CELLS Chapter 5. Solar Cell Conversion-Efficiency Limits
- 5.10 -
The effect of R
s
and R
p
on the J-V characteristic is illustrated in Figure 5.6a and 5.6b,
respectively.
a)
b)
Figure 5.6. Effect of parasitic resistances on the J-V characteristic of a solar cell.
0 0.1 0.2 0.3 0.4 0.5 0.6 0.7 0.8
-500
-400
-300
-200
-100
0
100
200
Voltage [V]
Current Density [A/m
2
]
Rp = 1e4 Ohm
Voc
Rs = 0 Ohm
Rs = 2.5 Ohm
Rs = 5 Ohm
Rs = 7.5 Ohm
Rs = 10 Ohm
Rs
0 0.1 0.2 0.3 0.4 0.5 0.6 0.7 0.8
-500
-400
-300
-200
-100
0
100
200
Voltage [V]
Current Density [A/m
2
]
Rs = 0 Ohm
Voc
Rp = 0.001 Ohm
Rp = 0.005 Ohm
Rp = 0.01 Ohm
Rp = 0.03 Ohm
Rp = 1e4 Ohm
Rp
SOLAR CELLS Chapter 5. Solar Cell Conversion-Efficiency Limits
- 5.11 -
In practical solar cells the FF is influenced by the additional recombination occurring in the p-
n junction. This non-ideal diode is often represented in the equivalent circuit by two diodes,
an ideal one with an ideality factor equal to unity and a non-ideal diode with an ideality factor
larger than unity. The equivalent circuit of a practical solar cell is presented in Figure 5.7. The
J-V characteristic of the two-diode equivalent circuit is described by:
()
(
)
ph
p
sss
J
R
AJRV
kTn
AJRVq
J
kTn
AJRVq
JJ −
−
+
⎥
⎦
⎤
⎢
⎣
⎡
−
⎟
⎟
⎠
⎞
⎜
⎜
⎝
⎛
−
+
⎥
⎦
⎤
⎢
⎣
⎡
−
⎟
⎟
⎠
⎞
⎜
⎜
⎝
⎛
−
= 1exp1exp
2
02
1
01
(5.15)
The J
01
and J
02
are the saturation currents of the two diodes, respectively, and n
1
and n
2
are
the ideality factors of the two diodes.
Figure 5.7. The equivalent circuit of a solar cell based on a two-diode model.
R
s
R
p
1
2
V
+
-
I
I
d1
I
ph
I
d2
n
2
>1n
1
=1
R
s
R
p
1
2
V
+
-
I
I
d1
I
ph
I
d2
n
2
>1n
1
=1
SOLAR CELLS Chapter 5. Solar Cell Conversion-Efficiency Limits
- 5.12 -
EXAMPLE.
A commercial multi-crystalline silicon solar cell with a so-called H-pattern as a front contact design (see figure)
has the following specifications:
• V
oc
=605 mV, I
sc
=5.0 A,
• V
mpp
=500 mV, I
mpp
=4.6 A,
• size:156 cm
2
,
• 9% metallization coverage.
V
mpp
and I
mpp
are the voltage and current, respectively, at the maximum power point
a) Calculate the total area and active area efficiency of the cell, respectively (irradiance: 100 mW/cm
2
)
η
ta
=V
mpp
×
I
mpp
/(156 cm
2
×
0.1 Wcm
-2
)
×
100%=0.5
×
4.6/(156
×
0.1)
×
100%=14.7%
η
aa
=V
mpp
×
I
mpp
/(156 cm
2
×
0.91
×
0.1 Wcm
-2
)
×
100%=0.5
×
4.6/(156
×
0.91
×
0.1)
×
100%=16.2%
b) Calculate the fill factor FF of the cell
FF=V
mpp
×
I
mpp
/(V
oc
x I
sc
) = 0.5
×
4.6/(0.605*5)=0.760.
Cells with these characteristics will be interconnected with strips (see figure). This will result in an additional 2
m
Ω
series resistance loss.
c) Calculate the lower FF due to this higher series resistance (Hint: use the voltage drop at the maximum power
point to calculate the lower FF)
∆
V=I
mpp
∆
R=4.6
×
2
⋅
10
-3
=9.2
⋅
10
-3
V = 9.2 mV
∆
FF=
∆
V/V
mpp
×
FF=9.2/500
×
0.760=0.014; FF
new
=0.760-0.014=0.746
Figure: Standard cells with H pattern and interconnection strips