A computer system consists of hardware, system programs, and application programs figs 3
Bạn đang xem bản rút gọn của tài liệu. Xem và tải ngay bản đầy đủ của tài liệu tại đây (348.55 KB, 15 trang )
3
DEADLOCKS
3.1 RESOURCES
3.2 INTRODUCTION TO DEADLOCKS
3.3 THE OSTRICH ALGORITHM
3.4 DEADLOCK DETECTION AND RECOVERY
3.5 DEADLOCK AVOIDANCE
3.6 DEADLOCK PREVENTION
3.7 OTHER ISSUES
3.8 RESEARCH ON DEADLOCKS
3.9 SUMMARY
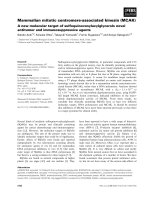
typedef int semaphore; typedef int semaphore;
semaphore resource 1; semaphore resource 1;
semaphore resource 2;
void process A(void) { void process A(void) {
down(&resource 1); down(&resource 1);
use resource 1( ); down(&resource 2);
up(&resource 1); use both resources( );
} up(&resource 2);
up(&resource 1);
}
(a) (b)
Fig. 3-1. Using a semaphore to protect resources. (a) One resource.
(b) Two resources.
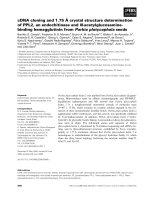
typedef int semaphore;
semaphore resource 1; semaphore resource 1;
semaphore resource 2; semaphore resource 2;
void process A(void) { void process A(void) {
down(&resource 1); down(&resource 1);
down(&resource 2); down(&resource 2);
use both resources( ); use both resources( );
up(&resource 2); up(&resource 2);
up(&resource 1); up(&resource 1);
}}
void process B(void) { void process B(void) {
down(&resource 1); down(&resource 2);
down(&resource 2); down(&resource 1);
use both resources( ); use both resources( );
up(&resource 2); up(&resource 1);
up(&resource 1); up(&resource 2);
}}
(a) (b)
Fig. 3-2. (a) Deadlock-free code. (b) Code with a potential
deadlock.
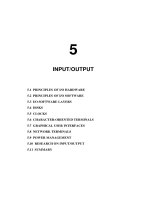
(a) (b) (c)
T U
D
C
S
B
A
R
Fig. 3-3. Resource allocation graphs. (a) Holding a resource.
(b) Requesting a resource. (c) Deadlock.
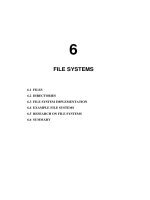
(j)
A
Request R
Request S
Release R
Release S
B
Request S
Request T
Release S
Release T
C
Request T
Request R
Release T
Release R
1. A requests R
2. B requests S
3. C requests T
4. A requests S
5. B requests T
6. C requests R
deadlock
1. A requests R
2. C requests T
3. A requests S
4. C requests R
5. A releases R
6. A releases S
no deadlock
A
R
B
S
C
T
(i)
A
R
B
S
C
T
(h)
A
R
B
S
C
T
(g)
A
R
B
S
C
T
(f)
A
R
B
S
C
T
(e)(d)
(c)(b)(a)
A
R
B
S
C
T
(q)
A
R
B
S
C
T
(p)
A
R
B
S
C
T
(o)
A
R
B
S
C
T
(n)
A
R
B
S
C
T
(m)
A
R
B
S
C
T
(l)(k)
A
R
B
S
C
T
Fig. 3-4. An example of how deadlock occurs and how it can be
avoided.
R
S T R
U
V U V
W
C
D E D
E
G
G
A
F
B
(a) (b)
Fig. 3-5. (a) A resource graph. (b) A cycle extracted from (a).
Resources in existence
(E
1
, E
2
, E
3
, …, E
m
)
Current allocation matrix
C
11
C
21
C
n1
C
12
C
22
C
n2
C
13
C
23
C
n3
C
1m
C
2m
C
nm
Row n is current allocation
to process n
Resources available
(A
1
, A
2
, A
3
, …, A
m
)
Request matrix
R
11
R
21
R
n1
R
12
R
22
R
n2
R
13
R
23
R
n3
R
1m
R
2m
R
nm
Row 2 is what process 2 needs
Fig. 3-6. The four data structures needed by the deadlock detection
algorithm.
Tape drives
Plotters
Scanners
CD Roms
E = ( 4 2 3 1 )
Tape drives
Plotters
Scanners
CD Roms
A = ( 2 1 0 0 )
Current allocation matrix
0
2
0
0
0
1
1
0
2
0
1
0
Request matrix
2
1
2
0
0
1
0
1
0
1
0
0
R =C =
Fig. 3-7. An example for the deadlock detection algorithm.
Plotter
Printer
Printer
Plotter
B
A
u (Both processes
finished)
pq
r
s
t
I
8
I
7
I
6
I
5
I
4
I
3
I
2
I
1
Fig. 3-8. Two process resource trajectories.
A
B
C
3
2
2
9
4
7
Free: 3
(a)
A
B
C
3
4
2
9
4
7
Free: 1
(b)
A
B
C
3
0 ––
2
9
7
Free: 5
(c)
A
B
C
3
0
7
9
7
Free: 0
(d)
–
A
B
C
3
0
0
9
–
Free: 7
(e)
Has Max Has Max Has Max Has Max Has Max
Fig. 3-9. Demonstration that the state in (a) is safe.
A
B
C
3
2
2
9
4
7
Free: 3
(a)
A
B
C
4
2
2
9
4
7
Free: 2
(b)
A
B
C
4
4 —4
2
9
7
Free: 0
(c)
A
B
C
4
—
2
9
7
Free: 4
(d)
Has Max Has Max Has Max Has Max
Fig. 3-10. Demonstration that the state in (b) is not safe.
A
B
C
D
0
0
0
0
6
Has Max
5
4
7
Free: 10
A
B
C
D
1
1
2
4
6
Has Max
5
4
7
Free: 2
A
B
C
D
1
2
2
4
6
Has Max
5
4
7
Free: 1
(a) (b) (c)
Fig. 3-11. Three resource allocation states: (a) Safe. (b) Safe.
(c) Unsafe.
Process
Tape drives
Plotters
A
B
C
D
E
3
0
1
1
0
0
1
1
1
0
1
0
1
0
0
1
0
0
1
0
E = (6342)
P = (5322)
A = (1020)
Resources assigned
Process
Tape drives
Plotters
A
B
C
D
E
1
0
3
0
2
1
1
1
0
1
0
1
0
1
1
0
2
0
0
0
Resources still needed
Scanners
CD ROMs
Scanners
CD ROMs
Fig. 3-12. The banker’s algorithm with multiple resources.
A
1. Imagesetter
2. Scanner
3. Plotter
4. Tape drive
5. CD Rom drive
i
B
j
(a) (b)
Fig. 3-13. (a) Numerically ordered resources. (b) A resource
graph.
Condition Approach
Mutual exclusion Spool everything
Hold and wait Request all resources initially
No preemption Take resources away
Circular wait Order resources numerically
Fig. 3-14. Summary of approaches to deadlock prevention.