A computer system consists of hardware, system programs, and application programs figs 7
Bạn đang xem bản rút gọn của tài liệu. Xem và tải ngay bản đầy đủ của tài liệu tại đây (612.1 KB, 26 trang )
7
MULTIMEDIA OPERATING SYSTEMS
7.1 INTRODUCTION TO MULTIMEDIA
7.2 MULTIMEDIA FILES
7.3 VIDEO COMPRESSION
7.4 MULTIMEDIA PROCESS SCHEDULING
7.5 MULTIMEDIA FILE SYSTEM PARADIGMS
7.6 FILE PLACEMENT
7.7 CACHING
7.8 DISK SCHEDULING FOR MULTIMEDIA
7.9 RESEARCH ON MULTIMEDIA
7.10 SUMMARY
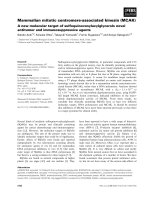
Distribution network
Distribution network
Fiber
Video server
Video server
Copper twisted pair
Junction box
Junction box
House
Cable TV coaxial cable
Fiber
(a)
(b)
Fig. 7-1. Video on demand using different local distribution tech-
nologies. (a) ADSL. (b) Cable TV.
Source Mbps GB/hr
Telephone (PCM) 0.064 0.03
MP3 music 0.14 0.06
Audio CD 1.4 0.62
MPEG-2 movie (640 × 480) 4 1.76
Digital camcorder (720 × 480) 25 11
Uncompressed TV (640 × 480) 221 97
Uncompressed HDTV (1280 × 720)648 288
Device Mbps
Fast Ethernet 100
EIDE disk 133
ATM OC-3 network 156
SCSI UltraWide disk 320
IEEE 1394 (FireWire) 400
Gigabit Ethernet 1000
SCSI Ultra-160 disk 1280
Fig. 7-2. Some data rates for multimedia and high-performance
I/O devices. Note that 1 Mbps is 10
6
bits/sec but 1 GB is 2
30
bytes.
1432 5678
Hello, Bob Hello, Alice Nice day Sure is How are you Great And you Good
Dag, Bob Dag, Alice Mooie dag Jazeker Hoe gaat het Prima En jij Goed
Video
English audio
French audio
German audio
English subtitles
Dutch subtitles
Fast forward
Fast backward
Frame
Fig. 7-3. A movie may consist of several files.
1.00
0.75
0.50
0.25
0
–0.25
–0.50
–0.75
–1.00
1
2
T
1
2
T
TTT
(a) (b) (c)
1
2
T
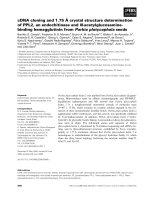
Fig. 7-4. (a) A sine wave. (b) Sampling the sine wave. (c) Quantiz-
ing the samples to 4 bits.
Scan line
1
3
5
7
9
11
13
15
483
Time
.
.
.
The next field
starts here
Scan line painted
on the screen
Horizontal
retrace
Vertical
retrace
Fig. 7-5. The scanning pattern used for NTSC video and televi-
sion.
480
640
(a) (b)
Q
RGB
YI
640
480
240
320
240
1 Block
Block 4799
8-Bit pixel
24-Bit pixel
Fig. 7-6. (a) RGB input data. (b) After block preparation.
Y/I/Q Amplitude
DCT
xFx
y
Fy
Fig. 7-7. (a) One block of the Y matrix. (b) The DCT coefficients.
150
92
52
12
4
2
1
0
80
75
38
8
3
2
1
0
40
36
26
6
2
1
0
0
14
10
8
4
0
1
0
0
4
6
7
2
0
0
0
0
2
1
4
1
0
0
0
0
1
0
0
0
0
0
0
0
0
0
0
0
0
0
0
0
DCT Coefficients
150
92
26
3
1
0
0
0
80
75
19
2
0
0
0
0
20
18
13
2
0
0
0
0
4
3
2
1
0
0
0
0
1
1
1
0
0
0
0
0
0
0
0
0
0
0
0
0
0
0
0
0
0
0
0
0
0
0
0
0
0
0
0
0
Quantized coefficients
1
1
2
4
8
16
32
64
1
1
2
4
8
16
32
64
2
2
2
4
8
16
32
64
4
4
4
4
8
16
32
64
8
8
8
8
8
16
32
64
16
16
16
16
16
16
32
64
32
32
32
32
32
32
32
64
64
64
64
64
64
64
64
64
Quantization table
Fig. 7-8. Computation of the quantized DCT coefficients.
150
92
26
3
1
0
0
0
80
75
19
2
0
0
0
0
20
18
13
2
0
0
0
0
4
3
2
1
0
0
0
0
1
1
1
0
0
0
0
0
0
0
0
0
0
0
0
0
0
0
0
0
0
0
0
0
0
0
0
0
0
0
0
0
Fig. 7-9. The order in which the quantized values are transmitted.
Fig. 7-10. Three consecutive video frames.
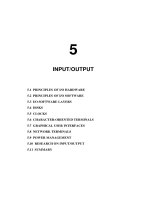
A1 A2 A3 A4 A5
B1 B2 B3 B4
Starting moment
for A1, B1, C1
Deadline
for A1
Deadline for B1
Deadline for C1
0 10 20 30 40 50 60 70 80 90 100 110 120 130 140
Time (msec)
A
B
C
C2
C3C1
Fig. 7-11. Three periodic processes, each displaying a movie. The
frame rates and processing requirements per frame are different
for each movie.
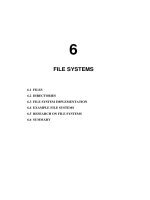
A1
A1
A1
B1
B1
A2
A2
A2
A3
A3 B3 A4
A3 B3 A4 A5 B4
A5 B4
A4 A5
B1 B2
B2
B2
B3 B4
0 10 20 30 40 50 60 70 80 90 100 110 120 130 140
Time (msec)
A
B
C
EDF
RMS
C1
C1
C1
C2
C2
C2
C3
C3
C3
Fig. 7-12. An example of RMS and EDF real-time scheduling.
A1
A1
B1
B1
A1
A2
B2 B3A3 A4 A5 B4
A5
B1 B2
B2
Failed
A2
B3 B4
0 10 20 30 40 50 60 70 80 90 100 110 120 130 140
Time (msec)
A
B
C
EDF
RMS
A2 A3 A4
C2
C3
C3
C1
C1 C2
Fig. 7-13. Another example of real-time scheduling with RMS and
EDF.
Video
server
Client
Request 1
Request 2
Block 1
Block 2
Request 3
Block 3
Time
(a)
Video
server
Client
Start
Block 1
Block 2
Block 3
Block 4
Block 5
(b)
Fig. 7-14. (a) A pull server. (b) A push server.
00 9000 18000 27000 36000 45000 54000 63000 72000 81000
8:00 8:05 8:10 8:15 8:20 8:25 8:30 8:35 8:40 8:45
1
0 9000 18000 27000 36000 45000 54000 63000 72000
02 9000 18000 27000 36000 45000 54000 63000
03 9000 18000 27000 36000 45000 54000
04 9000 18000 27000 36000 45000
05 9000 18000 27000 36000
06 9000 18000 27000
07 9000 18000
08 9000
09
Frame 9000 in
stream 3 is sent
at 8:20 min
Time
Stream
Fig. 7-15. Near video on demand has a new stream starting at reg-
ular intervals, in this example every 5 minutes (9000 frames).
300 60 90 120
Play point at 12 min
Play point at 75 min
Play point at 15 min
Play point at 16 min
Play point at 22 min
(a)
(b)
(c)
(d)
(e)
Minutes
Fig. 7-16. (a) Initial situation. (b) After a rewind to 12 min.
(c) After waiting 3 min. (d) After starting to refill the buffer.
(e) Buffer full.
Video A A A T T Video A A A T T Video A A A T T
Frame 3Frame 2Frame 1
Audio
track
Text
track
Fig. 7-17. Interleaving video, audio, and text in a single contigu-
ous file per movie.
Disk block larger
than frame
Audio
Text
I
I
Frame
Index
Disk block smaller
than frame
I
Block
Index
I
I
I
I
(a) (b)
I-frame
P-frame
Unused
Fig. 7-18. Noncontiguous movie storage. (a) Small disk blocks.
(b) Large disk blocks.
0 9000 18000 27000 36000 45000 54000 72000 81000 207000
63000
Stream
24
Stream
23
Stream
15
Stream
1
1 9001 18001 27001 36001 45001 54001 72001 81001 207001
63001
2 9002 18002 27002 36002 45002 54002 72002 81002 207002
63002
Frame 27002 (about 15 min into the movie)
Track 1
Track 2
Track 3
Order in which blocks are read from disk
Fig. 7-19. Optimal frame placement for near video on demand.
0.300
0.250
0.200
0.150
0.100
0.050
0
1234567891011121314151617181920
Rank
Frequency
Fig. 7-20. The curve gives Zipf’s law for N = 20. The squares
represent the populations of the 20 largest cities in the U.S., sorted
on rank order (New York is 1, Los Angeles is 2, Chicago is 3,
etc.).
Movie
10
Movie
8
Movie
6
Movie
4
Movie
2
Movie
1
Movie
3
Movie
5
Movie
7
Movie
9
Movie
11
Cylinder
Frequency of use
Fig. 7-21. The organ-pipe distribution of files on a video server
A0
A1
A2
A3
A4
A5
A6
A7
B0
B1
B2
B3
B4
B5
B6
B7
C0
C1
C2
C3
C4
C5
C6
C7
D0
D1
D2
D3
D4
D5
D6
D7
(a)
A0
A4
B0
B4
C0
C4
D0
D4
A1
A5
B1
B5
C1
C5
D1
D5
A2
A6
B2
B6
C2
C6
D2
D6
A3
A7
B3
B7
C3
C7
D3
D7
(b)
A0
A4
B3
B7
C2
C6
D1
D5
A1
A5
B0
B4
C3
C7
D2
D6
A2
A6
B1
B5
C0
C4
D3
D7
A3
A7
B2
B6
C1
C5
D0
D4
(c)
A0
A6
B3
B4
C0
C7
D1
D6
A2
A5
B1
B7
C2
C6
D2
D5
A1
A4
B2
B5
C3
C4
D3
D4
A3
A7
B0
B6
C1
C5
D0
D7
(d)
1234 1234
1234 1234
Disk
Fig. 7-22. Four ways of organizing multimedia files over multiple
disks. (a) No striping. (b) Same striping pattern for all files.
(c) Staggered striping. (d) Random striping.
10 sec 1 min 2 min 3 min 4 min
0
1
8
0
0
3
6
0
0
5
4
0
0
1
8
0
0
3
6
0
0
5
4
0
0
7
2
0
0
7
2
0
0
User 1
0
User 2
Starts
10 sec
later
Time
0
1
8
0
0
3
6
0
0
5
4
0
0
7
2
0
0
User 1
User 2
Runs faster
Normal speed
(a)
(b)
Runs slower Normal speed
5
4
0
0
7
2
0
0
1
8
0
0
3
6
0
0
0
Fig. 7-23. (a) Two users watching the same movie 10 sec out of
sync. (b) Merging the two streams into one.
1
701
2
92
3
281
4
130
5
326
6
410
7
160
8
466
9
204
10
524
92 130 160 204 281 326 410 466 524 701
Stream
Optimization algorithm
Order in which disk requests are processed
Buffer for odd frames
Buffer for even frames
Block requested
Fig. 7-24. In one round, each movie asks for one frame.