matlab graphics and data visualization cookbook
Bạn đang xem bản rút gọn của tài liệu. Xem và tải ngay bản đầy đủ của tài liệu tại đây (10.05 MB, 284 trang )
www.it-ebooks.info
MATLAB Graphics and
Data Visualization
Cookbook
Tell data stories with compelling graphics using this
collection of data visualization recipes
Nivedita Majumdar
Swapnonil Banerjee
BIRMINGHAM - MUMBAI
www.it-ebooks.info
MATLAB Graphics and Data Visualization
Cookbook
Copyright © 2012 Packt Publishing
All rights reserved. No part of this book may be reproduced, stored in a retrieval system, or
transmitted in any form or by any means, without the prior written permission of the publisher,
except in the case of brief quotations embedded in critical articles or reviews.
Every effort has been made in the preparation of this book to ensure the accuracy of the
information presented. However, the information contained in this book is sold without
warranty, either express or implied. Neither the authors, nor Packt Publishing, and its dealers
and distributors will be held liable for any damages caused or alleged to be caused directly or
indirectly by this book.
Packt Publishing has endeavored to provide trademark information about all of the companies
and products mentioned in this book by the appropriate use of capitals. However, Packt
Publishing cannot guarantee the accuracy of this information.
First published: November 2012
Production Reference: 1191112
Published by Packt Publishing Ltd.
Livery Place
35 Livery Street
Birmingham B3 2PB, UK.
ISBN 978-1-84969-316-5
www.packtpub.com
Cover Image by Asher Wishkerman ()
www.it-ebooks.info
Credits
Authors
Nivedita Majumdar
Swapnonil Banerjee
Reviewers
Dr. John Bemis
Adee Ran
Ashish Uthama
David Woo
Acquisition Editor
Joanna Finchen
Lead Technical Editor
Kedar Bhat
Technical Editors
Dipesh Panchal
Copy Editor
Alda Paiva
Project Coordinator
Yashodhan Dere
Proofreader
Stephen Swaney
Indexer
Rekha Nair
Graphics
Valentina D'silva
Production Coordinator
Arvindkumar Gupta
Cover Work
Arvindkumar Gupta
www.it-ebooks.info
About the Authors
Nivedita Majumdar is a software development engineer with extensive experience with
MATLAB. She has a PhD in Computational Sciences and Informatics. She has been developing
data analysis tools and algorithms for the communications and life sciences industries
for the past decade. She is deeply interested in visualization as a tool for insightful data
exploration. She is an enthusiastic proponent of MATLAB as the preferred environment for
data visualization and algorithm prototyping.
Swapnonil Banerjee is a theoretical physicist with a PhD in Physics and a Bachelors
degree in Electronics and Telecommunications Engineering. He has extensive MATLAB
development experience in the areas of signal processing, numerical data modeling, curve
tting, differential calculus, and Monte Carlo simulations.
www.it-ebooks.info
Acknowledgement
We gratefully acknowledge the support of several individuals and organizations in developing
this book.
We would like to begin with a special thanks to David Woo for being constantly encouraging
and providing valuable, actionable ideas for the book.
We are grateful to our family and friends for their love and the pride they take in our work.
It has been very nice to have the enthusiasm of Shuman Majumdar on our behalf.
We would like to thank our reviewers John Bemis, Adee Ran, Ashish Uthama, and David Woo
for patiently providing detailed critique of our work and great suggestions for improvement.
Importantly, we would like to thank Yashodhan Dere, Kedar Bhat, Dipesh Panchal, Joanna
Finchen, and the rest of the team at Packt for being supportive throughout this project.
We would like to thank MathWorks
TM
for their book program that made software licenses
available to us. We are grateful for their well maintained MATLAB Central File Exchange
program that showcases the work of so many in the MATLAB community whose contributions
we were able to build upon.
We would like to thank the University of California, Irvine and Stanford University for
maintaining great public use data repositories that we were able to leverage.
Finally, we would like to thank Daniel B Carr, professor at George Mason University, who
introduced us to the subject of data visualization.
www.it-ebooks.info
About the Reviewers
Dr. John Bemis is a senior manager at Baker Hughes, Inc. John holds a BA degree in
Chemistry from Grinnell College and a PhD in Inorganic Chemistry from the University of
Wisconsin. John has 16 years of professional software development experience starting at
TecMag Inc., designing and implementing user interfaces for magnetic resonance instrument
data acquisition and control. He has spent the last 12 years at Baker Hughes, Inc., rst
developing MATLAB based data analysis software for magnetic resonance applications, and
most recently as manager of the software technical project engineers for the Drilling and
Evaluation Technology division.
Adee Ran received a BS degree in Electrical Engineering in 1991 and an MS degree in
Electrical Engineering in 2000, both from the Israel Institute of Technology (Technion). He is a
physical-layer communication systems architect at Intel's Israel Design Center in Haifa, Israel.
He is also an active member of the IEEE 802.3 Ethernet Working Group and a devoted user
and programmer of MATLAB ever since the days of Version 3.5.
Ashish Uthama is a developer in the Image Processing Toolbox team at MathWorks,
makers of MATLAB. He has a Bachelor's degree in Electronics and Communication from PESIT,
Bangalore, India and a Master's degree in Applied Science from UBC, Vancouver, Canada.
www.it-ebooks.info
David Woo manages a team of algorithm developers in the Genetic Analysis R&D division
at Life Technologies where data analysis and visualization are an important part of everyday
work. He has a Master's degree in Electrical Engineering and 12 years of experience
developing biotechnology instrumentation including DNA sequencers and real-time PCR
thermal cyclers. He holds several patents in this area. In particular, he and his team focus on
the data transformation from the time series images of biochemical reactions that produce
uorescence to biologically meaningful DNA base calls and gene quantication. Bridging the
gap between engineering and biology is challenging, but ultimately rewarding, as the results
improve health care and push the understanding of molecular biology. DNA sequencing has
grown immensely since the completion of the rst human genome, and genetic testing is
rapidly becoming an indispensible tool to doctors, but as the volume of data increases, so
does the need for data analysis and visualization.
www.it-ebooks.info
www.PacktPub.com
Support les, eBooks, discount offers and more
You might want to visit www.PacktPub.com for support les and downloads related to
your book.
Did you know that Packt offers eBook versions of every book published, with PDF and ePub
les available? You can upgrade to the eBook version at
www.PacktPub.com and as a print
book customer, you are entitled to a discount on the eBook copy. Get in touch with us at
for more details.
At
www.PacktPub.com, you can also read a collection of free technical articles, sign up
for a range of free newsletters and receive exclusive discounts and offers on Packt books
and eBooks.
Do you need instant solutions to your IT questions? PacktLib is Packt's online digital book
library. Here, you can access, read and search across Packt's entire library of books.
Why Subscribe?
f Fully searchable across every book published by Packt
f Copy and paste, print and bookmark content
f On demand and accessible via web browser
Free Access for Packt account holders
If you have an account with Packt at www.PacktPub.com, you can use this to access
PacktLib today and view nine entirely free books. Simply use your login credentials for
immediate access.
www.it-ebooks.info
Table of Contents
Preface 1
Chapter 1: Customizing Elements of MATLAB Graphics—the Basics 7
Introduction 7
Making your rst MATLAB plot 10
Laying out long tick labels without overwriting 14
Using annotations pinned to the axes 18
Tufte style gridding for readability 22
Bringing order to chaos with legends 28
Visualizing details with data transformations 34
Designing multigraph layouts 37
A visualization to compare algorithm test results 44
Chapter 2: Diving into One-dimensional Data Displays 49
Introduction 50
Pie charts, stem plots, and stairs plots 50
Box plots 54
Sparklines 59
Stacked line graphs 63
Node link plots 66
Calendar heat map 71
Distributional data analysis 74
Time series analysis 79
Chapter 3: Graduating to Two-dimensional Data Displays 87
Introduction 88
Two-dimensional scatter plots 88
Scatter plot smoothing 92
Bidirectional error bars 95
2D node link plots 97
www.it-ebooks.info
ii
Table of Contents
Dendrograms and clustergrams 100
Contour plots 103
Gridding scattered data 107
Choropleth maps 111
Thematic maps with symbols 114
Flow maps 117
Chapter 4: Customizing Elements of MATLAB Graphics—Advanced 123
Introduction 123
Transparency 123
Lighting 128
View control 135
Interaction between light, transparency, and view 138
Chapter 5: Playing in the Big Leagues with Three-dimensional
Data Displays 143
Introduction 143
3D scatter plots 144
Slice (cross-sectional views) 148
Isosurface, isonormals, isocaps 156
Stream slice 160
Stream lines, ribbons, tubes 162
Scalar and vector data with a combination of techniques 166
Explore with camera motion 170
Chapter 6: Designing for Higher Data Dimensions 175
Introduction 176
Fusing hyperspectral data 176
Survey plots 180
Glyphs 186
Parallel coordinates 192
Tree maps 195
Andrews' curves 197
Downsampling for fast graphs 199
Principal Component Analysis 202
Radial Coordinate Visualization 206
Chapter 7: Creating Interactive Graphics and Animation 209
Introduction 209
Callback functions 210
Obtaining user input from the graph 216
Linked axes and data brushing 220
www.it-ebooks.info
iii
Table of Contents
The magnifying glass demo 226
Animation with playback of frame captures 231
Stream particle animation 233
Animation by incremental changes to chart elements 236
Chapter 8: Finalizing Graphics for Publication and Presentations 243
Introduction 243
Export formats and resolution 244
Vector graphics for inclusion into documents 247
Preserving onscreen font size and aspect ratios 250
Publishing code and graphics to a webpage 253
Appendix: References 259
Index 261
www.it-ebooks.info
www.it-ebooks.info
Preface
MATLAB Graphics and Data Visualization is a cookbook with recipes providing a menu of
graphs to rapidly identify the type of plot appropriate for your data. The step-by-step recipe
style allows applying the techniques to your data within a short time. Several attractive
customizations are provided as functions that can be easily integrated into your data analysis
workow. The hand created indexing into the recipes makes navigation through the book
simple and powerful to quickly locate what you need. The book approaches the topic of
visualization using data dimensionality and complexity as the central themes to organize
the techniques.
What this book covers
Chapter 1, Customizing Elements of MATLAB Graphics—the Basics, introduces how to
work with MATLAB handle graphics technology to customize graphs built in MATLAB.
It covers recipes showing how to change basic graph elements such as layout, gridding,
labels, and legends. It also forays into the use of color for depicting information.
Chapter 2, Diving into One-dimensional Data Displays, takes a tour of options available for
one-dimensional data visualizations, beginning with common chart types such as line plots,
bar plots, scatter plots, pie charts, stem plots, and stair plots. Further recipes cover box plots
and specialized designs such as sparklines, stacked line graphs, and node link plots. A recipe
is devoted to the use of heat maps for presenting daily data directly on a calendar. Final recipes
point to analysis approaches such as distributional data analysis and time series data analysis,
which may require specialized plots for visualizing the results.
Chapter 3, Graduating to Two-dimensional Data Displays, takes a tour of options available
for two-dimensional data visualizations, beginning with common chart types, such as scatter
plots, and options for scatter plot smoothing. Further recipes cover designs such as 2D node
link plots, dendrograms, and clustergrams. Further recipes cover contour plots. A recipe is
devoted to deal with data collected on non-uniform grids. Further recipes cover specialized
graphics for presenting data on maps with choropleth maps, thematic maps with symbols,
and ow maps.
www.it-ebooks.info
Preface
2
Chapter 4, Customizing Elements of MATLAB Graphics—Advanced, introduces advanced
features you can customize for graphics built with MATLAB, namely transparency, lighting,
and view control.
Chapter 5, Playing in the Big Leagues with Three-dimensional Data Displays, takes a tour
of options available for three-dimensional data visualizations with emphasis on volumetric
data. It begins with 3D scatter plots. Further recipes cover designs using slices, isosurfaces,
isonormals, and isocaps for scalar data visualization. Further recipes cover use of stream
slices and various options for depicting direction using lines, ribbons, or tubes for vector data
visualization. Several recipes pool the basic 3D techniques with lighting and view control
mechanisms to create effective ways for 3D data exploration.
Chapter 6, Designing for Higher Data Dimensions, takes a tour of visualization options
for higher data dimensions. Recipes cover the use of glyphs and parallel coordinates to
demonstrate how to represent multiple dimensions in 2D. Further recipes show how to code
the extra dimensions among available graphical features to achieve the same objective.
Additional recipes show how to transform the data using techniques such as the principal
component analysis or radial coordinate projections such that the key data dimensions that
allow discrimination between them can be brought into focus.
Chapter 7, Creating Interactive Graphics and Animation, showcases MATLAB's capabilities of
creating interactive graphics and animations. Recipes cover the essentials of programming
callback functionality to add custom behavior to user interactions. Further recipes cover ways
to obtain user input directly from the graph, including exploratory techniques such as data
brushing and linking. Other recipes cover how to animate a sequence of frames, or use erase
and redraw strategies to create animation effects.
Chapter 8, Finalizing Graphics for Publication and Presentations, covers options to adjust the
image quality and formatting requirements for different presentation goals, including tips to
keep in mind while designing graphics for presentation or publication in either hard copy or
electronic formats.
Appendix, References, provides supplementary material.
What you need for this book
A basic MATLAB installation will be required. The code was developed using MATLAB R2012a.
One recipe needs the Image Processing Toolbox
TM
. Several recipes require the Statistics
Toolbox
TM
. A couple of recipes make references to the Statistical Toolbox
TM
, the Mapping
Toolbox
TM
, and the Bioinformatics Toolbox
TM
(however, a fallback implementation is provided
in these cases so that you can use these recipes independent of these toolboxes).
www.it-ebooks.info
Preface
3
Who this book is for
The book is targeted for practitioners in the academia and industry interested in either
presenting the results of their specic analysis or doing exploratory data visualization. The
data itself could come from any source, and the options to import the data into MATLAB are
discussed in the book. A basic familiarity with MATLAB programming is assumed. However,
advanced MATLAB experience is not needed. The recipes are detailed and broken into simple
steps. It is intended as a handbook for creating compelling graphics that one can easily apply
to new data. Several attractive options for customizations are made available as functions
that can be easily integrated into any data analysis workow.
Conventions
In this book, you will nd a number of styles of text that distinguish between different kinds of
information. Here are some examples of these styles, and an explanation of their meaning.
Code words in text are shown as follows: "The command xlsread allows you to read the
numeric columns into the variable numericData, and the alphanumeric columns into the
variable headerLabels."
A block of code is set as follows:
plot(x,y1);
line([mean1 mean1],get(gca,'ylim'));
New terms and important words are shown in bold. Words that you see on the screen, in
menus or dialog boxes for example, appear in the text like this: "Click on the drop-down arrow
next to the publish icon on the toolbar to access the Edit Publish Congurations for option."
Warnings or important notes appear in a box like this.
Reader feedback
Feedback from our readers is always welcome. Let us know what you think about this
book—what you liked or may have disliked. Reader feedback is important for us to develop
titles that you really get the most out of.
To send us general feedback, simply send an e-mail to , and
mention the book title via the subject of your message.
www.it-ebooks.info
Preface
4
If there is a book that you need and would like to see us publish, please send us a note in the
SUGGEST A TITLE form on www.packtpub.com or e-mail
If there is a topic that you have expertise in and you are interested in either writing or
contributing to a book, see our author guide on
www.packtpub.com/authors.
Customer support
Now that you are the proud owner of a Packt book, we have a number of things to help you to
get the most from your purchase.
Downloading the example code
You can download the example code les for all Packt books you have purchased from your
account at . If you purchased this book elsewhere, you can
visit and register to have the les e-mailed directly
to you.
Downloading the color images of this book
We also provide you a PDF le that has color images of the screenshots used in this book. The
color images will help you better understand the changes in the output. You can download this
le from />MATLAB_Graphics_and_Data_Visualization_Cookbook.pdf
Errata
Although we have taken every care to ensure the accuracy of our content, mistakes do happen.
If you nd a mistake in one of our books—maybe a mistake in the text or the code—we would be
grateful if you would report this to us. By doing so, you can save other readers from frustration
and help us improve subsequent versions of this book. If you nd any errata, please report them
by visiting selecting your book, clicking on the errata
submission form link, and entering the details of your errata. Once your errata are veried, your
submission will be accepted and the errata will be uploaded on our website, or added to any
list of existing errata, under the Errata section of that title. Any existing errata can be viewed by
selecting your title from />Piracy
Piracy of copyright material on the Internet is an ongoing problem across all media. At Packt,
we take the protection of our copyright and licenses very seriously. If you come across any
illegal copies of our works, in any form, on the Internet, please provide us with the location
address or website name immediately so that we can pursue a remedy.
www.it-ebooks.info
Preface
5
Please contact us at with a link to the suspected pirated material.
We appreciate your help in protecting our authors, and our ability to bring you valuable content.
Questions
You can contact us at if you are having a problem with any
aspect of the book, and we will do our best to address it.
www.it-ebooks.info
www.it-ebooks.info
1
Customizing Elements
of MATLAB Graphics—
the Basics
In this chapter, we will cover:
f Making your rst MATLAB plot
f Laying out long tick labels without overwriting
f Using annotations pinned to the axes
f Tufte style gridding for readability
f Bringing order to chaos with legends
f Visualizing details with data transformations
f Designing multigraph layouts
f A visualization to compare algorithm test results
Introduction
MATLAB provides a rich and accessible environment for building data displays using
MATLAB graphics objects. Each graphics object has a set of characteristics you can
manipulate via their property settings. While each property has a default factory setting,
you can set user-dened values for these properties by accessing them programmatically,
via their unique identier called a handle; or interactively, via the property editor. This is
the fundamental way for customizing MATLAB graphics.
www.it-ebooks.info
Customizing Elements of MATLAB Graphics—the Basics
8
The different types of graphics objects may be hierarchically related. For example, a plot
element such as a line needs an axes object to act as a frame of reference. The axes object
needs the gure graphics object to hold it. Sometimes, it is possible to affect the property
settings of a whole group of graphics objects using a single command, depending on the
nature of their inter-relation. The recipes in this chapter show some of the commonly used
customizations using handle graphics manipulation, applicable to all types of MATLAB plotting.
See MATLAB Product pages on Handle Graphics Objects for a complete exposition of the
handle graphics technology.
Programmatic manipulation of graphics object
properties
All plotting-related MATLAB commands implicitly create the gure and axes graphics objects
and direct their output to the most recent gure and its most recent child axes object.
Explicitly, you can use the command figure at the MATLAB console to launch a new MATLAB
gure window; and the command axes to create a new axes object. You can create multiple
axes objects on the same gure. Each axes object will be children of the parent gure object.
Data is plotted onto the axes object with current focus. The current gure handle can be
accessed by the command get current figure or gcf. The handle to the current axes
can be accessed by the command get current axes or gca.
get (and set) commands apply to all MATLAB graphics objects and will allow to query
(and dene) their user-settable attributes as follows:
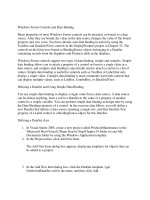
Select the Plot Edit button (the fth button in the gure toolbar) to get into the plot edit
mode. Then, select any object on the current gure (gure or axes or annotation objects).
This becomes your graphic object with current focus. Run get(gco) at the console to see
the complete list of user-denable attributes and their default settings for the graphic object in
current focus. Use the get and set commands to alter their default values programmatically,
as follows:
get(gco,'Property Name');
set(gco,'property Name',value);
The Plot Edit button is circled in the following screenshot:
www.it-ebooks.info
Chapter 1
9
Altering graphics object properties via the
Property Editor
An alternate way to change the gure and axes property values (and property values of other
MATLAB graphic objects) is by means of the MATLAB Property Editor. Opening up the detailed
property editor window will list every attribute that can be customized for the type of graphics
object you are using.
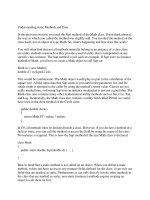
The steps to use the gure property editor wizard are shown in the following screenshot: Edit |
Figure Properties | More Properties bring up the Property Inspector Table where the entries
can be directly altered. See Axes Properties and Current Object Properties in the drop-down
options under the Edit menu item for the complete list of user-denable attributes.
The following screenshot shows steps to interact with the Property Editor for reviewing
attributes available for customization for any MATLAB graphics object:
www.it-ebooks.info
Customizing Elements of MATLAB Graphics—the Basics
10
You can access the property editor for other graphics objects you may be using by selecting
the object in plot edit mode, right-clicking on the object, and selecting Show Property Editor.
Once the appropriate parameters and their desired settings are identied using the
Property Editor, the user can make a command line statement to set those properties
to the new values and thus repeat the customizations every time the same graph is
generated, programmatically.
Making your rst MATLAB plot
This recipe takes you through the basic commands for creating a plot using MATLAB. It
demonstrates how to import data from an Excel spreadsheet, how to create a basic plot
with it, and how to add basic annotations. It will also teach how to add a linear least squares
t to the data. It will show how you locate the handle to this line object you created, and how
to change some of its properties to impact your visualization.
Getting ready
The le TemperatureXL.xls is part of the code repository accompanying this book. This
spreadsheet has two columns of numeric data with alphanumeric headers in the rst row.
The rst step is to import the data into the MATLAB workspace with the xlsread command:
[numericData headerLabels]=xlsread('TemperatureXL.xls');
How to do it
Perform the following steps:
1. Plot the data. (Sort the data before plotting if order is not important. Sorting helps to
easily assess trends in the data or lack of it.)
[sortedResults I] = sort(numericData(:,1));
plot(numericData(I,1), numericData(I,2),'.');
2. Label the x and y axis:
xlabel(['Independent Variable: ' headerLabels{1}]);
ylabel(['Dependent Variable: ' headerLabels{2}]);
3. Add a title:
title('Scatter plot view of sorted data');
www.it-ebooks.info
Chapter 1
11
The output at this point should be as follows:
4. Estimate the trend (using a linear least squares t):
p = polyfit(numericData(I,1),numericData(I,2),1);
y = polyval(p,numericData(I,1));
5. Overlay the trend line from step 4 on the current axes using a dashed line style.
You can also specify the color of the line as part of the linespec denition.
hold on;
plot(numericData(I,1),y,'r ');
6. Add a legend:
legend({'Data','Fit'},'Location','NorthWest');
www.it-ebooks.info
Customizing Elements of MATLAB Graphics—the Basics
12
The output at this point should be as follows:
7. Locate the trend line based on the color you set for it. Change the line style to
continuous instead of dashed. In this step, you should specify the color of the line
with a three element vector of actual RGB values.
set(findobj(gca,'Color',[1 0 0]),
'Linestyle','-','Linewidth',1.5);
The effect of step 7 is as follows:
www.it-ebooks.info