controlled synthesis of α fe2o3 nanorods and its size dependent optical
Bạn đang xem bản rút gọn của tài liệu. Xem và tải ngay bản đầy đủ của tài liệu tại đây (893.01 KB, 9 trang )
Journal of Colloid and Interface Science 312 (2007) 513–521
www.elsevier.com/locate/jcis
Controlled synthesis of α-Fe
2
O
3
nanorods and its size-dependent optical
absorption, electrochemical, and magnetic properties
Suyuan Zeng
a,b
, Kaibin Tang
a,b,∗
, Tanwei Li
a
a
Nanomaterial and Nanochemistry, Hefei National Laboratory for Physical Sciences at Microscale, University of Science and Technology of China,
Hefei, Anhui 230026, People’s Republic of China
b
Department of Chemistry, University of Science and Technology of China, Hefei, Anhui 230026, People’s Republic of China
Received 19 December 2006; accepted 21 March 2007
Available online 10 May 2007
Abstract
Uniform α-Fe
2
O
3
nanorods with diameter of about 30 nm and length up to 500 nm were synthesized by a template-free hydrothermal method
and a following calcination of the intermediate product in the air at 500
◦
C for 2 h. By carefully tuning the concentration of the reactants, a series of
α-Fe
2
O
3
nanorods with gradient in aspect ratios can be obtained. The effect of the solvent was also evaluated. Based on the experimental facts, the
formation mechanism of this one-dimensional structure was proposed. The size-dependent properties of the as-obtained α-Fe
2
O
3
nanorods were
investigated. The optical absorption properties of the samples showed that the band gaps of the samples decreased in the sequence in which the
size increased. The electrochemical performance of the samples showed that the discharge capacity decreased as the size of the sample increased,
which may result from the high surface area and small size. The magnetic hysteresis measurements taken at 5 K showed that the coercivities of the
samples were related to the aspect ratios of the samples, which may result from the larger shape anisotropy. However, the temperature-dependent
field cooling magnetization showed that there was no Morin transition in the as-prepared samples, which may result from the surface effect.
© 2007 Elsevier Inc. All rights reserved.
Keywords: Hematite; Hydrothermal; Size-dependent; Optical absorption; Lithium ion battery; Magnetism
1. Introduction
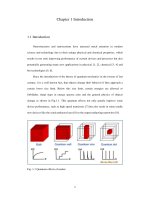
One-dimensional (1D) nanostructures, such as nanowires
(NWs), nanorods, and nanotubes (NTs), have attracted exten-
sive attention due to their unique physical and chemical prop-
erties [1–3]. These systems, with two restricted dimensions,
not only offer opportunities for investigating the dependence
of electronic transport as well as optical and mechanical prop-
erties on size confinement and dimensionality [4,5], but also
play a crucial role in fields such as data storage [6] and ad-
vanced catalytic and optoelectronic devices [2,7]. Developing
new methods for the preparation of nanomaterials as well as the
modification of their size, morphology, and porosity has been
intensively pursued not only for their fundamental scientific in-
terest but also for many technological applications.
*
Corresponding author. Fax: +86 551 360 1791.
E-mail address: (K. Tang).
Iron oxyhydroxides and iron oxides have been extensively
used in the production of pigments, catalysts, gas sensors, mag-
netic recording media, and raw materials for hard and soft mag-
nets [8–14]. Hematite (α-Fe
2
O
3
), based on hexagonal close
packing of oxygen with iron in 2/3 of the octahedral vacan-
cies, is traditionally used as catalyst, pigment, gas sensor, and
electrode material [15–18] due to its low cost, high resistance
to corrosion, and environmentally friendly properties. Most of
these functions depend strongly on the composition and struc-
ture of materials. In recent years, the synthesis and properties
of the one-dimensional α-Fe
2
O
3
nanostructures have attracted
much interest; many one-dimensional α-Fe
2
O
3
nanostructure
such as nanorods [19–21], nanowires [22–24], nanobelts [25],
and nanotubes [26,27] have been synthesized and used for
the investigation of their properties. For example, by oxidiz-
ing the surface of the iron substrate, α-Fe
2
O
3
nanowires were
obtained [22]. α-Fe
2
O
3
nanowires were also prepared by an an-
odic aluminum oxide (AAO) template method [28]. Recently,
α-Fe
2
O
3
nanotubes and nanorods were selectively synthesized
0021-9797/$ – see front matter © 2007 Elsevier Inc. All rights reserved.
doi:10.1016/j.jcis.2007.03.046
514 S. Zeng et al. / Journal of Colloid and Interface Science 312 (2007) 513–521
through a hydrothermal method using Span80 or L113B as
a soft template, and magnetic measurements showed that the
magnetic properties were shape-dependent [29]. Xie’s group
had also synthesized α-Fe
2
O
3
nanorods with gradients in size
and porosity, and the results showed that properties such as the
magnetic properties and the electrochemical properties were
size-dependent [30]. Nevertheless, it still remains a challenge
to develop simple and versatile approaches to synthesize 1D
nanostructures of α-Fe
2
O
3
that are easily tunable in size, which
will then facilitate our understanding of the shape and size-
dependent properties of α-Fe
2
O
3
.
In this paper, we propose an easy route for fabricating α-
FeOOH nanorods via a low-temperature hydrothermal method.
The α-FeOOH nanorods could be obtained with high yield
(>90%) and good reproducibility. By changing the amount of
the reactants, a series of α-FeOOH nanorods with gradients in
aspect ratio can be obtained. α-Fe
2
O
3
nanorods can be obtained
by calcing the as-obtained α-FeOOH at 500
◦
C for 2 h at a heat-
ingrateof1
◦
C/min, preserving the same rodlike morphology.
The shape-dependent optical absorption, electrochemical, and
magnetic properties are investigated.
2. Experimental
2.1. Preparation of α-FeOOH and α-Fe
2
O
3
nanorods
All reagents were analytically pure and used without fur-
ther purification. In a typical experiment, 2 mmol FeSO
4
·7H
2
O
was added into 40 ml distilled water to form a homogeneous
solution. Then 2 mmol anhydrous Na
2
SO
3
was added to the
solution under vigorous magnetic stirring. A yellowish suspen-
sion appeared in the solution after several seconds, and the
amount of suspension increased with continuous stirring. After
being stirred for 20 min, the slurry was transferred into a 50-ml
Teflon-lined autoclave and maintained at 140
◦
C for 12 h. The
autoclave was then cooled to room temperature naturally. The
final yellow solid products were centrifuged and washed with
distilled water and absolute ethanol several times to ensure to-
tal removal of the inorganic ions and then dried at 60
◦
C under
vacuum for 4 h. The α-Fe
2
O
3
nanorods were obtained by heat-
ing the as-obtained α-FeOOH nanorods in air at 500
◦
Cfor2h
at a heating rate of 1
◦
C/min, preserving the same rodlike mor-
phology.
2.2. Sample characterizations
The samples of as-prepared α-FeOOH and α-Fe
2
O
3
nano-
structures were characterized by X-ray powder diffraction
(XRD) with a Philips X’Pert Pro Super diffractometer with
CuKα radiation (λ = 1.54178 Å). The transmission electron
microscopy (TEM) images and the selected area diffraction
(SAED) patterns for both α-FeOOH and α-Fe
2
O
3
were ob-
tained on a Hitachi Model H-800 instrument with a tungsten
filament at an accelerating voltage of 200 kV. The magnetic
properties of α-Fe
2
O
3
were measured using a vibrating sam-
ple magnetometer and a superconducting quantum interference
device. The BET tests were determined via a Micromeritics
ASAP-2000 nitrogen adsorption apparatus. The performance of
the α-Fe
2
O
3
as a cathode was evaluated using a Teflon cell with
a lithium metal anode. The cathode was a mixture of α-Fe
2
O
3
,
acetylene black, and poly(vinylidene fluoride) with a weight ra-
tio of 80/10/10. The electrolyte was 1 M LiPF
6
in a 1:1 mixture
of ethylene carbonate/diethyl carbonate, and the separator was
Celgard 2500. The cell was assembled in a glove box filled with
highly pure argon gas (O
2
and H
2
Olevels<5 ppm). A galvano-
static charge/discharge experiment was performed between 3.0
and 0.5 V at a current density of 0.2 mA cm
−2
. The ultraviolet
and visible spectra were recorded on a JGNA Specord 200 PC
UV–visible spectrophotometer. The magnetic measurements
were recorded on a SQUID magnetometer, Quantum Design
MPMS.
3. Results and discussion
Fig. 1a is the XRD pattern of the as-obtained FeOOH
nanorods, where all the diffraction peaks can be indexed as or-
thorhombic α-FeOOH with cell constants of a = 0.4592 nm,
b = 0.998 nm, and c = 0.3015 nm, which is consistent with
the reported data (JCPDS Card 81-0464). Fig. 1bistheXRD
pattern of the product obtained by calcining the as-prepared
α-FeOOH at 500
◦
C for 2 h, where all the diffraction peaks
can be indexed as a hexagonal phase with lattice constants of
a = 0.5013 nm and c = 1.3751 nm, which agrees well with the
literature (JCPDS Card 33-0664).
Fig. 2a is the field emission electron microscopy (FESEM)
image of the as-obtained α-FeOOH nanorods, which clearly
demonstrates that the products are composed of large amount
of nanorods. These rods, about 30 nm in diameter and length
up to 400 nm, have smooth surfaces along their entire length.
Fig. 2b is the transmission electron microscopy (TEM) image
of a single α-FeOOH nanorod. The selected area electron dif-
fraction (SAED) pattern of a single nanorod (inset of Fig. 2b)
demonstrates the single-crystal nature of the nanorod grown
along the [001] direction. Fig. 2c is the FESEM image of the
α-Fe
2
O
3
obtained by calcining the α-FeOOH at 500
◦
Cfor2h,
Fig. 1. XRD patterns of (a) as-prepared α-FeOOH nanorods; (b) α-Fe
2
O
3
nanorods obtained by calcing the α-FeOOH nanorods at 500
◦
Cfor2h.
S. Zeng et al. / Journal of Colloid and Interface Science 312 (2007) 513–521 515
Fig. 2. (a) FESEM image of the as-obtained α-FeOOH nanorods and (b) TEM image of a single α-FeOOH nanorod (inset: SAED pattern of a single α-FeOOH
nanorod); (c) FESEM image of the as-obtained α-Fe
2
O
3
nanorods; (d) TEM image of a single α-Fe
2
O
3
nanorod (inset: SAED pattern of a single α-Fe
2
O
3
nanorod).
from which we can see that the rodlike morphology perfectly
remained after calcination. The SAED pattern of a single α-
Fe
2
O
3
nanorod is also taken to verify the growth direction of
the α-Fe
2
O
3
(inset of Fig. 2d); and the result shows that the as-
obtained α-Fe
2
O
3
nanorod is a single crystal grown along the
[01−10] direction.
Theformationoftheα-FeOOH nanorods in the solution can
be expressed as follows:
SO
2−
3
+ H
2
O → HSO
−
3
+ OH
−
,(1)
4Fe
2+
+ 8OH
−
+ O
2
→ FeOOH + 2H
2
O. (2)
As shown above, Fe
2+
reacted with the OH
−
produced by
the hydrolysis of SO
2−
3
and O
2
in the atmosphere, producing the
yellow α-FeOOH suspension. When the SO
2−
3
hydrolyzed in
the water, the pH value of the solution rose uniformly, and this
prevented the occurrence of local supersaturation and mean-
while favored for homogeneous nucleation. However, as the
reaction went on, the pH value of the system decreased. And ac-
cording to the acid–base surface properties of the metal oxide,
decreasing the pH of the precipitation from the point of zero
charge (PZC) increases the surface charge density by adsorp-
tion of protons and consequently reduces the interfacial tension
of the system [31], which is very important for the formation of
such unique nanostructures.
To further understand the role that SO
2−
3
played in the
synthesis, several experiments involved different amount of
Na
2
SO
3
and other kind of inorganic ions were performed.
Keeping the amounts of FeSO
4
and water constant, the mo-
lar ratio between FeSO
4
and Na
2
SO
3
varied. Fig. 3aisthe
TEM image of the product obtained when the concentration of
SO
2−
3
is 0.025 mol L
−1
, which shows that nanorods with diam-
eter about 30 nm and length about 40 nm were obtained. As
the concentration of the SO
2−
3
increases, e.g., 0.075 mol L
−1
,
the product is mainly composed of nanorods with diameter of
about 30 nm and length up to 800 nm (Fig. 3b), showing that the
aspect ratio of the nanorods was tunable. However, as the con-
centration of SO
2−
3
increases further, e.g., 0.1 mol L
−1
, black
powders instead of the yellow product are obtained, which is
confirmed to be Fe
3
O
4
by the XRD. And this can be explained
by the reducing ability of the SO
2−
3
. Fig. 3c is the TEM im-
age of the as-obtained Fe
3
O
4
, from which it can be seen that
the product is composed of hexagonal nanodisks with average
size about 50 nm, which may provide a method for the prepa-
ration of Fe
3
O
4
nanodisks. To learn more about the role that
SO
2−
3
played in the formation of the one-dimensional structure,
a series of comparative experiments were performed. In the
case where no Na
2
SO
3
was added, urchin-like nanostructures
that was composed of nanoneedles formed (shown as Fig. 3d).
When Cl
−
is used instead of SO
2−
3
in the reaction, irregular
516 S. Zeng et al. / Journal of Colloid and Interface Science 312 (2007) 513–521
Fig. 3. TEM images of the products under different conditions: (a) prepared in the solution containing 0.05 mol L
−1
Fe
2+
and 0.025 mol L
−1
Na
2
SO
3
; (b) prepared
in the solution containing 0.05 mol L
−1
Fe
2+
and 0.075 mol L
−1
Na
2
SO
3
; (c) prepared in the solution containing 0.05 mol L
−1
Fe
2+
and 0.1 mol L
−1
Na
2
SO
3
;
(d) prepared in the solution containing 0.05 mol L
−1
Fe
2+
; (e) prepared in the solution containing 0.05 mol L
−1
Fe
2+
and 0.05 mol L
−1
NaCl; (f) prepared in the
solution containing 0.05 mol L
−1
Fe
2+
and0.05molL
−1
Na
3
PO
4
.
nanorods as well as nanoparticles obtained (shown as Fig. 3e),
whereas nanoplates obtained when PO
3−
4
is used instead of
SO
2−
3
(Fig. 3f).
It was believed that the solution method is based on surface
chemistry through changing the interfacial tension to control
the structure and morphology of the products [32]. And it has
been reported that by adjusting the interfacial tension of the
reaction system by ethanol, an α-FeOOH nanorod array can
be obtained in the solution [33]. Then what the result will be
when ethanol is added into this reaction system? To answer this
question, several experiments that employed mixed solutions of
ethanol and water instead of pure water were performed. Fig. 4a
is the TEM image of the product obtained when the solution
is composed of 5 ml ethanol and 35 ml H
2
O, from which it
can be seen that nanorods with higher aspect ratio are obtained.
With a further increase of the amount of ethanol to 10 ml, an
urchin-like nanostructure that is composed of nanorods formed
(Fig. 4b). When more ethanol is added, e.g., 20 and 30 ml, ir-
regular nanoparticles and nanorods are obtained (Figs. 4c and
4d), which may result from the relative higher concentration of
the reactant compared with that in the water, causing the reac-
tion to be kinetically controlled.
To investigate the growth mechanism of such rodlike struc-
tures, several experiments that involved intercepting the inter-
mediates at different hydrothermal reaction times were per-
formed. According to the results of these experiments, we be-
lieve that the nanorods formed through a RBG (rolling-broken-
growth) model, which has been reported in the synthesis of
MnO
2
3D nanostructures [34] and CdSe nanorods [35].Atthe
initial stage, a large number of plate structures were obtained
(as shown in Fig. 5a). The thin flakes tended to curl under
elevated temperature and pressure, as shown in Fig. 5b(after
heating for 40 min). As the reaction went on, some thin flakes
broke into small nanoneedles (Fig. 5d) via a rolling-broken-
growth (RGB) process. And finally, small nanoneedles would
grow into nanorods after heating for 12 h.
4. Size-dependent properties of the products
To investigate the size-dependent properties of the α-Fe
2
O
3
nanorods, several samples with gradient in the length have been
employed. They were synthesized using the method mentioned
above. They were labeled as S1, S2, and S3, respectively. The
sizes of the samples were listed in Table 1.
S. Zeng et al. / Journal of Colloid and Interface Science 312 (2007) 513–521 517
Fig. 4. TEM images of α-FeOOH obtained when the solution is composed of (a) 5 ml ethanol and 35 ml water; (b) 10 ml ethanol and 30 ml water; (c) 20 ml ethanol
and 20 ml water; (d) 30 ml ethanol and 10 ml water.
Fig. 5. TEM images of the α-FeOOH obtained after hydrothermal reaction for (a) 20 min; (b) 40 min; (c) 1 h; (d) 2 h.
Table 1
Names and sizes of the samples employed in the characterization
Sample Diameter (nm) Length (nm)
S1 20–30 40–50
S2 20–30 400–500
S3 30–40 700–800
4.1. Optical absorption properties
The optical absorption properties of samples S1, S2 and S3
were investigated at room temperature by the UV–vis spectra
(Fig. 6a). The absorption peaks showed blue shift as the lengths
of the nanorods decrease. α-Fe
2
O
3
is a n-type semiconductor
and its optical band gap can be obtained by the equation
(3)(αhν)
n
= B(hν − E
g
),
where α is the absorption coefficient, hν is the photo energy,
B is a constant relative to the material, E
g
is the band gap, and
n is either 1/2 for an indirect transition or 2 for a direct transi-
tion. The (αhν)
2
∼ hν curves for samples S1, S2, and S3 are
shown in Figs. 6b, 6c, and 6d, respectively. The band gaps cal-
culated from Eq. (3) are 2.65, 2.60, and 2.45 eV for S1, S2, and
S3, showing an obvious blue shift as the sizes decreased. Here,
compared to the reported value of bulk α-Fe
2
O
3
(2.2 eV) [36],
the optical absorption band edge of the as-obtained α-Fe
2
O
3
exhibits blue shift with respect to that of the bulk α-Fe
2
O
3
.
The blue shift could also be attributed to the size effect, which
leads to the broadening of the optical absorption edge. It is
well known that the semiconductor nanoparticle energy gap in-
creases with decrease of the grain size, which leads to a blue
shift of the optical absorption edge, and this has been observed
in many semiconductor nanoparticle systems [37–40]. Based
on the above considerations, the sequence of the as-obtained
products should be S1 > S2 > S3, which agrees well with our
experimental facts.
4.2. Electrochemical properties
It is reported that the lithium intercalation performance is
related to the intrinsic crystal structure, where the lithium ions
can intercalate into the interlayer, the tunnels, and the holes in
the crystal structure [41]. α-Fe
2
O
3
, based on hexagonal close
packing of oxygen with iron in 2/3 of the octahedral vacancies,
is reported [30] to have holes in the first octahedral layer pro-
jected along [001] and [100], which makes its use in lithium
ion batteries possible. Here, the electrochemical performance
of the as-prepared α-Fe
2
O
3
samples in the cell configuration
of Li/α-Fe
2
O
3
was evaluated. Fig. 7 shows the comparative
charge/discharge curves of the α-Fe
2
O
3
samples of S1–S3 in
the first cycle. The cutoff voltage of samples S1–S3 is about
0.6 V, which is similar to the nanorods [30] and nanoparti-
cles reported before [42]. The S1 electrode exhibits the highest
capacity, 1040 mA hg
−1
among the three samples. The capac-
ities of samples S2 and S3 are 1002 and 859 mA hg
−1
,re-
spectively. The first discharge capacity possesses the sequence
518 S. Zeng et al. / Journal of Colloid and Interface Science 312 (2007) 513–521
Fig. 6. (a) UV–vis spectra of samples S1–S3; (b), (c), (d) spectrum of samples S1, S2, and S3 obtained by using the energy as abscissa.
Fig. 7. First charge–discharge curves of α-Fe
2
O
3
samples (S1–S3) at a current density of 0.2 mA cm
−2
(S1: dashed lines; S2: dotted lines; S3: solid lines).
S1 > S2 > S3, which confirms the sequence in which the sizes
of the sample increase. The discharge capacities of the sam-
ples may be related to the size effect of the α-Fe
2
O
3
nanorods.
Considering the introduction of lithium ions into the holes of
the hematite surface, it is easy to find that the large surface
area is important for the improvement of lithium intercalation
performance. When the surface area is high, the lithium ion in-
tercalation capacity and affinity will be greatly enhanced, since
the diffusion lengths of the lithium ions are greatly shortened.
Then the one with the smallest size and with the highest surface
S. Zeng et al. / Journal of Colloid and Interface Science 312 (2007) 513–521 519
Fig. 8. FC curves for samples (a) S1, (b) S2, and (c) S3 from 300 to 5 K; hysteresis loop for samples (d) S1, (e) S2, and (f) S3 at 5 K.
area is the one that would have the highest discharge capac-
ity. Our deduction was further verified by the BET tests. The
BET tests show that the surface areas of the three samples were
35.577, 32.000, and 29.303 m
2
/g for samples S1, S2, and S3,
respectively, which conformed to the discharge capacities of the
three samples.
4.3. Magnetic properties
It is of great interest to investigate the magnetic properties of
α-Fe
2
O
3
with gradients in aspect ratios. Bulk α-Fe
2
O
3
, besides
the Néel temperature (T
N
= 960 K), has a first-order magnetic
transition at T
M
= 263 K, which is called the Morin transi-
tion. Below T
M
, the antiferromagnetically (AF) ordered spins
are oriented along the c-axis, whereas above T
M
, spins lie AF
in the basal plane of the crystal with a ferromagnetism compo-
nent. A sharp decrease in magnetization should be observed at
this transition, termed the Morin transition temperature (T
M
).
Figs. 8a–8c show the curves for the temperature dependence of
field-cooling (FC) magnetizations from 5 to 300 K, under an
applied field of 100 Oe. The insets are the corresponding differ-
ential FC curves. However, the magnetic behaviors for samples
S1–S3 were completely different, as shown in Figs. 8a–8c:the
FC plots show constant increase and no maximum down to 5 K.
520 S. Zeng et al. / Journal of Colloid and Interface Science 312 (2007) 513–521
And this abnormality had also been observed in the α-Fe
2
O
3
nanotubes [29] and mesoporous α-Fe
2
O
3
with disordered walls
[43], which has been attributed to the presence of small crys-
talline particles in a few regions of the sample. However, as for
the samples in our experiments, we believe that the surfaces of
nanorods may contribute to the absence of the Morin transition.
Regarding the absence of the Morin transition, the shape of the
M(T ) curve is not typical of an antiferromagnetic substance ei-
ther above or below the spin-reorientation (Morin) transition.
And a “dead” surface layer of PM spins (the thickness of the
layer increasing as the size of the rod decreases) makes it im-
possible to observe the intrinsic contribution (AF). A detailed
study is under way.
To further understand the magnetic behavior of the sam-
ples, magnetic hysteresis measurements of α-Fe
2
O
3
(samples
S1–S3) were carried out in an applied magnetic field at 5 K,
with the field sweeping from −10 to 10 kOe. No saturation
of the magnetization as a function of the field is observed up
to the maximum applied magnetic field in all cases. Figs. 8d,
8e, and 8f are the hysteresis loops of samples S1, S2, and S3
at 5 K. The coercivity forces of samples S1, S2, and S3 are
67, 146, and 584 Oe, respectively, indicative of soft magnets.
The remnant magnetizations of samples S1, S2, and S3 at 5
K are determined to be 0.00007, 0.0024, and 0.039 emu/g. It
is reported that the high coercivity may be associated with the
aspect ratio of α-Fe
2
O
3
[44], because shape anisotropy would
exert a tremendous effect on the magnetic properties. Symmet-
rically shaped nanoparticles, such as spheres, do not have any
net shape anisotropy. However, shuttle-like nanoparticles have
shape anisotropy in addition to crystalline anisotropy, which
will increase coercivity. α-Fe
2
O
3
nanoparticles with an aver-
age diameter of 3 nm were found to show a coercive force of
50 Oe at 5 K [30]. Enhanced anisotropy caused by the one-
dimensional structure induces large magnetic coercivity, where
the magnetic spins are preferentially aligned the long axis and
their reversal to the opposite direction requires higher energies
than for spheres [45]. For sample S1, whose shape is very close
to that of the spherical particles, the shape anisotropy is the low-
est among all three samples. As the aspect ratio increases, the
shape anisotropy increases. Based on the above considerations,
we believe that the sequence can be used to explain the phe-
nomena that we observed in samples S1–S3 at 5 K and at room
temperature.
5. Conclusions
An facile route for the preparation of α-Fe
2
O
3
nanorods with
a gradient in size was reported. By controlling the concentra-
tion of the reactants, the size of the sample can be controlled.
The nanorods, with diameters ranging from 20 to 50 nm and
lengths ranging from 50 to 800 nm, were uniform and in high
yield. A possible formation mechanism was proposed for this
one-dimensional structure. The size-dependent properties of the
samples were investigated. The optical absorption properties of
the samples showed that the band gaps of the sample decreased
as the size increased. The electrochemical performance of the
samples showed that the discharge capacity decreased as the
size of the sample increased, which may result from the high
surface area and small size. The magnetic hysteresis measure-
ments taken at 5 K showed that the coercivities of the samples
were related to the aspect ratios of the sample, which may result
from the larger shape anisotropy. However, the temperature-
dependent field cooling magnetization showed that there was
no Morin transition in the as-prepared samples, which may re-
sult from the surface effect.
Acknowledgments
Financial support by the National Natural Science Founda-
tion of China, the 973 Projects of China, and the Program for
New Century Excellent Talents in University (NCET) is grate-
fully acknowledged.
References
[1] S. Iijima, Nature 354 (1991) 56.
[2] X.F. Wang, C.M. Lieber, Nature 409 (2001) 66.
[3] E.C. Dickey, C.A. Crimes, M.K. Jain, K.G. Ong, D. Qian, P.D. Kicham-
bare, R. Andrews, D. Jacques, Appl. Phys. Lett. 79 (2001) 4022.
[4] M. Huang, S. Mao, H. Feick, H. Yan, Y. Wu, H. Kind, E. Weber, R. Russo,
P. Yang, Science 292 (2001) 1897.
[5] Y. Xia, P. Yang, Adv. Mater. 15 (2003) 351.
[6] Y.C. Kong, D.P. Yu, B. Zhang, W. Fang, S.Q. Feng, Appl. Phys. Lett. 78
(2001) 4.
[7] H. Kind, H. Yan, M. Law, B. Messer, P. Yang, Adv. Mater. 14 (2002) 158.
[8] C. Gong, D. Chen, X. Jiao, Q. Wang, J. Mater. Chem. 12 (2002) 1844.
[9] E. Matijevi
´
c, P. Scheiner, J. Colloid Interface Sci. 63 (1978) 509.
[10] M.P. Morales, T. González-Carreeño, C.J. Serna, J. Mater. Res. 7 (1992)
2538.
[11] B. Faust, M. Hoffmann, D. Bachnemann, J. Phys. Chem. 93 (1989) 6371.
[12] J. Kiwiand, M. Crätzel, Faraday Trans. 83 (1987) 1101.
[13] G. Neri, A. Bonavita, S. Galvagno, P. Siciliano, S. Capone, Sens. Actuat.
B 82 (2002) 40.
[14] K. Široký, J. Jirešová, L.O. Hudec, Thin Solid Films 245 (1994) 211.
[15] B.C. Faust, M.R. Hoffmann, D.W. Bahnemann, J. Phys. Chem. 93 (1989)
6371.
[16] R.M. Cornell, U. Schwertmann, The Iron Oxides. Structure, Properties,
Reactions, Occurrence and Uses, VCH, Weinheim, 1996, p. 464.
[17] J.S. Han, T. Bredow, D.E. Davey, A.B. Yu, D.E. Mulcahy, Sens. Actuat.
B 75 (2001) 18.
[18] J. Chen, L. Xu, W. Li, X. Gou, Adv. Mater. 17 (2005) 582.
[19] K. Woo, H.J. Lee, J.P. Ahn, Y.S. Park, Adv. Mater. 15 (2003) 1761.
[20] X. Wang, X. Chen, L. Gao, H. Zheng, M. Ji, C. Tang, T. Sen, Z. Zhang,
J. Mater. Chem. 14 (2004) 905.
[21] L. Vayssieres, N. Beermann, S E. Lindquist, A. Hagfeldt, Chem. Mater.
13 (2001) 233.
[22] Y.Y. Fu, R.M. Wang, J. Xu, J. Chen, Y. Yan, A.V. Narlikar, H. Zhang,
Chem. Phys. Lett. 379 (2003) 373.
[23] Y.J. Xiong, Z.Q. Li, X.X. Li, B. Hu, Y. Xie, Inorg. Chem. 43 (2004) 6540.
[24] R.M. Wang, Y.F. Chen, Y.Y. Fu, H. Zhang, C. Kisielowski, J. Phys. Chem.
B 109 (2005) 12245.
[25] X.G. Wen, S.H. Wang, Y. Ding, Z.L. Wang, S.H. Yang, J. Phys. Chem.
B 109 (2005) 215.
[26] C.J. Jia, L.D. Sun, Z.G. Yan, L.P. You, F. Luo, X.D. Han, Y.C. Pang,
Z. Zhang, C.H. Yan, Angew. Chem. Int. Ed. 44 (2005) 4328.
[27] Z.Y. Sun, H.Q. Yuan, Z.M. Liu, B.X. Han, X.R. Zhang, Adv. Mater. 17
(2005) 2993.
[28] J. Chen, L.N. Xu, W.Y. Li, X.L. Gou, Adv. Mater. 17 (2005) 582.
[29] L. Liu, H.Z. Kou, W.L. Mo, H.J. Liu, Y.Q. Wang, J. Phys. Chem. B 110
(2006) 15218.
[30] C.Z. Wu, P. Yin, X. Zhu, C.Z. Ouyang, Y. Xie, J. Phys. Chem. B 110
(2006) 17806.
S. Zeng et al. / Journal of Colloid and Interface Science 312 (2007) 513–521 521
[31] G.A. Parks, Chem. Rev. 65 (1965) 177.
[32] L. Vayssieres, K. Keis, S.E. Lindquist, A. Hagfeldt, J. Phys. Chem. B 105
(2001) 3350.
[33] H.F. Shao, X.F. Qian, J. Yin, Z.K. Zhu, J. Solid State Chem. 178 (2005)
3130.
[34] C.Z. Wu, Y. Xie, D. Wang, J. Yang, T.W. Li, J. Phys. Chem. B 107 (2003)
13583.
[35] J. Yang, J.H. Zeng, S.H. Yu, L. Yang, G.E. Zhou, Y.T. Qian, Chem. Mater.
12 (2000) 3059.
[36] H. Miyoshi, H. Yoneyama, J. Chem. Soc. Faraday Trans. 85 (1989) 1873.
[37] T. Abe, Y. Tachibana, T. Uematsu, M. Iwamoto, J. Chem. Soc. Chem.
Commun. (1995) 1617.
[38] A.D. Yoffe, Adv. Phys. 42 (1993) 173.
[39] C. Cormann, D.W. Bahnemann, M.R. Hoffmann, J. Phys. Chem. 92 (1988)
5196.
[40] F. Bentivegna, M. Nyvlt, J. Ferre, J.P. Jamet, A. Brun, S. Visnovsky,
R. Urban, J. Appl. Phys. 85 (1999) 2270.
[41] Y. Wang, K. Takahashi, H. Shang, G. Cao, J. Phys. Chem. B 109 (2005)
3085.
[42] H. Orimoto, S.I. Tobishima, Y. Iizuka, J. Power Sources 146 (2005) 315.
[43] F. Jiao, A. Harrison, J.C. Jumas, A.V. Chadwick, W. Kockelmann, P.G.
Bruce, J. Am. Chem. Soc. 128 (2006) 5468.
[44] X.M. Liu, S.Y. Fu, H.M. Xiao, C.J. Huang, J. Solid State Chem. 178
(2005) 2798.
[45] W.S. Seo, H.H. Jo, K. Lee, B. Kim, S.J. Oh, T. Park, Angew. Chem. Int.
Ed. 43 (2004) 1115.