finitte difference time domain studies on optical transmission through planar
Bạn đang xem bản rút gọn của tài liệu. Xem và tải ngay bản đầy đủ của tài liệu tại đây (352.92 KB, 11 trang )
Finitte-Difference Time-Domain Studies on Optical Transmission through Planar
Nano-Apertures in a Metal Film
Eric X. JIN and Xianfan XU
Ã
School of Mechanical Engineering, Purdue University, West Lafayette, IN 47907, USA
(Received April 18, 2003; revised July 22, 2003; accepted October 8, 2003; published January 13, 2004)
The finite-difference time-domain (FDTD) method is employed to numerically study the transmission characteristics of an H-
shaped nano-aperture in a metal film in the optical frequency range. It is demonstrated that the fundamental TE
10
mode
concentrated in the gap between the two ridges of the H-shaped aperture provides a high transmission efficiency above unity
and the size of the gap determines the sub-wavelength resolution. Fabry–Perot-like resonance is observed. Localized surface
plasmon (LSP) is excited on the edges of the aperture in a silver film but has a negative effect on the signal contrast and field
concentration, while aluminum acts similar to an ideal conductor if the film thickness is several times larger than the finite
skin depth. In addition, it is shown that two other ridged apertures, C-shaped and bowtie-shaped apertures, can also be used to
achieve a sub-wavelength resolution in the near field with a transmission efficiency above unity and a high contrast.
[DOI: 10.1143/JJAP.43.407]
KEYWORDS: nano-aperture, ridged aperture, scanning near field optical microscopy (SNOM), finite-difference time-domain
(FDTD) method, high transmission efficiency
1. Introduction
Since it was first proposed by Synge
1)
in as early as 1928,
sub-wavelength apertures have been employed to obtain sub-
wavelength light spots. Th ese sub-wavelength light sources
have found their applications in scanning near field optical
microscopy (SNOM), and potentially for optical data
storage, nano-lithography, bio-chemical sensing, and many
other areas where super optical resolution is needed.
Although the resolution is only determined by the size of
sub-wavelength apertures and no longer limited by diffrac-
tion, the drawback of sub-wavelength apertures is somehow
inevitable according to the earlier theoretical work.
2–5)
In a
regular sub-wavelength apertures (circular or square), light
throughput is proportional to the fourth power of the
aperture size, thus large input powers are necessary for
signal generation. Recently, a number of novel designs of
planar nano-apertures
6–10)
have been reported to obtain the
nanoscale resolution and high power throughput simulta-
neously. One strategy is to take advantage of the enhance-
ment of localized surface plasmon (LSP) by introducing a
minute scatter in the center of a regular aperture.
6)
Another is
to design shapes of the aperture other than circular or square
to achieve high throughput.
7–10)
Results of numerical
simulations of a C-shaped aperture
7)
made in a perfect
conducting metal film is found to have an enhanced
performance of power throughput compared with a square
aperture. The mechanism of enhancement of power through-
put from C-shaped aperture is explained as the propagation
of the dominan t TE
10
mode, analogous to the ridged
waveguide in microwave engineering. A T-shaped aperture
8)
is proposed to provide continuous signal of readout data and
tracking error for near-field surface recording. Bowtie slot
antennas and regular apertures in gold and silver films are
compared at optical frequencies in terms of the field
response and the focused spot size.
9)
An I-shaped sub-
wavelength aperture
10)
in a thick silver screen is also
examined. The high-intensity emission and the ultra-small
spot size are explained
9,10)
as the result of the surface
plasmon excitation. All these works are conducted numeri-
cally using the finite-difference time-domain (FD TD) meth-
od.
11–13)
In addition to the apertures on a surface (planar
apertures), there is a larger amount of numerical work using
FDTD for analyzing the SNOM,
14–16)
for designing SNOM
probes, for examples, apertureless probes,
17)
double-tapered
optical fiber probes,
18)
and silicon dioxide atomic force
microscopy (AFM) probes,
19)
for investigating near-field
aperture solid immersion lens probes,
20,21)
and for designing
optical head for hybrid data recording.
22,23)
The focus of this work is on the apertures with a planar
structure. The C-shaped, bowtie-shaped (or bowtie slot
antenna), and I-shaped apertures mentioned above have one
feature in common, the small gap region formed by the ridge
or ridges, which is the key structure for providing the high
optical transmission efficiency and the sub-wavelength spot
size. In this work, we named them ridged apertures, and a
systematic study is conducted on optical transmission on
these apertures. In order to fully understand the optical
transmission properties of these ridged apertures, we select
the H-shaped (similar to I-shaped) aperture for detailed
theoretical and numerical analysis to take advantage of the
waveguide theory in microwave engineering. Other ridged
apertures are also studied and compared with the results of
the H-shaped apertures.
In the following text, the simulation model is presented
first. The cutoff property of the H-shaped aperture is then
studied by considering it as a short double-ridged waveguide
channel. By performing FDTD simulations, the full wave 3-
D electromagnetic fields inside and in the near-field regions
of the aperture are obtained to illustrate its optical trans-
mission characteristics. Ideal conductor is considered to
reveal some basic transmission characteristics of the H-
shaped aperture. For thin metal films, the modified Debye
model
12)
is used to simulate the behavior of real metal
(aluminum and silver). With the use of optical properties of
real metal, it is also possible to analyze the effect of surface
plasmon. Finally, three ridged apertures of different shapes,
H-shaped aperture (double-ridged), C-shaped aperture (sin-
gle-ridged), and bowtie-shaped aperture (gradually double-
Ã
To whom correspondence should be addressed.
E-mail address:
Japanese Journal of Applied Physics
Vol. 43, No. 1, 2004, pp. 407–417
#2004 The Japan Society of Applied Physics
407
ridged) are compared in terms of transmission efficiency,
field distribution, signal contrast, spot size, and shape. It
turns out that all three apertures can be used to achieve high
transmission efficiency as well as nanoscale resolution in a
wide optical frequency range. Light passes through these
apertures due to the key propagation TE
10
mode, which is
concentrated in the gap region of these apertures. The
nanoscale resolution can be obtaine d by defining the
smallest feature size, usually the gap between ridges, of
these apertures.
2. Simulation Model
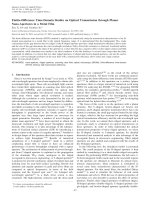
Figure 1 illustrates the cross-sectional views of the
structure of interest on xy and yz p lanes. An H-shaped
nanoscale aperture is perforated through a free-standing
metal film with a thickness of t. The uniform incident field
impinges on the metal film in the normal direction, with time
and distance variations described by e
ð j!tÀzÞ
.
The Maxwell’s differential equations for the light prop-
agation are:
rÂE þ
0
@H
@t
¼ 0 ð1aÞ
rÂH À
@D
@t
¼ 0 ð1bÞ
D ¼ ""
0
E ð1cÞ
Equation (1) is numerically solved with 3D-FDTD
method in a simulation volume of 1000 Â 1000 Â
1500 nm, which is divided into small cubes, the so called
Yee cells.
11)
The dimension of each cell is chosen to be
5 Â 5 Â 5 nm to resolve the near field below the aperture. A
second-order stabilized Liao
24)
absorbing boundary condi-
tion is used for the six sides of the simulation volume. The
electromagnetic fields are calculated in each cell by solving
the discretized Maxwell curl equations in both space and
time for each time step until the steady state is reached. In
the case of a sinusoidal source as used in this work, the
steady state is reached when all scattered fields vary
sinusoidally in time. A commercial code, XFDTD 5.3
25)
from Remcom, Inc. (State College, PA) is used for the
simulation. The time step is 9:63 Â 10
À18
s, which is
determined according to the stability criteria of the FDTD
algorithm. The total number of time step is 5000 to
sufficiently approach the steady sta te after monitoring the
fields at a point 100 nm below the aperture.
At optical frequencies, real metals, such as aluminum and
silver, have complex permittivities which are strongly
dependent on the exci tation frequency. In order to treat real
metals accurately, a modified Debye model
12)
is used to
describe the frequency dependence of the complex relative
permittivity, which is given by,
~
""ð!Þ¼"
/
þ
"
s
À "
/
1 þ i!
þ
i!"
0
ð2Þ
where "
s
represents the static permittivity, "
/
is the infinite
frequency permittivity which should be no less than 1, is
conductivity, and is the relaxation time. A trial and error
method is used to fit these parameters to the experimental
values of optical properties, i.e., the complex refractive
index. For example, with the experimental data for alumi-
num at the 488 nm wavelength,
26)
it is found that "
s
¼
À640:9549, "
/
¼ 1 :0799, ¼ 5:3424 Â 10
6
S/m, and ¼
1:0640 Â 10
À15
s. The values for silver at 488 nm
27)
are
"
s
¼À1313:5469, "
/
¼ 1:0220 , ¼ 3:7155 Â 10
6
S/m,
and ¼ 3:1326 Â 10
À15
s.
3. Results and Discussion
First, the cutoff properties of waveguides are studied in
order to understand the transmission efficiency and light
concentration of the H-shaped aperture. This will be
illustrated further by comparing results from FDTD simu-
lations to the results of regular apertures. In addition, the
electric dipole-liked behavior and transmission resonance of
the H-shape d aperture will be discussed. Surface plasmon
and finite skin depth effects will also be studied using real
metal properties described above. At last, results of three
ridged apertures of different aperture shapes will be
compared.
3.1 H-shaped aperture in an ideal conductor film
The H-shaped aperture channe l can be approximated as a
short double-ridged waveguide if an ideal conductor film is
considered and the aperture end effect is negligible. Here a
conductor film with thickness t ¼ 500 nm is considered
which is much larger than the skin depth of a metal.
Considering the incident excitation given in the last section,
the wave equation can be reduced to the Helmholtz
formulation,
28)
and the property of the wave inside the
waveguide is described by the propagation constant (¼ j,
where is phase constant). By introducing the cutoff
number k
c
, the wave propagation constant is completely
determined by
k
2
c
¼
2
þ k
2
or
2
¼
2
c
2
À
2
2
ð3Þ
For incident light with a wavelength shorter than the
cutoff wavelength
c
, it can propagate through the aperture
channel, as the phase constant is positive. The group
wavelength inside the channel is related to the phase
constant by
g
¼ 2=. The cutoff wavelength of
double-ridged waveguide for TE
m0
modes can be derived
using the transverse resonance method,
29)
which are the
eigenvalues of the following equation:
x
y
t
d
Metal film
Incident light
Transmitted ligh
t
x
y
a
b
s
d
H-shaped
aperture
k
z
(a) x
y
p
lane at z = 0 (b)
y
z
p
lane at x = 0
Fig. 1. Schematic view of an H-shaped nanoscale aperture channel in a
free-standing metal film. The normal incident light to be considered is
monochromatic and linearly polarized along the y-direction.
408 Jpn. J. Appl. Phys., Vol. 43, No. 1 (2004) E. X. J
IN and X. XU
À cot
ða À sÞ
c
þ
b
d
tan
s
c
þ 2
b
c
ln cosec
d
2b
¼ 0
ð4Þ
where a, b, d , and s are the dimensions of a double-ridged
waveguide shown in Fig. 1. Due to the ideal conductor
boundary conditions, there is no transverse electromagnetic
wave (TEM or TE
00
mode) that can be supported by a
rectangular waveguide or a ridged waveguide. Therefore, the
TE
10
mode is the lowest propagating mode. Given those
numerical values in Fig. 1, a ¼ 300 nm, b ¼ 200 nm, s ¼
100 nm, and d ¼ 100 nm, the cutoff wavelength of the
fundamental TE
10
mode is found to be 805 nm, which is
2:68a where a is the length of the waveguide.
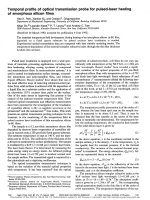
The maximum amplitude of the electric field jEj at each
point in the simulation volume is displayed in Fig. 2.
Different incident wavelengths are investigated. Linearly
polarized field along the y-direc tion is used. It is found that
the cutoff frequency of the TE
01
mode for the H-shaped
aperture in Fig. 1 is about 1:4 Â 10
15
Hz ( ¼ 214 nm or
0.71a), which is much higher than that of the TE
10
mode,
meaning light can pass through the aperture more easily
when polarized along the y-direction than the x-direction. In
fact, simulation results show that the transmission efficiency,
which is evaluated by the ratio of the electric field intensity
integrated over the aperture area to inciden t field intensity
integrated over the aperture area, of x-polarized incident
light is about 2800 fold less than that of y-polarized incident
light. There fore, the y-direction, the direction across the
ridges, is the preferred polarization direction for the H-
shaped aperture.
When the incident wavelength is longer than the cutoff
wavelength, 805 nm, no propagation mode can exist inside
(a) |E|
100%
=8.83
E
k
(b) |E|
100%
=8.87
E
k
(c) |E|
100%
=3.00
E
k
(d) |E|
100%
=3.00
E
k
(e) |E|
100%
=3.42
.
E
(f) |E|
100%
=4.03 (g) |E|
100%
=3.00 (h) |E|
100%
=3.00
(i) |E|
100%
=2.73
E
(j) |E|
100%
=6.74
E
(k) |E|
100%
=1.64
E
(l) |E|
100%
=2.78
E
(n) |E|
100%
=1.86
E
(o) |E|
100%
=0.691
E
(p) |E|
100%
=1.38
E
λ = 1000 nm (3.33 a) λ = 500 nm (1.67 a) λ = 250 nm (0.83 a) λ = 150 nm (0.5 a)
(m) |E|
100%
=0.418
E
200nm
100%
80%
60%
40%
20%
.
E
.
E
.
E
Fig. 2. Distribution of the maximum electric field amplitude jEj of H-shaped aperture (a ¼ 300 nm, b ¼ 200 nm, s ¼ 100 nm,
d ¼ 100 nm) in an ideal conductor film of 500 nm thick illuminated by y-polarized incident plane wave of different wavelengths, on yz
plane at x ¼ 0, xz plane at y ¼ 0, xy plane cutting through the middle of the film, and xy plane 50 nm behind the aperture, from the first
row to fourth row respectively. From the first column to fourth column, the wavelength is 1000 nm, 500 nm, 250 nm and 150 nm,
respectively. The peak amplitudes are shown as the insets of each plot taking the amplitude of incident electric field to be 1.
Jpn. J. Appl. Phys., Vol. 43, No. 1 (2004) E. X. J
IN and X. XU 409
the aperture channel. This is seen in the case of the 1000 nm
wavelength. Only the evanescent wave whose intensity
decreases quickly along the z-direction is found, which can
be observed from E field distribution on the yz and xz plane
[Figs. 2(a) and 2(e) ]. When the incident light has a
wavelength of 500 nm, shorter than the cutoff wavelength,
the fundamental TE
10
mode is clearly observed in the
aperture channel [Figs. 2(b) and 2(f)]. This TE
10
mode is
completely concentrated in the gap region between the
ridges as shown in Fig. 2(j) and propagates through the
channel without losing much energy. Therefore, a super
resolution spot can be found in the near field behi nd the
aperture; and high intensity is obtained [Fig. 2(n) ] compared
with the case of evanescent wave [Fig. 2(m)]. For an even
shorter incident wavelength 150 nm, it is shown in Fig. 2
(the four th column) that the fundamental mode is not the
only excited propagation mode inside the channel. In this
case, a TE
20
mode [Fig. 2(l)] is also excited and propagating
along the channel. Further, the field emerging from the
channel is no longer concentrated near the gap region, but
instead is split into two parts resulting in two light spots in
the near-fiel d region below the aperture [Fig. 2(p)]. There-
fore, the resolution is reduced. It is noticed that two spots
appear near the bottom corners in Fig. 2(h) (similar spots are
shown in other figures), which are caused by insufficient
boundary absorption there. Since the focus of the calculation
is in the near field of the aperture, which is far away from the
bottom boundary, it is expected that those spots do not
influence the near field results. The calculation result about a
100 nm hole in a thick perfect conducting plate (not shown
here) is consistent with resu lts given in the literature,
5)
which
indicates the validity of the numerical procedures used here.
The broadband property of the ridged waveguide in
microwave engineering is also verified here for the H-shaped
aperture in the optical frequency range. As shown in the
third column in Fig. 2, the previously defined H-shaped
aperture also works for ultraviolet frequency, the 250 nm
wavelength. In fact, based on the eigenvalue calculation of
eq. (4), the spectrum separation between the dominant mode
TE
10
and the first higher order mode is about 580 nm.
Therefore, the H-shaped aperture is suited for practical
operation as it covers quite a large frequency range instead
of a single frequency.
In order to further demonstrate the transmission enhance-
ment in the H-shaped aperture, numerical simulations are
performed on two regular apertures irradiated by y-polarized
488 nm incident light, a 300 Â 200 nm (0:61 Â 0:41)
rectangular aperture and a 100 Â 100 nm (0:20 Â 0:20)
square aperture, and compared with the 300 Â 200 nm
(0:61 Â 0:41) H-shaped aperture with a gap of 100 Â
100 nm (0:20 Â 0:20). A 100 nm thick ideal conductor
film illuminated by 488 nm wavelength light is considered.
Figure 3 shows distributions of the maximum amplitude
of the electric field jEj for the three apertures on the yz plane
at x ¼ 0, xz plane at y ¼ 0, and xy plane at y ¼ 25 nm
(0:05) and 50 nm (0:10) behind the apertures. The
fundamental cutoff wavelengths, the expected propagation
mode inside the aperture, transmission efficiency, the peak
value of the electric field at a distance 25 nm (0:05) behind
the apertures, the spot size which is the ful l width half
magnitude (FWHM) of electric field intensity at a distance
25 nm (0:05) behind the apertures along x and y directions,
and signal contrast defined as (I
max
À I
min
)/(I
max
þ I
min
)ata
distance 50 nm (0:10) behind the apertures are summarized
in Table I.
No propagating wave front can be found inside the square
aperture as its cutoff wavelength 200 nm is far below that of
the incident wave. As expected, the electromagnetic field
becomes very weak below the aperture (the third column in
Fig. 3). On the other hand, the TE
10
propagation mode is
found for both the H-shaped and the rectangular apertures
since the incident wavele ngth is below their cutoff wave-
lengths, 805 nm and 600 nm, respectively.
Although a small spot is formed below the square aperture
[Fig. 3(i)] due to the evanescent wave through the aperture
channel, the transmission efficiency is as low as 0.0038. In
contrary, the optical transmission efficiency through the H-
shaped aperture is 2.14, which is higher than 1 and is about a
563 fold enhancement over the square aper ture. It is also
evident from Fig. 3(l) that the contrast of the signal coming
out from the small square aperture is too low to be
distinguished from the backgr ound at a distance 50 nm
(0:10) below the aperture. Compared with the rectangular
aperture, the spot size for the H-shaped aperture shrinks in
both x and y directions, while their transmission efficiencies,
peak field intensities, and signal contrasts are comparable.
A close look at the field distribut ions of the H-shaped
aperture reveals that it resembles an electric dipole. Figures
4(a) and 4(b) show the dB scaled distributions of maximum
amplitudes of jEj and jBj on the yz plane at x ¼ 0 for the H-
shaped aperture. The isoli nes of both electric and magnetic
fields are half-circles centered on the aperture. The electric
field decreases more rapidly away from the aperture than the
magnetic field, which can be observed in the jEj and jBj
variation along y ¼ 0 line on the yz plane (Fig. 5). This kind
of field behavior is the same as that of an electric dipole in
the near-field region.
28)
Furthermore, the profile of power
densities on the plane right behind the H-shaped aperture in
Fig. 6 shows that the total power density is dominated by the
electric field in the near-field region of the aperture. In
contrast, for the square aperture, the power density is
dominated by the magnetic field as shown in Fig. 7, which
corresponds to a magnetic dipole predicted by Bethe.
2)
It is
noticed that the scale of Fig. 6 is 2 or 3 orders higher than
that of Fig. 7, which further confirms the transmission
enhancement of the H-shaped aperture. The two peaks of
electric power density ("
0
jEj
2
=2) on the rims of both
apertures in the y-direction (the direction of incident
polarization) arise from the accumulated high surface charge
density on the edges. The local electric power density there
enhance to a factor of 4 compared with the center for both
apertures. In the x-direction, the central peak of the electric
power density is enclosed by two peaks of the magnetic one,
as the magnetic field always curls around the axis of the
electric dipole.
28)
The electric dipole-liked behavior is
another advantage of ridged aperture over the regular
apertures for near-field optical applications since the
interaction between visible light and matter is dominated
by the electric field. The transmitted electromagnetic
energies are stored in the near field of the aperture. In the
z-direction, the electric field decays more than half in a
distance of 200 nm (0:41). The FWHMs of the electric
410 Jpn. J. Appl. Phys., Vol. 43, No. 1 (2004) E. X. JIN and X. XU
(a) |E|
100%
=4.47
E
k
(c) |E|
100%
=2.20
E
k
(b) |E|
100%
=4.82
E
k
(d) |E|
100%
=2.19 (e) |E|
100%
=2.12
(f) |E|
100%
=2.20
200nm
100%
80%
60%
40%
20%
E
(g) |E|
100%
=1.94
(h) |E|
100%
=1.94
E
(i) |E|
100%
=0.14
E
E
(j) |E|
100%
=1.32
(k) |E|
100%
=1.50
E
(l) |E|
100%
=0.08
E
H-sha
p
ed
S
q
uare
Rectan
g
ular
.
E
.
E
.
E
Fig. 3. Distribution of the maximum electric field amplitude jEj of nano-apertures of different shapes in a 100 nm (0:20) thick ideal
conductor film. From the first column to third column, the aperture is 300 Â 200 nm (0:61 Â 0:41) H-shaped with a gap 100 Â 100 nm
(0:20 Â 0:20), 300 Â 200 nm (0:61 Â 0:41) rectangular and 100 nm (0:20) square, respectively. The first row to fourth row shows
yz plane at x ¼ 0, xz plane at y ¼ 0, xy planes 25 nm (0:05) and 50 nm (0:10) behind the aperture, respectively. y-polarized, 488 nm
normally incident light is considered for all cases. The peak amplitudes are shown as the insets of each plot. The amplitude of the
incident electric field is 1.
Table I. Comparison of H-shaped, rectangular and square apertures.
H-shaped Rectangular Square
aperture aperture aperture
Aperture dimensions
300 Â 200 nm 300 Â 200 nm 100 nm
(0:61 Â 0:41)(0:61 Â 0:41)(0:20)
Gap size
100 Â 100 nm
NA NA
(0:20 Â 0:20)
Fundamental cutoff wavelength (nm) 805 600 200
Existing propagation mode TE
10
TE
10
No
Transmission efficiency 2.14 2.31 0.0038
jEj
max
at d ¼ 25 nm (0:05) 1.84 1.86 0.039
Spot size at d ¼ 25 nm (0:05)
130 Â 168 nm 168 Â 262 nm 60 Â 140 nm
(0:27 Â 0:34)(0:34 Â 0:54)(0:12 Â 0:28)
Signal contrast at d ¼ 50 nm (0:10) 0.770 0.823 NA
aÞ
a) The output signal can not be distinguished with the background as seen in Fig. 3(l).
Jpn. J. Appl. Phys., Vol. 43, No. 1 (2004) E. X. J
IN and X. XU 411
power density in the x- and y-directions are 120 nm (0:25)
and 112 nm (0:23), respectively (Fig. 6), approximately
corresponding to the gap size. Power densities decay
exponentially b oth in x- and y-directions, and become
almost zero at the displacements of 200 nm (0:41). Similar
results can be observed for the square aperture (Fig. 7).
To further investigate the transmission behavior of the H-
shaped aperture, its spectral variation and dependence on the
film thickness are calculated. Several transmission peaks are
found in the transmission spectrum in a 500 nm thick ideal
conductor film as shown in Fig. 8. Conversely, transmission
peaks are also found at some particular thicknesses when the
incident wavelength is held constant as shown in Fig. 9. It
has been reported that in narrow slits,
30–32)
a Fabry–Perot-
E field B field
E
k
(a) dB scale, 0dB=4.76 V/m
E
k
(b) dB scale, 0dB=7e-9 wb/m
0
-3
-6
-9
-12
100nm
Fig. 4. dB scaled distributions of field maximum amplitudes jEj and jBj
for the H-shaped aperture in a 100 nm thick ideal conductor film on yz
plane at x ¼ 0. The amplitude of the incident electric field is 1.
0.3
0.4
0.5
0.6
0.7
0.8
0.9
1
40 60 80 100 120 140 160 180 20
0
|E|
|B|
Relative magnitude of E or B
Distance awa
y
from a
p
erture
(
nm
)
Fig. 5. Variations of maximum amplitudes jEj and jBj along y ¼ 0 on the
yz plane behind the H-shaped aperture in a 100 nm thick ideal conductor
film.
0
5 10
-12
1 10
-11
1.5 10
-11
2 10
-11
2.5 10
-11
-300 -200 -100 0 100 200 300
Pelec
Pmag
Ptot
Power density (W/m^2)
(
a
)
Dis
p
lacement in x direction
(
nm
)
120nm
0
2 10
-11
4 10
-11
6 10
-11
8 10
-11
1 10
-10
-300 -200 -100 0 100 200 300
Pelec
Pmag
Ptot
Power density (W/m^2)
(
b
)
Dis
p
lacement in
y
direction
(
nm
)
112nm
Fig. 6. Power density profiles on the plane right behind the H-shaped aperture in x and y directions.
0
2 10
-14
4 10
-14
6 10
-14
8 10
-14
1 10
-13
1.2 10
-13
1.4 10
-13
-200 -150 -100 -50 0 50 100 150 200
Pelec
Pmag
Ptot
Power density (W/m^2)
(
a
)
Dis
p
lacement in x direction
(
nm
)
0
2 10
-14
4 10
-14
6 10
-14
8 10
-14
-200 -150 -100 -50 0 50 100 150 200
Pelec
Pmag
Ptot
Power density (W/m^2)
(
b
)
Dis
p
lacement in
y
direction
(
nm
)
Fig. 7. Power density profiles on the plane right behind the 100 Â 100 nm (0:20 Â 0:20) square aperture in a 100 nm (0:20) thick
ideal conductor film in x and y directions.
412 Jpn. J. Appl. Phys., Vol. 43, No. 1 (2004) E. X. J
IN and X. XU
like resonance will occur for a single narrow slit in a perfect
conductor. Similar resonance is also found for the H-shaped
aperture discussed here. The Fabry–Perot resonance follows
the condition
30)
m
2
g
¼ t ð5Þ
where t is the length of the Fabry–Perot cavity, and equals to
the film thickness here. With eqs. (5) and (3), the resonant
incident wavelengths can be estimated. In our case, they
are found to be 239 nm (0:48t), 308 nm (0:62t), and 425 nm
(0:85t) in the wavelength range of interest. Compared with
FDTD simulation results in Fig. 8, the resonance wave-
lengths shift towards longer wavelengths, 275 nm (0:55t),
375 nm (0:75t), and 520 nm (1:04t) respectively. This
wavelength shift is caused by the finite length of the
aperture channel (film thickness). As noted in the description
of eq. (3), eq. (3) is valid for aperture waveguide with
infinite length. There fore, results estimated using eqs. (5)
and (3) do not match with the FDTD results exactly. Results
in Figs. 8 and 9 show how to choose the wavelength or the
film thickness in order to optimize the transmission
efficiency through a nano-aperture.
3.2 Effects of surface plasmon and finite skin depth
So far, only ideal conductor films are considered. For
applications involving very thin films, the effect of real
metals needs to be examined. Figure 10 compares maximum
amplitude of the electric field jEj in the vicinity of identical
H-shaped apertures (a ¼ 300 nm, b ¼ 120 nm, s ¼ 100 nm
and d ¼ 50 nm) in a film of equal thickness t ¼ 50 nm, made
of ideal conductor (IC), alumi num, and silver, respectively,
at an incident wavelength of 488 nm. At this wavelengt h,
most real metals have complex dielectric constants, which
are À34:80 þ 8:73i for aluminum and À7:90 þ 0:74i for
silver.
In the IC case, the transmitted electric field approaches
zero on the film surface, which is consistent with the
boundary condition for an ideal conductor. As a conse-
0
1
2
3
4
5
0.4 0.5 0.6 0.7 0.8 0.9 1 1.1 1.2
Transmission efficiency
Wavelen
g
th
(
normalized b
y
film thickness
)
Fig. 8. Transmission spectrum of the H-shaped aperture in 500 nm thick
ideal conductor film. Uniform y-polarized plane wave is normally
incident on the top surface of the film.
1.5
2
2.5
3
3.5
4
0 0.2 0.4 0.6 0.8 1 1.2 1.4 1.
6
Transmission efficiency
Film thickness (normalized by wavelength)
Fig. 9. Transmission efficiency through the H-shaped aperture in a thick
ideal conductor film of different thickness under 488 nm y-polarized
illumination.
(a) |E|
100%
=5.77
E
(b) |E|
100%
=5.12
E
(d) |E|
100%
=1.04
E
(c) |E|
100%
=16.9
E
(f) |E|
100%
=0.914
E
(e) |E|
100%
=0.906
E
IC
Al
A
g
200nm
100%
80%
60%
40%
20%
Fig. 10. Distribution of the maximum electric field amplitude jEj of an H-shaped aperture in a 50 nm (0:10) thick ideal conductor,
aluminum, and silver film, from the first column to third column, respectively. The aperture is 300 Â 120 nm (0:61 Â 0:25) H-shaped
with a gap of 100 Â 50 nm (0:20 Â 0:10). The first and the second row are xy plane right below the film, and the xy plane 50 nm
(0:10) below the film, respectively. y-polarized 488 nm normally incident light is considered for all cases. The peak amplitudes are
shown as the insets in each plot. The amplitude of the incident electric field is 1.
Jpn. J. Appl. Phys., Vol. 43, No. 1 (2004) E. X. J
IN and X. XU 413
quence, no surface plasmon can be excited. The electric field
is confined in the small gap region, which corresponds to the
guided waveguide mode as disc ussed in §3.1. In contrast, the
field is locally distributed on the edges of the aperture across
the incident polarization direction on the bottom surface of
the silver film as seen in Fig. 10(c), which can be attributed
to the excitation of the localized surface plasmon
6)
(LSP)
due to the negative real part of permittivities
33)
of both
aluminum and silver. A strongly enhanced electric field of a
maximum magnitude of 16.9 is observed. The localized
surface plasmon excitation is much stronger for Ag than for
Al as shown in Figs. 10(c) and 10(b) due to the fact that the
absolute value of the ratio of the real part of the complex
permittivity to the imaginary part for silver is larger than that
for aluminum.
33)
From the calculation, it is also found that the LSP
enhances transmission efficiency, which is 2.02, 2.17 and
8.81 for IC, aluminum and silver, respectively. Unlike the
transmission enhancement through a hole array in silver
film,
34,35)
the localized surface plasmon excitation here has a
negative effect on the performance of H-shaped aperture.
Due to the excited LSP in silver, the field distribution of the
transmitted light through the aperture is changed, and the
transmitted light does not concentrate in the gap region.
Instead, it spreads out quickly along the direction of
polarization, enlarges the output spot size and reduces the
signal contrast, which can be observed in the Fig. 10(f). In
contrary, the output spot in the aluminum as well as the IC
case keeps a similar shape. This suggests that 50 nm thick
aluminum can be treated as an ideal conduct under 488 nm
illumination.
When the film thickness is close to the skin depth of the
metal film at the frequency of consideration, some field can
transmit through the metallic film. As this field interferes
with the field transmitted through the aperture, the concen-
tration of the field in the vicinity of aperture will be
disturbed, and the signal contrast will decrease. Figure 11
shows the variation of signal contrast for an aluminum film
with thicknesses ranging from 5 nm to 50 nm. The H-shaped
aperture considered here has the same geometry used in the
last calculation. At 488 nm illumination, the skin depth of
aluminum is about 6.5 nm, therefore the low contrast at the
film thickness of 5 nm is expected. When the film is thicker
than 30 nm, the contrast cannot be improved any more since
the peak field intensity I
max
starts to decrease. This is
because as the guided fundamental TE
10
mode propagates a
distance much longer than the skin depth, the energy lost
along the side wall of the gap region becomes significant.
3.3 Comparison of different aperture shapes
In this section, three ridged apertures of different shape s,
H-shaped, C-shaped and bowtie-shaped, but of equal
aperture areas, as well as two comparable regular apertures
are compared regarding to the followi ng aspects: electric
field intensity distributions, transmission efficiency, peak
value of electric field, spot size, and signal contrast. The
smallest feature size (gap width) of these apertures is chosen
to be 50 nm (0:10). A 50 nm-thick aluminum film is
illuminated by y-polarized 488 nm uniform incident field for
all situations.
Table II compares results of the calculation. In terms of
transmission efficiency, electric field intensity and signal
contrast, all three apertures show significant advantages over
regular apertures. Transmission efficiencies of ridged aper-
tures are all above unity, and signal contrasts are also high
compared with the square aperture. It needs to be mentioned
0.45
0.5
0.55
0.6
0.65
0.7
0.75
0.8
0102030405060
Contrast at d = 50nm
Film thickness (nm)
Intensity
I
max
I
min
FWHM
0d2d
I
max
/2
Contrast
=
minmax
minmax
II
II
+
−
Fig. 11. Variation of contrast with the thickness of the aluminum film.
Table II. Comparison of ridged apertures and regular apertures.
H-shaped C-shaped Bowtie-shaped Square Rectangular
aperture aperture aperture aperture aperture
Aperture 300 Â 120 nm 300 Â 120 nm 300 Â 200 nm 100 Â 100 nm 300 Â 100 nm
dimensions (0:61 Â 0:25)(0:61 Â 0:25)(0:61 Â 0:41)(0:20 Â 0:20)(0:61 Â 0:20)
Gap size
100 Â 50 nm 100 Â 50 nm 100 Â 50 nm
NA NA
(0:20 Â 0:10)(0:20 Â 0:10)(0:20 Â 0:10)
Transmission
2.023 1.885 1.869 0.856 2.633
efficiency
jEj
max
at d ¼ 25 nm
1.60 1.51 1.45 0.664 1.65
(0:05)
Spot size at d ¼ 25 100 Â 96 nm 128 Â 95 nm 122 Â 96 nm 84 Â 148 nm 134 Â 156 nm
nm (0:05)(0:20 Â 0:20)(0:26 Â 0:19)(0:25 Â 0:20)(0:17 Â 0:30)(0:27 Â 0:32)
Signal contrast at d
0.736 0.714 0.695 0.632 0.752
¼ 25 nm (0:05)
414 Jpn. J. Appl. Phys., Vol. 43, No. 1 (2004) E. X. J
IN and X. XU
that the transmission efficiency through the square aperture
is 0.856 compared with its counterpart listed in Table I,
0.0038. This is because a much thinner aluminum film is
considered here and the electromagnetic wave can propagate
to some distance along the wall of aluminum film inside the
square aperture. Further simulation results show that the
transmission efficiency through the square aperture will
decrease to 0.017 if the thickness of the aluminum film
becomes 150 nm while those through ridges apertures are
still above unity. The output spot size in the direction of the
gap at d ¼ 25 nm is about 96 nm (0:20), one third less than
that of the comparable rectangular aperture.
Several other common features are also found in the
electric field intensity distributions along the direction away
from the apertures on yz and xz planes. It is seen in Fig. 12
that the electric field intensity decreases dramatically with
the increasing distance d. At about d ¼ 100 nm (0:20), all
profiles become quite flat, meaning the signal contrast is low
and the desired signal cannot be well distinguished from the
background. The transmitted field through ridged apertures
is concentrated in the near-field region behind the apertures
as shown in the first two rows in Fig. 13. From the electric
field distributions on the xz plane (the second row in Fig. 13)
and on the middle of the xy plane inside the film (the third
row in Fig. 13), the propagation TE
10
mode can be found for
all three apertures. This TE
10
mode contributes to the high
transmission in all three cases.
On the yz plane at x ¼ 0 as shown in the first column in
Fig. 12, two peaks of the electric field are found at the rims
of the ridges for all three apertures at d ¼ 0 [Fig. 12(a),
0
5
10
15
20
-200 -150 -100 -50 0 50 100 150 200
d=0
d=25 nm
d=50 nm
d=100 nm
Normalized E field intensity
Displacement in y direction (nm)
(a) H-shaped aperture
on yz plane at x = 0
0
1
2
3
4
5
6
7
-200 -150 -100 -50 0 50 100 150 200
d=0
d=25 nm
d=50 nm
d=100 nm
Normalized E field intensity
Displacement in x direction (nm)
(b) H-shaped aperture
on xz plane at y = 0
0
2
4
6
8
10
12
14
-200 -150 -100 -50 0 50 100 150 200
d=0
d=25 nm
d=50 nm
d=100 nm
Normalized E field intensity
Displacement in y direction (nm)
(c) C-shaped aperture
on yz plane at x = 0
0
5
10
15
20
25
30
35
40
-200 -150 -100 -50 0 50 100 150 200
d=0
d=25 nm
d=50 nm
d=100 nm
Normalized E field intensity
Displacement in x direction (nm)
(d) C-shaped aperture
on xz plane at y = 0
0
2
4
6
8
10
12
14
-200 -150 -100 -50 0 50 100 150 200
d=0
d=25 nm
d=50 nm
d=100 nm
Normalized E field intensity
Dis
p
lacement in
y
direction
(
nm
)
(e) Bowite-shaped aperture
on yz plane at x = 0
0
1
2
3
4
5
-200 -150 -100 -50 0 50 100 150 200
d=0
d=25 nm
d=50 nm
d=100 nm
Normalized E field intensity
Dis
p
lacement in x direction
(
nm
)
(f) Bowite-shaped aperture
on xz plane at y = 0
Fig. 12. Profiles of normalized electric field intensity along the distance away from three different nano-apertures on yz plane at x ¼ 0
and xz plane at y ¼ 0. From the first to third row, the aperture is 300 Â 120 nm (0:61 Â 0:25) H-shaped aperture with a 100 Â 50 nm
(0:20 Â 0:10) gap, 300 Â 120 nm (0:61 Â 0:25) C-shaped aperture with a 100 Â 50 nm (0:20 Â 0:10) gap, and 300 Â 200 nm
(0:61 Â 0:41) bowtie-shaped aperture with a 100 Â 50 nm (0:20 Â 0:10) gap, respectively.
Jpn. J. Appl. Phys., Vol. 43, No. 1 (2004) E. X. J
IN and X. XU 415
12(c), 12(e)]. But the field intensity distribution of the C-
shaped aperture on the yz plane at x ¼ 0 is asymmetric due
to the single ridge structure [Fig. 12(c)]. Only one peak is
found on the xz plane at y ¼ 0 for the H-shaped and bowtie-
shaped apertures [Fig. 12(b), 12(f)], while two peaks can be
observed at d ¼ 0 for the C-shaped apertures [Fig. 12(d)].
The reason that the C-shaped aperture shows two peaks is
because the xz plane at y ¼ 0 intersects two corners of the
aperture as can be seen in Fig. 13(h). There are some
differences among the three ridged apertures in terms of
output spot size and shape. At d ¼ 25 nm (0:05), the
smallest spot size is obta ined from the H-shaped aperture.
The transmitted field through the C-shaped aperture spreads
out more rapidly along the x-direction than those through the
other two apertures. In addition, due to the single ridge
structure, the shape of the output spot is asymmetric for the
C-shaped aperture along the y-direction, while the other two
keep a symmetric shape as shown in the fourth row in
Fig. 13. However, it can be said that the difference among
the electric field distributions of the three cases is small.
Therefore, in practical applications, the choice of the shape
depends only on convenience of fabrication. At present, all
three types of apertures are being fabricated and the
transmitted filed will be evaluated.
4. Conclusions
We demonstrated that light spot with sub-wavelength
resolution can be achieved through H-shaped or other ridged
nano-apertures in a metal film while obtaining transmission
efficiency above unity and high contrast compared with
regular apertures. Using the waveguide cutoff analysis of the
H-shaped aperture, it was shown that when it is operated in
the optical frequency range between the cutoff frequencies
of TE
10
mode and TE
20
mode, the fundamental TE
10
mode is
(j) |E|
100%
=0.906
E
(a) |E|
100%
=4.70
E
k
(e) |E|
100%
=2.14
(k) |E|
100%
=0.884
E
(f) |E|
100%
=2.52
(l) |E|
100%
=0.880
E
(c) |E|
100%
=4.16
E
k
(d) |E|
100%
=2.86
(b) |E|
100%
=4.04
E
k
(g) |E|
100%
=4.02
E
x
y
(h) |E|
100%
=3.60
E
x
y
(i) |E|
100%
=3.21
E
x
y
H-shaped C-shaped Bow-tie shaped
200nm
100%
80%
60%
40%
20%
.
E
.
E
.
E
Fig. 13. Distribution of the maximum electric field amplitude jEj of three different nano-apertures. From the first to third column, the
aperture is 300 Â 120 nm (0:61 Â 0:25) H-shaped with a 100 Â 50 nm (0:20 Â 0:10) gap, 300 Â 120 nm (0:61 Â 0:25) C-shaped
with a 100 Â 50 nm (0:20 Â 0:10) gap, and 300 Â 200 nm (0:61 Â 0:41) bowtie-shaped with a 100 Â 50 nm (0:20 Â 0:10) gap,
respectively. From the first row to fourth row shows yz plane at x ¼ 0, xz plane at y ¼ 0, xy plane cutting through the middle of the
film, and xy plane 50 nm (0:10) behind the apertures. An aluminum film of 50 nm (0:10) thick illuminated by y-polarized 488 nm
incident light is considered for all cases. The peak amplitudes are shown as the insets of each plot. The amplitude of the incident
electric field is 1.
416 Jpn. J. Appl. Phys., Vol. 43, No. 1 (2004) E. X. J
IN and X. XU
excited and propagates through the aperture channel, which
contributes to the high optical transmission efficiency. The
small gap formed by the ridges plays a critical role to
concentrate the light and determine the resolution. Fabry–
Perot-like resonance was observed for the H-shaped aper-
ture, and an optimal film thickness could be found for a
particular operating wavelength to achieve even higher
transmission. LSP is excited on the edges of the aperture in
the silver film, whi ch has a negative effect on the signal
contrast and light concentration. In contrary, the LSP effect
is weak in the aluminum film at the 488 nm incident
wavelength. Further simulations and experiment s will be
conducted to optimize the nano-aperture design by consid-
ering the geometrical parameters, operating wavelength, and
the type of metal to use.
Acknowledgement
Support to this work by the National Science Foundation
is gratefully acknowledged.
1) E. H. Synge: Philos. Mag. 6 (1928) 356.
2) H. A. Bethe: Phys. Rev. 66 (1944) 163.
3) C. J. Bouwkamp: Philips Res. Rep. 5 (1950) 321.
4) Y. Leviatan: J. Appl. Phys. 60 (1986) 1577.
5) A. Roberts: J. Appl. Phys. 65 (1989) 2896.
6) K. Tanaka, T. Ohkubo, M. Oumi, Y. Mitsuoka, K. Nakajima, H.
Hosaka and K. Itao: Jpn. J. Appl. Phys. 40 (2001) 1542.
7) X. Shi and L. Hesselink: Jpn. J. Appl. Phys. 41 (2002) 1632.
8) K. Tanaka, T. Ohkubo, M. Oumi, Y. Mitsuoka, K. Nakajima, H.
Hosaka and K. Itao: Jpn. J. Appl. Phys. 41 (2002) 1628.
9) K. Sendur and W. Challener: J. Microscopy 210 (2003) 279.
10) K. Tanaka and M. Tanaka: J. Microscopy 210 (2003) 294.
11) K. S. Yee: IEEE Trans. Antennas Propagation 14 (1966) 302.
12) K. Kunz and R. Luebbers: The Finite Difference Time Domain Method
for Electromagnetics (CRC Press, Boca Raton, 1996) p. 11, p. 123.
13) J. Liu, B. Xu and T. C. Chong: Jpn. J. Appl. Phys. 39 (2000) 687.
14) E. Vasilyeva and A. Taflove: IEEE Antennas and Propagation Society,
AP-S International Symposium (IEEE, Piscataway, NJ, 1998) p. 1800.
15) O. J. F. Martin: J. Microscopy 194 (1999) 235.
16) M. Spajer, G. Parent, C. Bainier and D. Charraut: J. Microscopy 202
(2001) 45.
17) J. T. Krug, E. J. Sanchez and X. S. Xie: J. Chem. Phys. 116 (2002)
10895.
18) H. Nakamura, T. Sato, H. Kambe, K. Sawada and T.Saiki: J.
Microscopy 202 (2001) 50.
19) P. N. Minh, T. Ono, S. Tanaka and M. Esashi: J. Microscopy 202
(2001) 28.
20) T. D. Milster, F. Akhavan, M. Bailey, J. K. Erwin and D. M. Felix:
Jpn. J. Appl. Phys. 40 (2001) 1778.
21) S. Tang and T. D. Milster: Jpn. J. Appl. Phys. 42 (2003) 1090.
22) T. E. Schlesinger, T. Rausch, A. Itagi, J. Zhu, J. A. Bain and D. D.
Stancil: Jpn. J. Appl. Phys. 41 (2002) 1821.
23) W. A. Challener, T. W. Mcdaniel, C. D. Mihalcea, K. R. Mountfield,
K. Pelhos and I. K. Sendur: Jpn. J. Appl. Phys. 42 (2003) 981.
24) Z. P. Liao, H. L. Wong, G. P. Yang and Y. F. Yuan: Scientia Sinica 28
(1984) 1063.
25) Remcom Inc.: XFDTD 5.3 software (2002).
26) D. R. Lide: CRC Handbook of Chemistry and Physics (CRC Press,
Roca Raton, 1996) 77th ed., Sect. 12, p. 12.
27) E. D. Palik: Handbook of Optical Constants of Solids (Academic,
Orlando, 1985) Vol. 1, p. 350.
28) S. Ramo, J. R. Whinnery and T. V. Duzer: Fields and Waves in
Communication Electronics (John Wiley & Sons, 1994) p. 396, p. 589.
29) J. Helszajn: Ridge waveguides and passive microwave components
(IEE, London, 2000) p. 26.
30) S. Astilean, Ph. Lalanne and M. Palamaru: Opt. Commun. 175 (2000)
265.
31) Y. Takakura: Phy. Rev. Lett. 86 (2001) 5601.
32) C. L. Tan, Y. X. Yi and G. P. Wang: Acta Phys. Sinica 51 (2002)
1063.
33) H. Raether: Surface Plasmons on Smooth and Rough Surfaces and on
Gratings (Springer, Berlin, 1988) p. 4.
34) T. W. Ebbesen, H. J. Lezec, H. F. Ghaemi, T. Thio and P. A. Wolff:
Nature 391 (1998) 667.
35) H. F. Ghaemi, T. Thio, D. E. Grupp, T. W. Ebbesen and H. J. Lezec:
Phys. Rev. B 58 (1998) 6779.
Jpn. J. Appl. Phys., Vol. 43, No. 1 (2004) E. X. J
IN and X. XU 417