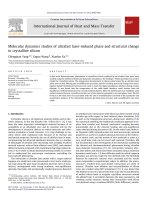
molecular dynamics studies of ultrafast laser induced phase and structural change in crystalline silicon
Bạn đang xem bản rút gọn của tài liệu. Xem và tải ngay bản đầy đủ của tài liệu tại đây (1.59 MB, 7 trang )
Molecular dynamics studies of ultrafast laser-induced phase and structural change
in crystalline silicon
Chengjuan Yang
a,b
, Yaguo Wang
b
, Xianfan Xu
b,
⇑
a
School of Mechanical Engineering, Xi’an Jiaotong University, Xi’an, Shaanxi Province 710049, PR China
b
School of Mechanical Engineering, Birck Nanotechnology Center, Purdue University, West Lafayette, IN 47907, USA
article info
Article history:
Received 7 November 2011
Received in revised form 26 May 2012
Accepted 4 June 2012
Available online 2 July 2012
Keywords:
Molecular dynamics simulation
Ultrafast laser
Melting
Resolidification
abstract
In this work, thermodynamic phenomena in crystalline silicon irradiated by an ultrafast laser pulse were
studied using the method of molecular dynamics simulations. The Stillinger–Weber potential was used to
model the crystalline silicon. The temperature development in silicon when heated by an ultrafast laser
pulse was tracked. Melting and resolidification processes and the resulting structural change were inves-
tigated. Radial Distribution Functions were used to track the liquid-amorphous interface during resolid-
ification. It was found that the temperature at the solid–liquid interface could deviate from the
equilibrium melting temperature by several hundred degrees. After the melted layer was solidified, some
melted material became crystalline and the rest of the material remained in an amorphous state. The dif-
ference in the final state was associated with the rate of resolidification and both of the qualitative and
quantitative analyses of the relationship between the final atom structure and resolidification rate were
made.
Ó 2012 Elsevier Ltd. All rights reserved.
1. Introduction
Crystalline silicon is an important material widely used in elec-
tronic industry. In the last decades (the ‘‘Silicon Era’’) [1], it has
been the most important technological material because of its
availability at an affordable cost, and its essential role for the
development of electronic devices on which electronic and infor-
mation revolution is based. However, it is a big challenge to ma-
chine silicon with traditional tools because of its thermal and
mechanical properties. Recently, the use of ultrafast laser in mate-
rial processing has attracted significant interests, due to a number
of advantages of ultrafast laser machining such as highly localized
material removal, reduced heat-affected zone (HAZ), and minimal
debris formation compared with machining using longer pulsed la-
sers [2–4]. In order to obtain desired processing results, it is essen-
tial to understand the microscopic mechanism controlling the
laser-induced phenomena.
The interaction of ultrafast laser pulses with a target material
happens at a small time scale (picosecond or less) and a small spa-
tial scale along the laser beam irradiation direction (tens of nano-
meters), accompanied with strong nonlinear, non-equilibrium,
optically, thermally, and mechanically coupled processes. Research
on ultrafast laser interactions with silicon has been started several
decades ago with respect to laser-induced phase transitions [5,6]
as well as the fundamental processes during laser ablation [7,8].
For numerical modeling, the traditional continuum approach to ex-
plore heat transfer and thermal mechanical coupling becomes
questionable due to the extreme heating and non-equilibrium
states obtained during the process [9]. On the other hand, Molecu-
lar Dynamics (MD) simulation does not need macroscopic material
properties as a priori. It analyzes physical processes at the molecu-
lar or atomic scale, and the motion of each molecule or atom at a
very small time scale can be traced and captured. Therefore, MD
has the potential in the investigation of the mechanism underlying
the thermal and thermomechanical phenomena during ultrafast
laser-materials interactions [10–13]. Interactions between ultra-
fast laser pulses and silicon have been simulated using a molecular
dynamics model and a 1-D heat diffusion model in which Langevin
dynamics was used to couple the two methods [14]. The threshold
fluences for material’s removal were estimated and the results
were comparable to experimental values. In addition, the micro-
structures resulted from laser-matter interactions are often of
interest. Ultrafast laser ablation and recrystallization of silicon
were also studied using MD simulations [15]. It was found that
the ablation occurs on a picosecond time scale and recrystallization
of melted silicon leads to irregular crystalline structures around
the ablated hole. A correlation between the laser parameters and
resulting crystal structure during laser interactions with silicon
was obtained using a combined MD/FD (finite difference) simula-
0017-9310/$ - see front matter Ó 2012 Elsevier Ltd. All rights reserved.
/>⇑
Corresponding author. Address: 585 Purdue Mall, School of Mechanical
Engineering, Purdue University, West Lafayette, IN 47907, USA. Tel.: +1 765 494
5639; fax: +1 765 494 0539.
E-mail address: (X. Xu).
International Journal of Heat and Mass Transfer 55 (2012) 6060–6066
Contents lists available at SciVerse ScienceDirect
International Journal of Heat and Mass Transfer
journal homepage: www.elsevier.com/locate/ijhmt
tion method [16]. Especially, the kinetics of melting and solidifica-
tion of silicon have been investigated detailedly in the context of
laser processing and explosive crystallization. Using nonequilibri-
um molecular-dynamics (NEMD) computer simulation techniques,
the maximum crystallization velocity of SiGe alloys modeled by
the Stillinger–Weber potential is found to decrease below the pure
component values, in agreement with the results of explosive crys-
tallization measurements [17]. Based on the NEMD technique and
Stillinger–Weber potentials, the location of the solid–liquid inter-
face during laser thermal processing of heavily B-doped a-Si on
c-Si was determined by observing the diffusion coefficients (via
mean-square displacement data), the three-body potential energy
[18], and the fraction of solid atoms in each layer [19]. Computa-
tion of the interface temperature and regrowth velocity gives an
indirect view of the congruent melting temperature of these heav-
ily boron-doped Si that is inaccessible experimentally [20]. Using
the first atomic-scale computer simulation of explosive crystalliza-
tion, it is found that the crystal–liquid interface temperature of
amorphous material (Si or Ge) is controlled by the crystal-side heat
bath, while their liquid-amorphous interface temperature is inde-
pendent of the amorphous-side heat bath temperature [21]. The
dependence of different crystalline morphologies of Si or Ge on dif-
ferent heat loss conditions was also explored [21]. Furthermore,
different mechanisms for the amorphization of crystal Si were re-
vealed that amorphization mechanism may involve a glass transi-
tion in Si [22].
Experimental studies have also been carried out to investigate
ultrafast laser induced structural change. Transmission electron
microscopy and scanning electron microscopy have been used to
study the microstructures of femtosecond laser irradiated spots
[23]. Using micro-Raman spectroscopy (
l
-RS), atomic force micros-
copy, and laser scanning microscopy, the thickness of the amor-
phous layer is determined to be of the order of several tens of
nanometers at fluences up to two timesabove the melting threshold
[24]. Residual stress and amorphization of the silicon single crystal
were studied using micro-Raman spectroscopy as a function of the
fluence and pulse duration of the incident laser. Femtosecond laser
irradiation was found to induce significant stress and amorphization
in single crystal silicon. Also, effects of the laser polarization on
residual stress and amorphization during femtosecond laser
machining of silicon wafers were also observed [25].
The aim of this work is to use MD simulations to investigate
ultrafast laser-induced phase and structural change occurring in
ultrafast laser interactions with crystalline silicon. The crystalline
silicon is modeled using the Stillinger–Weber potential. The tem-
perature evolution during ultrafast laser heating, melting and reso-
lidification processes is tracked. One focus is to understand the
interface kinetics, the relation between the melting/resolidification
velocity and the interface superheating and undercooling, during
which the RDF was tried to be applied in determining the interface
positions of crystalline-liquid and liquid-amorphous silicon; and
the second focus is to understand the resulting microstructure,
i.e., crystalline vs. amorphous, and the qualitative and quantitative
relations between the transient process parameters and the result-
ing structure were fully studied.
2. Molecular dynamics simulation
In this study, crystalline silicon with an initial temperature of
300 K is irradiated by an ultrafast laser pulse. In the MD model, the
movement of each atom is governed by the Newtonian equation,
the forcebetween twoatoms is obtained fromthe corresponding po-
tential energy that governs the interactions among atoms [26].
Many efforts have been made to find out a reliable empirical po-
tential for crystalline silicon. Each of the potentials has significant
differences in at least one aspect, yet the best choice of the poten-
tial for corresponding study is based on the consistency of what the
potential can do and what the potential is needed to do [21]. The
Stillinger–Weber [27–29] potential, which was parameterized by
considering liquid-phase properties of silicon and gives similar dif-
fusivities in the liquid and tendency to cluster [20], is employed in
this work. In addition, the solidification process described by the
Stillinger–Weber model, such as the relationships among solidifi-
cation velocity, temperature, and time, is better behaved than
those obtained from the embedded atom method [30] (EAM) and
LJ [31,32] potentials. The large system size gives much better sta-
tistics but does not change the overall conclusions [17]. Both
two-body and three-body interactions in Stillinger–Weber poten-
tial are utilized to stabilize the diamond cubic structure of crystal-
line silicon. The Stillinger–Weber potential is by far the most
widely used for modeling silicon [33]. And the values of the adjust-
able parameters which reproduce the properties of crystalline,
amorphous, and liquid silicon could be found in ref. [28] and [29].
The modified velocity Verlet algorithm was applied to integrate
Newton’s equation [34,35]. MPI has been implemented to speed up
the calculation. To prepare equilibrium samples at 300 K, MD is
conducted in a canonical NVT ensemble for 50 ps to stabilize the
temperature and then switched to microcanonical NVE ensemble
for another 50 ps. Velocity scaling is used. The final temperature
we got is 298.8 K, which is very close to the desired temperature
of 300 K. For all the cases studied in this paper, the periodic bound-
ary conditions are applied along x and y directions, while the free
boundary condition is used along z direction.
When silicon is exposed to intensive laser field, electrons will
first absorb photons and be excited from the valence band to the
conduction band. Then the hot electrons will relax and combine
with holes and transfer energy to the lattice atoms. However, the
electronic process is beyond the scope of classical MD simulations.
In this work, the transfer of electron energy to the lattice is handled
by considering a longer laser pulse. The laser pulse has a pulse
Nomenclature
C
l
material constant
D
E
abs
absorbed energy
E
k
kinetic energy
I laser beam intensity
I
0
initial incident laser beam energy
I
init
initial laser beam energy when time is zero
t time
t
0
time for peak laser intensity
t
g
laser pulse width, full width at half maximum (FWHM)
T
eq
equilibrium melting temperature
T
int
melt-solid interface temperature
D
T interfacial superheating/undercooling temperature
V
int
interface velocity
D
z distance away from the surface irradiated by laser
Greek Symbols
d optical penetration depth
v
velocity scaling factor
C. Yang et al. / International Journal of Heat and Mass Transfer 55 (2012) 6060–6066
6061
duration of t
g
(centered at time t
0
), which is taken as 3 ps. This t
g
can be either the actual Gaussian pulse duration, or the time
needed for electrons to transfer the absorbed energy to the lattice
for a sub-ps laser pulse. The laser pulse is centered at 14 ps.
From the Beer-Lambert law, the intensity of an electromagnetic
wave inside a material falls off exponentially from the surface as:
IðzÞ¼I
0
exp À
D
z
d
¼ I
init
exp Àðt À t
0
Þ
2
=t
2
g
hi
exp À
D
z
d
ð1Þ
where I(z) is the laser beam intensity in the material, I
0
is the inci-
dent laser beam intensity at the sample surface. d denotes optical
penetration depth and its value is also listed in Table 1. Values of
the parameters in Eq. (1) are all listed in Table 1. The laser energy
absorbed by the material is changed to the kinetic energy of atoms,
which is realized through the scaling the velocities with factor
v
,
expressed as:
v
¼ 1 þ
D
E
abs
E
k
1=2
ð2Þ
where
D
E
abs
is the absorbed energy, and E
k
is the kinetic energy.
3. Results and discussion
The main task of this study is to investigate the solid–liquid
phase change and the resulting structure of silicon upon ultrafast
laser irradiation. In order to explain phase change induced by an
ultrafast laser pulse, the equilibrium melting temperature of crys-
talline silicon is first computed using the Stillinger–Weber poten-
tial function described in Refs. [27–29].
3.1. Determining the equilibrium melting temperature of crystalline
silicon
A small computational domain consisting of 1296 atoms and
with size of 1.63 nm  1.63 nm  9.78 nm (x, y, z: 3, 3, 18 unit cells
and each unit cell is occupied by one silicon lattice and each silicon
lattice cubic contains 8 silicon atoms) is used for computing the
equilibrium melting temperature of crystalline silicon. In order to
allow expansion along the z-direction, extra 18 unit cells, which
are the empty space for the purpose of allowing the motions of
atoms at the two sides surfaces when temperature increases, are
added both above and below the target along the z-direction. The
computational domain is illustrated in Fig. 1(a).
To find out the equilibrium melting temperature of crystalline
silicon, equilibrium states are computed at different temperatures.
Fig. 2(1–4) below show the atom structures of sample with a series
of different temperatures (1780 K, 1800 K, 1850 K, 1870 K) near
melting at two time 2 ps and 200 ps. It can be seen that the surface
of the sample starts to melt at about 1780 K but the rest part of
thin film remains as solid due to the higher surface energy of the
atoms at the surface. Besides that, at 1780 K, the atom structure
does not change whereas for all others the structures keep evolving
until the material is completely melted. Therefore, the states above
1780 K are not equilibrium states. For studying the laser-induced
phase change as discussed below, we take 1780 K as the equilib-
rium melting temperature determined by the Stillinger–Weber po-
tential employed in this study.
Compared with the experimental melting point of solid silicon,
1683 K [36], the melting temperature calculated in our work
1780 K is about 100 K higher. This difference can be caused by a
number of reasons. As we know [37], the uniaxial expansion and
associated anisotropic lattice distortions can affect the melting
temperature. It has been shown that the anisotropic deformation
reduces the lattice stability against the initiation of melting. Simi-
larly, a uniaxial expansion of the system and anisotropic distor-
tions of the lattice caused by increasing temperature will have
similar effect as that in Ref. [37] on the melting temperature
[38], which leads to a higher equilibrium melting temperature of
1780 K in our study. Furthermore, the different method or different
boundary conditions used in our calculations also contribute the
difference in our melting temperature compared with the litera-
ture values [27,39,33,36,40].
3.2. Temperature evolution and phase and structural change of
crystalline silicon irradiated by an ultrafast laser pulse
A sample, consisting of 17,280 atoms and with a size of
1.63 nm  1.63 nm  130.37 nm (x, y, z: 3, 3, 240 unit cells and
Table 1
Values of parameters used in the equations.
Parameter Value
m
a
, silicon atomic mass (Kg) 28.0855 Â 1.66 Â 10
À27
k
B
b
, Boltzmann’s constant 1.38 Â 10
À23
d
c
, laser penetration depth (m) 5.54 Â 10
À9
D
t
d
, time step (s) 2.0 Â 10
À16
t
0
, time for peak laser intensity (s) 10 Â 10
À12
t
g
, laser pulse width, full width at half maximum
(FWHM) (s)
3 Â 10
À12
a
Reference [50].
b
Reference [10].
c
Reference [51].
d
Reference [27].
Fig. 1. Scheme of the computational domain of (a) equilibrium state system and (b)
laser heating system.
6062 C. Yang et al. / International Journal of Heat and Mass Transfer 55 (2012) 6060–6066
each unit cell is occupied by one silicon lattice and each silicon lat-
tice cubic contains 8 silicon atoms), is used for the study of ultra-
fast laser heating. For the purpose of allowing the motions of
atoms at the surface, extra 480 empty unit cells and 120 empty
unit cells, which are the empty space for the purpose of allowing
the motions of atoms at the two sides surfaces when laser heating
starts, are added to top and bottom of the target along the z-direc-
tion, respectively. The computational domain is shown in Fig. 1(b).
Figs. 3 and 4 show the temperature distribution in silicon when
the target surface is irradiated by laser pulses with fluences of 60 J/
m
2
and 90 J/m
2
, respectively. It is seen that there is a rapid temper-
ature rise at the surface around the time when the laser intensity
reaches its peak value at 14 ps. As time progresses, the absorbed
energy is transferred to other atoms beneath the surface through
inter-atomic interactions. At the end of the computation period,
200 ps, the target reaches a uniform temperature.
The peak temperatures obtained in Figs. 3 and 4 have exceeded
the equilibrium melting temperature calculated in Section 3.1.In
order to illustrate the structural evolution, the positions of atoms
near the surface where the phase change occurs are plotted in
Fig. 5 for the laser fluence of 60 J/m
2
. As shown in Fig. 5(b), the
atomic structure is kept as that of the equilibrium state till about
14 ps when the temperature reaches 2066 K, above the melting
point. The laser heating process continues till 20 ps, about the
end of the laser pulse. The melt depth reaches a maximum depth
of 2.68 nm, and then resolidification starts. It is noted that after
the melted region is completed solidified, some of the materials
near the surface remains as amorphous as shown in Fig. 5(i). At
200 ps, the temperature of target tends to be uniform at 485 K as
shown in Fig. 3(b). Therefore, the computational domain is com-
pleted solidified. More analysis of the resolidification process will
be discussed below. The thickness of this amorphous layer is about
2.05 nm (the top surface is located at 195.55 nm), less than the
maximum melt depth of 2.68 nm. This will be discussed later.
Similar structural changes are observed when the laser fluence
is 90 J/m
2
, except that a higher peak temperature of 5121 K (20 ps)
is obtained. The maximum melt depth is 5.60 nm, and the resulting
amorphous layer after resolidification is 4.11 nm.
3.3. Interface kinetics and the resulting silicon structure
The results from the MD calculations offer an opportunity to
investigate the interface kinetics, i.e., interface superheating and
undercooling temperature in the phase change process induced
by an ultrafast laser pulse, and its effect on the resulting structures.
Fig. 2. Atomic structures at different temperatures of (1) 1780 K (a)1780 K – 2 ps,
(b)1780 K – 200 ps, (2) 1800 K (a)1800 K – 2 ps, (b)1800 K – 200 ps, (3) 1850 K
(a)1850 K – 2 ps, (b)1850 K – 200 ps, (4) 1870 K (a)1870 K – 2 ps, (b)1870 K –
200 ps.
Fig. 3. Temperature evolution for a laser fluence of 60 J/m
2
(a) 10–18 ps, (b) 20–
200 ps.
C. Yang et al. / International Journal of Heat and Mass Transfer 55 (2012) 6060–6066
6063
According to the interface kinetic theory of solid–liquid phase
change [41], when the melt-solid interface moves with a finite
velocity, the temperature at the interface is expected to deviate
from the equilibrium melting temperature. The interfacial super-
heating/undercooling temperature at the interface:
D
T = T
eq
À T
int
,
is related to the interface velocity V
int
(T
int
)as[42,43]. Where T
eq
is
the equilibrium melting temperature, T
int
and V
int
are the interface
temperature and velocity respectively. When
D
T is small, V
int
, and
D
T at the interface can be approximated by a linear relation:
D
T ¼ C
1
V
int
ðT
int
Þð3Þ
The constant C
1
is material dependent.
D
T and V
int
can be obtained
by analyzing the MD results, therefore, allowing the determination
of the value of C
1
.
Relatively little work being done to determine the interface
velocity-superheating/undercooling function even for single-com-
ponent materials because of the technical difficulties in measuring
the interface temperature during rapid resolidification, however, in
order to analyze interface kinetics, the interface location and the
interface temperature need to be determined. The interface loca-
tion is determined by analyzing the atomic structure at a given
time. For example, Fig. 5(c) shows the atom distribution near the
surface for the laser fluence of 60 J/m
2
at 16 ps. It can be seen that
the melting interface lies at about 194.5 nm (1.05 nm from the sur-
face) which is the transition of crystal and liquid state silicon. The
temperatures of the interfaces at the crystal–liquid and liquid-
amorphous boundaries were determined by averaging the kinetic
energy of the atoms in a given slice. Therefore, the average temper-
ature of atoms between 194 nm and 195 nm is 2246 K, which is ta-
ken as the interface temperature. Similarly, the interface location
and the corresponding interface temperature are obtained for
other time steps during melting process, which are all higher than
the equilibrium melting temperature of 1780 K.
However, it is not possible to determine the interface location
by inspecting the atomic structure during resolidification process,
since the material can remain amorphous after resolidification, as
shown in Fig. 5(i). In order to distinguish the crystalline, liquid,
and amorphous silicon during and after resolidification process,
the radial distribution function (RDF) [16,34] is used. RDF [44–
46], with the ability to characterize the in-plane structure, is
becoming widely used in MD simulation to distinguish phases of
a material. It is a ratio of the number of atoms at a distance r from
a given atom compared with the average atomic number density in
an ideal crystal. RDFs for the three phases of silicon are shown in
Fig. 6, which are calculated from three different positions at z
directions at 30 ps, and each location is calculated using
216 atoms. The RDF of c-Si has periodic peaks which reflect the
crystalline structure. The long-range periodicity is the main char-
acteristic for ideal c-Si. Both l-Si and a-Si have similar long-range
disorders – no peaks for larger r. l-Si and a-Si are distinguished
by small differences in the shorter range. The RDF of a-Si has higher
first and second peaks than that of l-Si, and l-Si possesses the
smoothest RDF curve, which means more short-range disorders
in l-Si than that in a-Si. The difference in the RDF allows for the
determination of the location of interface at each time step during
the resolidification process. Compared with the existing methods
of solid–liquid interface location determination, such as, observing
Fig. 4. Temperature evolution for a laser fluence of 90 J/m
2
(a) 10–18 ps, (b) 20–
200 ps.
Fig. 5. Structural change at laser fluence of 60 J/m
2
at times of (a) 10 ps, (b) 14 ps,
(c) 16 ps, (d) 18 ps, (e) 20 ps,(f) 24 ps, (g) 40 ps, (h) 100 ps, and (i) 200 ps. The
average temperatures of the top 5 atomic layers are (a) 300 K, (b) 2065 K, (c)
2692 K, (d) 2286 K, (e) 2107 k, (f) 1928 K, (g) 1234 K, (h) 614 K, (i) 485 K.
6064 C. Yang et al. / International Journal of Heat and Mass Transfer 55 (2012) 6060–6066
the diffusion coefficients (via mean-square displacement data), the
three-body potential energy [18], and the fraction of solid atoms in
each layer [19,20]; or determining the order parameter of each
atomic slice (two-atomic-layers thick) and classifying a slice as
crystallike, liquidlike, or amorphouslike, [21], the RDF can give a
reasonable identification for the solid–liquid interface location
and is also a novelty proposed in this study compared with its rare
application for this purpose in the past.
Fig. 7(a) and (b) shows the solid–liquid interface locations dur-
ing melting and resolidification processes at the laser fluences of
60 J/m
2
and 90 J/m
2
, respectively. The interface velocities are taken
as the derivative of the interface locations, and are plotted in
Fig. 7(c) and (d). It is seen that the maximal melting depth is
reached rapidly at 23 ps and 23.6 ps for the two fluences, followed
by a relatively slower resolidification process. The interface tem-
peratures are plotted in Fig. 7(e) and (f). It is seen that for both
60 J/m
2
and 90 J/m
2
, the interface velocity and interface tempera-
ture have similar trends, indicating that the interface kinetics –
the interface velocity – temperature relation follows roughly a lin-
ear relation expressed by Eq. (3). Some deviations, particularly near
the end of the resolidification process (the velocity slows down to-
ward the end of the resolidification process while the temperature
continues to decrease) are probably due to the uncertainties in
determining the interface location accurately using the RDF meth-
od. It is also possible that the lower surface energy of solid slows
down the resolidification process when the interface approaches
the surface, which is not considered in the kinetic theory described
by Eq. (3). Please note here we did not discuss the possible impact
from the reflection of a pressure wave on the determination of
temperature, which can be eliminated through applying the nonre-
flective boundary condition to the bottom of the sample [34,35].
The reason is because we have used the structure change and RDFs
to track liquid–solid (crystal and amorphous) interfaces and the ef-
fect from the reflection of a pressure wave has been implicitly
included.
As seen in Fig. 5, the maximum melt depth is larger than the
thickness of the final amorphous layer. Therefore, resolidification
of liquid silicon first forms a layer of crystalline silicon, and then
amorphous silicon. This phenomenon can be correlated with the
MD results that the resolidification process is first a slower process
when it starts at the maximum melt depth and near the equilib-
rium melting temperature, and then accelerated as the tempera-
ture is reduced. The final microstructures and the computed
resolidification front velocity and temperature suggest a strong
correlation between the resolidification velocity and the resulting
microstructure, that a larger resolidification velocity results in an
amorphous state, and a smaller velocity results in a crystalline
state. And also the crystallization occurs in a shorter time with a
slower velocity and leads to thinner crystal silicon layer, while
the amorphization continues a longer time at faster velocity and
results in a thicker amorphous silicon layer.
Furthermore, the quantitative relationship between final state
of the material, amorphous and crystal, and the velocity of resolid-
ification interface has also been explored. The average velocity for
forming crystalline silicon is estimated to be about 74 m/s and
67 m/s for 60 J/m
2
and 90 J/m
2
, respectively, and the average veloc-
ity for forming amorphous silicon is 230 m/s and 120 m/s for 60 J/
m
2
and 90 J/m
2
, respectively. However, compared with experimen-
tal and simulation results of maximum crystallization velocity for
Si in some literatures [17,47–49], the results from our study are
very rough estimates as there are uncertainties to determine the
boundaries of the states.
4. Conclusions
In this work, molecular dynamics simulations were carried out
to explore interactions between ultrafast laser pulse and crystal-
line silicon. Solid–liquid phase change and the resulting structural
change were evaluated. It was found that the temperature at the
Fig. 6. The radial distribution functions of three phases of silicon with a laser
fluence of 60 J/m
2
. A. Crystalline RDF [z: 189.8–190.2 nm]; B. Amorphous RDF [z:
194.4–194.8 nm]; C. Liquid RDF [z: 194.8–195.2 nm].
Fig. 7. The solid–liquid interface location, velocity, and temperature as a function of
time at a laser fluence of (a), (c), (e) 60 J/m
2
, and (b), (d), (f) 90 J/m
2
.
C. Yang et al. / International Journal of Heat and Mass Transfer 55 (2012) 6060–6066
6065
solid–liquid melt front exceeded the equilibrium melting temper-
ature by several hundred degrees during melting, and was lower
than the equilibrium temperature by several hundred degrees dur-
ing resolidification. This interface superheating and undercooling
temperatures were correlated with the interface velocity, and were
consistence with the solid–liquid interface kinetic theory. Based on
the ability to characterize phases of a material, the RDF was at-
tempted to be used to determine the interface location of crystal-
line-liquid and liquid-amorphous silicon during resolidification
and gives a reasonable identification. The resolidification process
first produced thinner crystalline silicon layer due to the relatively
low resolidification speed in a shorter time, and then thicker amor-
phous silicon layer as the resolidification speed increases within a
longer time. Divergence between our results and previous experi-
mental and simulation results [17,47–49] through the quantitative
comparison reflects the results from our study are very rough esti-
mates as there are uncertainties to determine the boundaries of the
states.
Acknowledgements
The authors thank the partial support by the Panasonic Boston
Laboratory of Panasonic R&D Company of America. One of the
authors (C.Y.) is thankful for the fellowship provided by the Chi-
nese Scholarship Council.
References
[1] W. Heywang, K.H. Zaininger, Silicon: Evolution and Future of a Technology, in:
P. Siffert, E.F. Krimmel (Eds.), Silicon: The Semiconductor Material, Springer
Verlag, 2004.
[2] B.C. Stuart, M.D. Feit, A.M. Rubenchik, B.W. Shore, M.D. Perry, Laser-induced
damage in dielectrics with nanosecond to subpicosecond pulses, Phys. Rev.
Lett. 74 (12) (1995) 2248–2251.
[3] S. Nolte, C. Momma, H. Jacobs, A. Tünnermann, B.N. Chichkov, B.
Wellegehausen, H. Welling, Ablation of metals by ultrashort laser pulses, J.
Opt. Soc. Am. B 14 (10) (1997) 2716–2722.
[4] S. Preuss, A. Demchuk, M. Stuke, Sub-picosecond UV laser ablation of metals,
Appl. Phys. A 61 (1995) 33–37.
[5] P.L. Liu, R. Yen, N. Bloembergen, R.T. Hodgson, Picosecond laser-induced
melting and resolidification morphology on Si, Appl. Phys. Lett. 34 (1979) 864–
866.
[6] C.V. Shank, R. Yen, C. Hirlimann, Time-resolved reflectivity measurements of
femtosecond-optical-pulse-induced phase transitions in silicon, Phys. Rev.
Lett. 50 (1983) 454–457.
[7] M.C. Downer, R.L. Fork, C.V. Shank, Femtosecond imaging of melting and
evaporation at a photoexcited silicon surface, J. Opt. Soc. Am. B 2 (4) (1985)
595.
[8] T.Y. Choi, C.P. Grigoropoulos, Plasma and ablation dynamics in ultrafast laser
processing of crystalline silicon, J. Appl. Phys. 92 (9) (2002) 4918–4925.
[9] X. Xu, C. Cheng, I.H. Chowdhury, Molecular dynamics study of phase change
mechanisms during femtosecond laser ablation, J. Heat Transfer 126 (2004)
727–734.
[10] X. Wang, X. Xu, Molecular dynamics simulation of thermal and
thermomechanical phenomena in picosecond laser material interaction, Int.
J. Heat Mass Transfer 46 (2002) 45–53.
[11] L.V. Zhigilei, B.J. Garrison, Microscopic mechanisms of laser ablation of organic
solids in the thermal and stress confinement irradiation regimes, J. Appl. Phys.
88 (3) (2000) 1281–1298.
[12] L.V. Zhigilei, Dynamics of the plume formation and parameters of the ejected
clusters in short-pulse laser ablation, Appl. Phys. A 76 (2003) 339–350.
[13] T. Ikamoto, E. Ohmura, T. Sanno, Y. Morishige, I. Miyamoto, Analytical study on
metal microstructures using femtosecond laser, Appl. Phys. A 81 (2005) 639–
643.
[14] R. Fedosejevs, S.E. Kirkwood, R. Holenstein, N. Young, Y.Y. Tsui, Femtosecond
interaction processes near threshold: damage and ablation, Proc. SPIE 6403
(2007) 640302.1–640302.10.
[15] R.F.W. Herrmann, J. Gerlach, E.E.B. Campbell, Molecular dynamics simulation
of laser ablation of silicon, Nucl. Instrum. Methods Phys. Res., Sect. B 122
(1997) 401–404.
[16] L. Tian, X. Wang, Pulsed laser-induced rapid surface cooling and
amorphization, Jpn. J. Appl. Phys. 47 (2008) 8113–8119.
[17] Q.M. Yu, M.O. Thompson, P. Clancy, Solidification kinetics in SiGe alloys, Phys.
Rev. B 53 (1996) 8386–8397.
[18] M.J. Uttormark, S.J. Cook, M.O. Thompson, P. Clancy, Dissolution dynamics of
sub-critical clusters in liquid silicon, Mater. Res. Soc. Symp. Proc. 205 (1992)
417–422.
[19] Q.M. Yu, P. Clancy, Molecular dynamics simulation of crystal growth in
Si
1Àx
Ge
x
/Si (100) heterostructures, J. Cryst. Growth 149 (1995) 45–58.
[20] L.G. Wang, P. Clancy, M.O. Thompson, C.S. Murthy, Thermodynamic and kinetic
studies of laser thermal processing of heavily boron-doped amorphous silicon
using molecular dynamics, J. Appl. Phys. 92 (2002) 2412–2419.
[21] E.J. Albenze, M.O. Thompson, P. Clancy, Atomistic computer simulation of
explosive crystallization in pure silicon and germanium, Phys. Rev. B 70 (2004)
094110.1–094110.10.
[22] J.A. Yater, Ph.D. Thesis, Cornell University, Ithaca, New York, 1992.
[23] A. Borowiec, M. Mackenzie, G.C. Weatherly, H.K. Haugen, Transmission and
scanning electron microscopy studies of single femtosecond laser-pulse
ablation of silicon, Appl. Phys. A 76 (2003) 201–207.
[24] J. Bonse, K W. Brzezinka, A.J. Meixner, Modifying single-crystalline silicon by
femtosecond laser pulses: an analysis by micro Raman spectroscopy, scanning
laser microscopy and atomic force microscopy, Appl. Surf. Sci. 221 (2004) 215–
230.
[25] M.S. Amer, M.A. El-Ashry, L.R. Dosser, K.E. Hix, J.F. Maguire, B. Irwin,
Femtosecond versus nanosecond laser machining: comparison of induced
stresses and structural changes in silicon wafers, Appl. Surf. Sci. 242 (2005)
162–167.
[26] X. Wang, X. Xu, Molecular dynamics simulation of heat transfer and phase
change during laser material interaction, J. Heat Transfer 124 (2002) 265–274.
[27] F.H. Stillinger, T.A. Weber, Computer simulation of local order in condensed
phases of silicon, Phys. Rev. B 31 (1985) 5262–5271.
[28] S.J. Cook, P. Clancy, Comparison of semi-empirical potential functions for
silicon and germanium, Phys. Rev. B 47 (1993) 7686–7699.
[29] D.C. Rapaport, The Art of Molecular Dynamics Simulation, second ed.,
Cambridge University Press, 1995.
[30] C.F. Richardson, P. Clancy, Picosecond laser processing of copper and gold: a
computer simulation study, Mol. Simulat. 7 (1991) 335.
[31] S.J. Cook, P. Clancy, Impurity segregation in LennardJones A/AB
heterostructures. I. The effect of lattice strain, J. Chem. Phys. 99 (1993)
2175–2191.
[32] S.J. Cook, P. Clancy, Impurity segregation in LennardJones A/AB
heterostructures. II. The effect of impurity size, J. Chem. Phys. 99 (1993)
2192–2201.
[33] H. Balamane, T. Halicioglu, W.A. Tiller, Comparative study of silicon empirical
interatomic potentials, Phys. Rev. B 46 (1992) 2250–2279.
[34] C. Cheng, X. Xu, Molecular dynamics calculation of critical point of nickel, Int. J.
Thermophys. 28 (2007) 9–19.
[35] C. Cheng, X. Xu, Molecular dynamics simulation of ultrafast laser ablation of
fused silica, J. Phys. 59 (2007) 100–104.
[36] J.Q. Broughton, X.P. Li, Phase diagram of silicon by molecular dynamics, Phys.
Rev. B 35 (1987) 9120–9127.
[37] D.S. Ivanov, L.V. Zhigilei, Effect of pressure relaxation on the mechanisms of
short-pulse laser melting, Phys. Rev. Lett. 91 (2003) 105701.1–105701.4.
[38] D.S. Ivanov, L.V. Zhigilei, Combined atomistic-continuum model for simulation
of laser interaction with metals: application in the calculation of melting
thresholds in Ni targets of varying thickness, Appl. Phys. A 79 (2004) 977–981.
[39] B.J. Thijsse, Relationship between the modified embedded-atom method and
Stillinger–Weber potentials in calculating the structure of silicon, Phys. Rev. B
65 (2002) 195207.1–195207.5.
[40] J P. Hansen, L. Verlet, Phase transitions of the Lennard-Jones system, Physiol.
Rev. 184 (1969) 151–161.
[41] K.A. Jackson, in: R. Ueda, J.B. Mullin (Eds.), Crystal Growth and
Characterization, North-Holland, Amsterdam, 1975, p. 21.
[42] X. Xu, C.P. Grigoropoulos, R.E. Russo, Heat transfer in excimer laser melting of
thin polysilicon layers, J. Heat Transfer 117 (1995) 708–715.
[43] X. Xu, G. Chen, K.H. Song, Experimental and numerical investigation of heat
transfer and phase change phenomena during excimer laser interaction with
nickel, Int. J. Heat Mass Transfer 42 (1999) 1371–1382.
[44] M.P. Allen, D.J. Tildesley, Computer Simulation of Liquids, Clarendon Press,
Oxford, 1987.
[45] X. Wang, Thermal and Thermomechanical Phenomena in Laser Material
Interaction, Ph.D. thesis, Purdue University, West Lafayette, Indiana (2001).
[46] D.K. Chokappa, S.J. Cook, P. Clancy, Nonequilibrium simulation method for the
study of directed thermal processing, Phys. Rev. B 39 (1989) 10075–10087.
[47] M.O. Thompson, J.W. Mayer, A.G. Cullis, H.C. Webber, N.G. Chew, J.M. Poate,
D.C. Jacobson, Silicon melt, regrowth, and amorphization velocities during
pulsed laser irradiation, Phys. Rev. Lett. 50 (1983) 896–899.
[48] P.A. Stolk, A. Polman, W.C. Sinke, Experimental test of theories for
heterogeneous freezing kinetics in silicon, Phys. Rev. B 47 (1993) 5.
[49] A. Polman, P.A. Stolk, D.J.W. Mous, W.C. Sinke, C.W.T. Bulle-Lieuwma, D.E.W.
Vandenhoudt, Pulsed-laser crystallization of amorphous silicon layers buried
in a crystalline matrix, J. Appl. Phys. 67 (1990) 4024.
[50] M.E. Wieser, Atomic weights of the elements 2005 (IUPAC TECHNICAL
REPORT), Pure Appl. Chem. 78 (2006) 2051–2066.
[51] J. Meijer, Laser beam machining (LBM), state of the art and new opportunities,
J. Mater. Process. Tech. 149 (2004) 2–17.
6066 C. Yang et al. / International Journal of Heat and Mass Transfer 55 (2012) 6060–6066