mechanisms of absorption in pulsed excimer laser induced plasma
Bạn đang xem bản rút gọn của tài liệu. Xem và tải ngay bản đầy đủ của tài liệu tại đây (278.27 KB, 9 trang )
Appl. Phys. A 65, 477–485 (1997)
C
Springer-Verlag 1997
Mechanisms of absorption in pulsed excimer laser-induced plasma
K.H. Song, X. Xu
∗
School of Mechanical Engineering, Purdue University, West Lafayette, IN 47907, USA
(Fax: +1-765/494 05 39, E-mail: )
Received: 20 January 1997/Accepted: 23 June 1997
Abstract. This work investigates the interaction between
pulsed excimer laser-induced plasma and an excimer laser
beam. The optical transmissivity through the laser-induced
plasma and the velocity of the plasma front are measured
within the duration of the laser pulse. Based on the measured
velocity of the plasma front, an analysis of compressible gas
dynamics is used to compute the thermodynamic properties
of the plasma layer, including temperature, pressure, and the
number density of the laser-evaporated particles. The absorp-
tion coefficient of each absorption mode in the plasma is then
calculated from the thermodynamic properties. By comparing
the calculated and the measured transmissivity of the laser-
induced plasma, we have determined the dominant absorption
mechanism in the plasma plume to be photo-ionization at
laser intensities in the range 90–400 MW/cm
2
.
PACS: 52.40.Nk; 52.50.Jm; 79.20.Ds
High-power excimer lasers are being used in a variety of
applications, including pulsed laser deposition of thin films
and laser-assisted machining. During these processes, the
laser beam evaporates and ionizes the target material, creat-
ing a plasma plume above the target surface. Understanding
the transport process of the laser beam in the laser-induced
plasma plume is essential for controlling the interaction of
the laser and the materials being used, and for optimizing
the high-power laser processes. The objective of this work
is to determine experimentally the optical absorption coeffi-
cient of the laser-induced plasma. Further, attempts are made
to understand the absorption mechanism in the laser-induced
plasma.
There are several reports on the optical properties of the
laser-induced plume [1–3]. Most of the reported work has
studied the optical properties of the laser-induced plasma in
the period of time after the laser pulse is terminated. At sev-
eral microseconds after the laser pulse, the physical dimen-
sion of the plume is large enough so that a probing light-
source can pass through the plasma plume and detect its
∗
To whom all correspondence should be addressed
properties.On the otherhand, understandingthe laser–plasma
interaction requires measurements of the optical properties of
the plume within the duration of the laser pulse. The small
dimension of the plasma layer before the termination of the
laser pulse (less than a few hundred microns) is a major ob-
stacle for performing diagnostic measurements. In this work,
an experimental technique is developed to measure the tran-
sient optical properties of the laser-induced plasma before the
termination of the laser pulse.
In order to analyze the absorption mechanisms of the
laser-induced plasma, its thermodynamic properties, includ-
ing temperature, pressure, and the number density of the
laser-evaporated particles need to be known. Theoretical ab-
sorption coefficients of each absorption mode (photo- ion-
ization, inverse bremsstrahlung, etc.) can be calculated from
the thermodynamic properties, and can therefore be com-
pared with the measured values in order to reveal the absorp-
tion mechanisms in the plasma. However, the thermodynamic
properties of the laser-induced plasma are not readily mea-
surable within the laser pulse. These properties are normally
inferred from experimentaldata obtained after the laser pulse.
In this work, the velocity of the laser-induced plasma is meas-
ured during the laser pulse. The thermodynamic properties
are then calculated from the measured plasma velocity using
a one-dimensional compressible gas dynamics analysis. This
approach is different from many reported analytical studies of
the laser-evaporationprocess [4–6], in which the gas dynamic
equations are solved togetherwith the energy equations in the
target by using the laser intensity as the input parameter. The
advantage of using the measured plasma velocity as the input
parameter is that it does not require thermophysical prop-
erties and target surface conditions (temperature-dependent
absorption coefficient, surface morphology, etc.), which are
normally difficult to obtain. It is also shown in this work that
the “abnormal” characteristics of the laser-evaporated plume
are not readily predictable by the combined thermal and gas
dynamics analysis.
The transient velocity of the laser-induced plasma is
measured using the optical deflection technique. This method
is chosen because other techniques, including high-speed
photography, streak photography and the shadow graphic
478
method, are only capable of capturing the image of a plume
with large physical dimension. On the other hand, the opti-
cal deflection technique has a spatial resolution of the order
of the width of a focused probing laser beam, which is about
10 µm in this work. The optical deflection technique senses
the refractive index discontinuity caused by the laser-induced
shock-wave and vapor, and thus it measures the transient lo-
cations as well as the velocity of the shock front and the vapor
front.
The absorption coefficients of each absorption mode are
estimated using the thermodynamic properties obtained from
the gas dynamics analysis. Comparison between the meas-
ured and the calculated transmissivity allows determination
of the absorption mechanisms in the laser-induced plasma.
The laser intensity used in this work is limited in the range
between 90 MW/cm
2
and 400 MW/cm
2
(2–11 J/cm
2
for
a laser pulse with FWHM of 26 ns).Nickelisusedasthe
specimen.
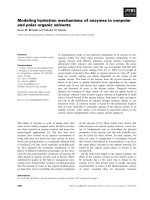
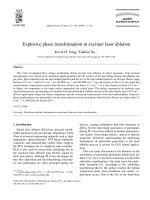
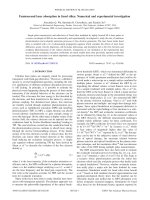
1 Experimental descriptions
Figure 1 shows the experimental setup for measuring the ve-
locity of the laser-induced plasma. The KrF excimer laser has
a wavelength at 248 nm and a pulse width of 26 ns (FWHM).
The center, uniform portion of the excimer laser beam pass-
es through a rectangular aperture (10 mm×5mm) to produce
a laser beam with a uniform intensity profile. The rectan-
gular laser beam is focused onto the nickel specimen and
evaporates the target surface. (The laser-evaporated surface
was examined under an optical microscope, and the central
90% of the laser-irradiated area was found to be uniform.)
The laser intensity is changed by varying the distance be-
tween the lens and the target surface. The probing laser for
the optical deflection measurement is a 5mW,He−Ne laser
with a wavelength at 633 nm.TheHe−Ne laser beam is fo-
cused to a 10 µm spot above the nickel target surface, and
its intensity is measured by a photodiode. A narrow-band fil-
ter at the He−Ne laser wavelength is positioned in front of
the detecting photodiode to eliminate the plasma emission.
The laser-induced shock wave and the vapor front deflect the
He−Ne laser beam, which is sensed by the photodiode and
recorded on the oscilloscope. The oscilloscope, triggered by
Fig.1. Setup for the optical deflection measurement of the velocity of the
laser-induced plasma front and shock front
the laser pulse, measures the time lapse between the begin-
ning of the laser pulse and the fluctuations of the probing
beam.
The distance between the probing He−Ne laser beam and
the specimen surface is adjusted by an x–y micrometer-stage
from near zero to 500 µm. At different distances, the arrival
times of the shock front and the vapor front are recorded. The
measured distance–time relations are the transient locations
of the shock front and the vapor front. The velocities of the
shock wave and the vapor front are calculated by taking the
time derivative of the transient locations. The optical compo-
nents for focusing and detecting the He−Ne laser beam are
set on a motion stage so that they are unaltered while the
distance between the target surface and the probing beam is
adjusted. Also, the excimer laser-focusing lens and the tar-
get are set on another one-motion stage so that adjusting the
distance between the probing beam and the target surface
would not change the intensity of the excimer laser beam at
the target surface. The width of the nickel specimen is about
100 µm. This is to ensure that the width of the specimen is
shorter than the depth of focus of the probing beam.
Figure 2 shows the experimental setup for measuring the
transient transmissivity of a thin plasma layer with a thick-
ness as small as a few micrometers. A probing beam is split
from the excimer laser beam by a CaF
2
plate, and is directed
to the center of the specimen by a dielectric mirror. The speci-
men is a 5 µm-thick, free-standing nickel foil. To measure the
transmissivity of a thin plasma layer, a circular pinhole with
a diameter, d of 10 µm to 12 µm is fabricated at the center of
the specimen. The transmission of the probing beam through
the pinhole is measured. If the plasma layer is thicker than
δ tan(θ) −d, the entire probing laser beam passes through the
plasma layer, and the path length of the probing beam in
the plasma can be determined using straightforward geom-
etry manipulations. Here d, δ and θ denote the thickness of
the nickel film, the diameter of the pinhole, and the angle of
the probing beam measured from the normal direction of the
specimen, respectively. For a 5 µm-thick film with a pinhole
diameter of 10 µm, and at the probing beam angle of 45
◦
,
transmission of the plasma layer with a minimum thickness of
5 µm (δ tan(θ) −d) can be measured.
To reduce and eliminate signals from plasma emissions,
the transmitted light is passed through a monochromator with
a minimum wavelength bandwidth of 0.1nm. The experiment
verified that plasma emissionis negligible when the minimum
Fig. 2. Setup for the measurement of transient transmissivity of the laser-
induced plasma
479
bandwidth of the monochromator is used – when the prob-
ing beam is blocked, the measured signal is at the noise level.
A photomultiplier tube (PMT) is used to capture the transmit-
ted light through the monochromator and record the transient
intensity of the probing beam on an oscilloscope.
2 Calculation of the absorption coefficient of the
laser-induced plasma
Analysis of the absorption coefficient of the laser-induced
plasma requires thermodynamic properties of the laser-
induced plasma. Based on the measured velocity of the
laser-induced plasma, compressible gas dynamics is used
to calculate the thermodynamic properties. The discontinu-
ity above the target surface is treated using the Moth-Smith
method [7,8]. Figure 3 describes the one-dimensional flow of
the laser-inducedplume. The vertical axis represents the pres-
sure distribution in different regions of the flow as a function
of the distance from the target surface. Laser-evaporated par-
ticles are not in gas-dynamic equilibrium when they leave the
target surface [9]. These particles form a Knudsen layer (KL),
region I, where they establish thermodynamic equilibrium
through collisions. The one-dimensional vapor flow after the
Knudsen layer is described differently according to the Mach
number of the flow at the exit of the Knudsen layer, that is,
M
KL
< 1orM
KL
=1 [5,7]. Calculations have shown that, for
the laser intensities used in this work, the Mach number at the
exit of the Knudsen layer equals unity. Therefore, the Knud-
sen layer, the rarefaction expansion region, the uniform vapor
region, the compressed air region, and the ambient air region
are formed successively from the surface, as shown in Fig. 3.
Using the measured velocity of the laser-induced plume as
the input to the gas dynamics model, the temperature, the
pressure and the number density in each region can be cal-
culated. Detailed procedures of the gas dynamics calculations
are shown in the Appendix to Section 2 of this paper.
The thermodynamic properties obtained from the gas
dynamics calculations are used to determine the absorp-
tion mechanisms in the laser-induced plume. Two differ-
ent absorption mechanisms are considered, namely photo-
ionization and photon–electron inverse-bremsstrahlung;other
absorption processes have much smaller absorption coeffi-
cients for the laser intensity range used in this work [10].
Fig.3. Schematic regimes of vapor expansion: I: Knudsen layer, II: rarefac-
tion expansion region, III: uniform vapor region, IV: compressed air, and V:
ambient air
The absorption coefficient of the photo-ionization process
is calculated as in [10]:
κ
PI
=
∞
n
N
n
σ
νn
=
∞
n
7.9 ×10
−18
I
H
nhν
3
N
1
×exp
−
I
H
k
B
T
1−
1
n
2
cm
−1
, (1)
where N
n
and σ
νn
are the number density and the cross-
section at the energy level n, respectively. N
1
is the atom
number-density at the ground state, I
H
the ionization poten-
tial, n the electronic energy level in the atomic structure, ν the
frequency of the photon, k
B
the Boltzmann’s constant, and h
Planck’s constant. The summation is performed over the en-
ergy levels where the electron-binding energy is less than the
photon energy of the excimer laser, since the ionization po-
tential of nickel (7.635 eV) is higher than the photonenergy of
the excimer laser beam (5.0eV). Multiple photon absorption
or photo-ionization of ions is much less probable, therefore,
is not considered in the calculation. With the temperature
obtained from the gas dynamics analysis, the absorption coef-
ficient of the photo-ionization process can be calculated from
(1).
The inverse-bremsstrahlung absorption coefficient of an
electron gas with a Maxwellian velocity distribution and a ki-
netic temperature T
e
, is given [11] by:
κ
ν
= (3.69×10
8
)
Z
3
N
+
N
e
T
1/2
e
ν
3
g
ff
cm
−1
, (2)
where g
ff
is the gaunt factor, which is assumed to be unity by
Kramer’s rule [11]. Usually, the number density of electrons,
N
e
, and the number density of ions, N
+
, are set to be equal,
and the charge number, Z, is set to be 1.
The electrons participating in the inverse-bremsstrahlung
absorption process are generated by both thermal ionization
as well as photo-ionization. The number density of electrons
due to thermal ionization is calculated by the Saha Equa-
tion [12]:
N
+
N
e
N
= 2
2πmk
B
T
h
2
3/2
U
+
U
exp
−
I
H
k
B
T
, (3)
where the electronic partition function of ions, U
+
,is1,m
is the atomic mass, and the electronic partition function of
electrons, U, is given by [10]:
U =
∞
n
2n
2
exp
−
I
H
Z
2
k
B
T
1−
1
n
2
(4)
The electrons generated by the photo-ionization process
are not in thermal equilibrium, and the recombination process
reduces the number densities of electrons and ions generated
by photo-ionization. The rate of recombination is determined
by the relaxation (recombination) time constant, t
r
. When the
relaxation time constant is comparable to or longer than the
duration of the laser pulse, the electrons generated by the
photo-ionization process also contribute to photon–electron
inverse-bremsstrahlung absorption. Therefore, this relaxation
time constant needs to be evaluated, which is estimated [10]
480
as:
t
r
=
1
2.7 ×10
−13
Z
2
T
−3/4
N
e
. (5)
The number densities of electrons and ions generated by
photo-ionization at time t can be calculated as:
N
e
=
1
hν
t
0
κ(ξ)l(ξ)I(ξ) exp(−ξ/t
r
) dξ, (6)
where κ and l are the absorption coefficient and the thick-
ness of the laser-induced plasma, respectively, I is the laser
intensity, and hν the energy of each photon. The sum of
the electron number densities calculated from (3) and (6)
is used in (2) to calculate the absorption coefficient of the
inverse-bremsstrahlung process. The total absorption co-
efficient of the laser-induced plume is the summation of
the photo-ionization absorption coefficient and the inverse-
bremsstrahlung absorption coefficient calculated from (1) and
(2), respectively.
This calculated total absorptioncoefficient is used to com-
pute the transmissivity of the laser beam in the laser-induced
plasma. The transmissivity τ and the absorption coefficient κ
are related by Beer’s law, since scattering of the laser beam by
the plume has been determined to be negligible [13]. Thus:
τ = exp
(
−κ
total
l/ cos(θ)
)
, (7)
in which, l is the thickness of the plasma layer, and θ is the an-
gle of incidence of the probing laser beam in the transmissiv-
ity measurement. The calculated and measured transmissivity
are compared, and the comparison reveals the viability of the
theoretical calculations and the absorption mechanism in the
laser-induced plasma.
3 Results and discussions
3.1 Results of the plasma velocity measurement
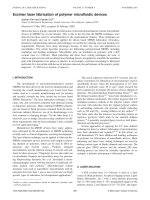
Figure 4 shows the signal recorded in the plasma-velocity
measurement, as the laser-induced shock-front and the plas-
ma deflect the probing beam. The data is obtained when
the focal point of the probing beam is located 280 µm
Fig.4. Signal recorded in the optical deflection experiment The probing
beam is at a distance of 280 µm from the surface and the laser intensity is
404 MW/cm
2
above the target surface, and the excimer laser intensity is
404 MW/cm
2
. The excimer laser is fired at time zero. The
intensity of the probing laser beam shows two fluctuations,
at 32 ns and 36 ns. The charakteristics of the two fluctua-
tions are different:the first fluctuationdisappears within a few
nanoseconds but the second fluctuation stays at a reduced
level for a period longer than 200 ns (not completely shown
in Fig. 4). Thus, the first fluctuation is caused by the shock
wave, which is a thin layer of discontinuity in the optical re-
fractive index [14], and the second fluctuation is caused by the
laser-induced plasma plume. The time lapse between these
two fluctuations is only 4ns, indicating that the distance be-
tween the shock front and the vapor front is small. In fact,
when the probing beam is located at distances closer to the
target surface (less than 100 µm), these two fluctuations are
indistinguishable since the distance between the shock front
and the vapor front is less than the measurement resolution.
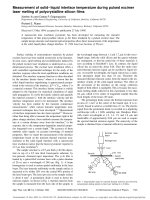
Figure 5 shows the transient locations of the plasma front
at different laser intensities. At a given time, the plasma pro-
duced at a higher laser intensity travels farther away from the
target surface than the plasma produced at a lower laser inten-
sity. The velocity of the plasma front calculated from Fig. 5
is shown in Fig. 6. The measured vapor front velocities are
of the same order of magnitude as other reported measure-
ment or simulation results [15,16]; however, our result also
shows that, within different laser-intensity ranges, the plas-
ma velocity varies differently with the laser intensity. For the
two lowest laser intensities, 95 MW/cm
2
and 163 MW/cm
2
,
the location of the plasma front varies almost linearly with
the laser intensity: after 13.4ns the plasma fronts produced
at intensities of 95 MW/cm
2
and 163 MW/cm
2
are, respec-
tively, located at 20 µm and 35µm. At the laser intensities
between 199 MW/cm
2
and 348 MW/cm
2
, the differences in
the plasma front locations are small. At the highest laser in-
Fig. 5. Transient locations of the laser-induced plasma front
Fig. 6. Plasma front velocity at the end of the laser pulse (50 ns)
481
tensity, 404 MW/cm
2
, the plasma front location is further
away from those at lower laser intensities. For each laser in-
tensity, the velocity of the plasma front decreases slightly
within the duration of the laser pulse. The uncertainties of
measuring the vapor front location and time are, respectively,
1 µm and 0.5ns.
The time lapse between the beginning of the laser pulse
and the onset of evaporation was also measured. When the
probing beam is located at the target surface, the recorded
time of the probing-beam fluctuation indicates when the plas-
ma is generated. The onset of evaporation at different laser
intensities also shows three distinctive regimes, as shown
in Fig. 7. For the first two laser intensities, 95 MW/cm
2
and 163MW/cm
2
, the plume is generated at 17.8ns and
12.1nsrespectively. For the next four laser intensities, vary-
ing between 199 MW/cm
2
and 348MW/cm
2
, the plume-
generation times are almost identical, ranging between 4.5ns
and 4.2ns. For the highest laser intensity, 404 MW/cm
2
,the
plume is generated at 2.2ns. The uncertainty of this measure-
ment is determined by the time resolutionof the oscilloscope,
0.5ns.
The result of this velocity measurement suggests that
there are different laser–target coupling mechanisms with-
in the laser-intensity range used in this work. Although the
plume expansion results from both the laser–target and the
laser–plume interactions, generation of plume depends solely
on the laser–target interaction. At low intensities, the onset of
evaporation decreases linearly with laser intensity, indicating
that thermal evaporation (heterogeneous bubble nucleation)
occurs at the target surface. This is because the time required
to reach the evaporation temperature decreases almost lin-
early with the laser intensity when the liquid/vapor phase
transformation occurs at the material’s surface. For medi-
um laser intensities (199–348MW/cm
2
), the phase-change
mechanism could be in transition from the heterogeneous
bubble nucleation to the explosive superheating phase trans-
formation [17,18]. The explosive phase-change occurs when
the temperature of the material is raised rapidly close to the
critical point and thus the material is abruptly evaporated.
In this case, the absorbed laser energy is conducted to the
molten pool, heating the melt to the temperature near the
critical point and inducing explosive evaporation. When the
laser intensity varies from 348 MW/cm
2
to 404 MW/cm
2
,
the plume generation time is reduced by half. This suggests
the explosive phase change dominates the evaporation mech-
anism when the laser intensity is higher than 350MW/cm
2
– it takes a shorter period of time for the molten material
to reach the critical temperature when the laser intensity is
Fig.7. Onset of the laser-induced plasma
above a certain value. However, more experimental evidence,
such as surface temperature measurement, is needed to verify
the above assumptions concerning the mechanisms of high-
power laser evaporation processes.
3.2 Results of the transmissivity measurement
Figure 8 shows a pair of reference and transmission signals
when the laser intensity is at 163MW/cm
2
. The reference
signal is obtained by recording the probing signal going
through the pinhole in the specimen (Fig. 2) while the ab-
lation laser beam is blocked from the target surface. The
transmission signal is the intensity of the probing beam when
the probing beam passes through the laser-induced plasma
layer. The negative voltage results from the PMT circuit. The
total time duration of the measurement is the laser-pulse du-
ration, which is approximately 50 ns with FWHM of 26 ns.
Both the transmission and the reference signals appear rather
smooth. This is because of the relatively short time-resolution
of the PMT used in this work, which is 3ns. The ratio be-
tween the transient transmission and the reference signals is
the transient transmissivity of the plasma at the incident laser
intensities.
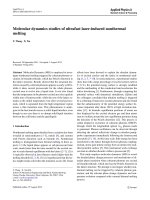
Figure 9 shows the transient transmissivity of the plasma
layer at different laser intensities. The transmissivity remains
at unity for the first several nanoseconds, which corresponds
to the time period before the generation of the plume. The
plasma-generation time obtained in this experiment matches
that measured by the optical deflection technique (Fig. 7). For
a certain laser intensity, the transmissivity of the plume de-
creases with time. The variation of transmissivity with laser
intensity also shows three regions: the transmissivities are al-
most identical for the laser intensities between 199 MW/cm
2
Fig. 8. Reference and transmission signals in the transmissivity measure-
ment
Fig. 9. Transient transmissivity of the laser-induced plasma
482
and 348 MW/cm
2
, and this laser intensity range corresponds
to the same ranges in which the plasma velocity and the onset
of evaporation change little with laser intensity. As shown in
Fig. 9, the uncertainty in measuring the transmissivity is small
before 40 ns, while fluctuations can be seen between 45ns
and 50 ns due to the weak probing signals near the end of the
laser pulse.
The plasma velocity and transmissivity depend strongly
on the conditions at the target surface. The optical character-
istics of the surface, including diffuse reflectivity and specu-
lar reflectivity, were measured [13]. The energy of the laser
beam absorbed and scattered by the plasma, and the energy
absorbed and scattered at the target surface, have also been
measured. These measurement results were used in a radia-
tive transfer analysis to reveal the amount of laser energy
absorbed by the target, absorbed by the plasma, and lost to
the ambient atmosphere through plasma scattering and sur-
face reflection. Detailed results have been presented else-
where [13].
3.3 Results of the gas dynamics analysis
The measured plasma front velocity is used as the input pa-
rameter in the gas dynamics analysis to calculate the ther-
modynamic properties of the laser-induced plume. Figure 10
shows the calculated temperature, pressure and number den-
sity at the target surface and in the plasma plume, with laser
intensities between 95 MW/cm
2
and 404 MW/cm
2
.Theve-
locity at the end of the laser pulse is used in this calculation;
the thermodynamic parameters shown in Fig. 10 therefore
represent the values at the end of the laser pulse. The sub-
scripts ’s’ and ’v’ in the key to the graphs denote the param-
eters at the target surface and in the vapor, respectively.
Fig.10. Results of gas dynamics calculations
The temperature, pressure and number density increase
rapidly when the laser beam intensity is increased from
95 MW/cm
2
to 199MW/cm
2
, and from 348 MW/cm
2
to
404 MW/cm
2
. However, variations of these parameters
are small when the laser beam intensity varies between
199 MW/cm
2
and 348 MW/cm
2
.
It should be noticed that the surface temperature is near
the critical temperature for nickel (7180 K [17]) at the two
lowest laser intensities, and is higher than the critical tem-
perature at higher laser intensities. Such high temperatures
were also obtained by others, who used a similar method [5,
19]. The calculated surface temperatures agree qualitative-
ly with the assumptions on the mechanisms of laser-induced
evaporation. Based on the measurements of the onset of
evaporation, it is assumed that the target surface undergoes
heterogeneous boiling at low laser intensities, and reaches
critical temperature and induces homogeneous boiling (ex-
plosive evaporation) at high laser intensities. Again, further
investigation is needed to verify the assumptions on the laser-
evaporation mechanisms.
The absorption coefficients of the photo-ionization and
the inverse-bremsstrahlung processes are calculated using
the procedures described in Sect. 2. Figure 11 shows the
electron number density, the ionization ratio, and the ab-
sorption coefficients of the photo-ionization and the inverse-
bremsstrahlung processes. The electron number density
shown in the figure is the total electrons generated by both the
thermal ionization process and the photo-ionizationprocess at
the end of the laser pulse (50ns). The calculation shows that
the electron-to-neutral ratio (the ionization ratio) at the end of
the laser pulse is rather small, varying from less than 0.1%at
95 MW/cm
2
to a few percentage points at 404 MW/cm
2
.
Fig. 11. Calculated electron number density, ionization ratio and absorption
coefficient at different laser intensities
483
In Fig. 11, the absorption coefficients by inverse brems-
strahlung and photo-ionization are calculated using (2) and
(1). The inverse-bremsstrahlung absorption coefficient, κ
IB
,
increases by six orders of magnitude within the laser inten-
sity range used in this work. This is because the inverse-
bremsstrahlung process depends on the number density of
electrons in the plasma, which varies exponentially with the
temperature of the plasma. On the other hand, the photo-
ionization absorption coefficient, κ
PI
, increases less than one
order of magnitude since it is directly proportional to the
number density of neutrals, which does not vary drastically
with laser intensity. It can thus be seen that, compared with
the absorption coefficient of photo-ionization, the absorption
coefficient due to inverse bremsstrahlung is several orders of
magnitude smaller. Clearly, the photo-ionization absorption
process is the dominant absorption mechanism within this
laser intensity range.
3.4 Comparison between the results of gas dynamics
calculations and the results of experimental
measurements
A direct comparison between the measured and the calcu-
lated values is needed to verify the calculation results. In
this work, the measured transmissivity of the laser-induced
plasma is compared with the value calculated from the total
absorption coefficient. The comparison between the meas-
ured and the calculated transmissivity at the end of the laser
pulse is shown in Fig. 12. Although a number of assump-
tions and simplifications have been made in calculating the
thermodynamic properties and the theoretical absorption co-
efficients, it can be seen that the calculated transmissivity
generally matches the measured value. In the middle range
of the laser intensities, the calculated and measured trans-
missivities show good agreement, while for the low laser
intensities, the differences are noticeable. For the whole laser
intensity range, the calculation predicts higher transmissivity
values than the measurement, indicating that the calculation
has not accounted for other extinction mechanisms of the
laser beam in the plume as well as any inaccuracy in the
model for computing the thermodynamic properties of the
plume.
Another possible reason for the calculated transmissivity
being higher than the measured value is that the thickness of
the plasma layer might be increased by plasma filling the di-
agnostic pinhole or even penetrating to the rear side of the
specimen. The numberdensity of the vapor at the back side of
Fig.12. Comparison between the calculated and the measured transmissivi-
ty at t = 50 ns
the specimen is expected to be small since the vapor diffuses
into a larger space. Therefore, the effect of plasma pene-
trating through the pinhole can be neglected. On the other
hand, it is possible that the pinhole is filled with plasma at
the end of the laser pulse, when the calculated and meas-
ured data are compared. At the end of the laser pulse, the
measured thickness of the plasma at the front side of the spec-
imen varies from about 50 µm at the lowest laser intensity,
to about 400 µm at the highest laser intensity (Fig. 5). Since
the thickness of the specimen is only 5 µm, neglecting filling
of the plasma in the pinhole would cause a maximum error
of 10% when calculating the thickness of the plasma, corre-
spondingto a 1% error in the transmissivity calculation. Thus,
the effect of plasma filling the pinhole is judged to be negligi-
ble.
4 Conclusions
Interaction between the laser-induced plasma plume and the
laser beam was investigated by optical measurements of
the plasma velocity and transmissivity. The thermodynam-
ic properties, including the plume temperature, pressure, and
the number density of total particles, were estimated using
a one-dimensional gas dynamics analysis, with the meas-
ured plasma velocity as the input parameter. The mechanisms
of laser–plasma interaction were assessed by calculating
the absorption coefficients of photo-ionization and inverse-
bremsstrahlung processes. It was found that, within the laser
fluence range used in this work, photo-ionization was the
dominant absorption process. Computations of the thermo-
dynamic parameters and the absorption coefficients were
verified by comparing calculated and measured transmissiv-
ities.
It was also found that the vapor-frontvelocity, the onset of
vaporization and the plasma transmissivity did not vary lin-
early with the laser beam intensity. Within the range of laser
intensity, 200–350 MW/cm
2
, these three parameters did not
change significantly. This result suggests that there are differ-
ent mechanisms governing the removal process of the target
material. Further investigations are necessary to understand
fully the different ablation phenomena.
Appendix to Section 2: Gas dynamics analysis of the laser-
induced plume
The velocity distribution of thermally evaporated particles is
described by the Maxwellian distribution function [9]:
f
+
sur
= n
sur
m
Ni
2πk
B
T
sur
3/2
E
j/2−1
I
Γ( j/2)(k
B
T
sur
)
j/2
×exp
−
1
k
B
T
sur
m
Ni
2
(v
2
x
+v
2
y
+v
2
z
) +E
I
for v
x
≥ 0, −∞ < v
y
, v
z
< +∞. (A.1)
Here E
I
is the total energy of the gas, j is the number of in-
ternal degree of freedom, and Γ is the gamma function. The
484
velocity distribution at the exit of the Knudsen layer is de-
scribed by a displaced Maxwellian distribution function [9]:
f
±
KL
= n
KL
m
Ni
2πk
B
T
KL
3/2
E
j/2−1
I
Γ( j/2)(k
B
T
KL
)
j/2
×exp
−
1
k
B
T
KL
m
Ni
2
(v
x
−u
KL
)
2
+v
2
y
+v
2
z
+ E
I
for −∞<v
x
, v
y
, v
z
<+∞, (A.2)
where u
KL
is the velocity of the plume at the exit of the Knud-
sen layer and f
±
KL
is the velocity distribution function with
both positive and negative directions. For back-scattering of
the evaporated particles, the velocity distribution function of
particles at the target surface is
f
sur
=
f
+
sur
v
x
> 0
β f
±
KL
v
x
< 0
, (A.3)
where β is solved by the mass-conservation requirement. The
conservation equations of mass, momentum and energy are
used to establish the relationship between the thermodynamic
properties at the target surface and at the exit of the Knudsen
layer [7, 8]:
T
KL
T
sur
=
1+π
γ
Ni
−1
γ
Ni
+1
α
2
2
1
2
−
√
π
γ
Ni
−1
γ
Ni
+1
α
2
2
,
(A.4a)
KL
sur
=
N
KL
N
sur
=
T
KL
T
sur
1
2
α
2
1
2
e
α
2
erfc(α) −
α
√
π
+
1
2
T
KL
T
sur
1−
√
παe
α
2
erfc(α)
, (A.4b)
α = M
KL
(γ
Ni
/2)
1/2
, and (A.4c)
β =
(2α
2
+1) −α
πT
KL
T
sur
1/2
e
α
2
KL
sur
T
KL
T
sur
1
2
,
(A.4d)
where the local sound velocity, a
KL
=
√
γ
Ni
k
B
T
KL
/m
Ni
M
KL
denotes the mach number which is the ratio of the local veloc-
ity, u
KL
, to the local sonic velocity, a
KL
. The ratio of specific
heat, γ
Ni
,is5/3since the plume is assumed to be a monatom-
ic ideal gas. T
KL
and
KL
are equal to T
rare
and
rare
[7].
The soundvelocityand pressure ratio across the isentropic
expansion region is [8]:
a
rare
a
uni
=
p
rare
p
uni
(γ
Ni
−1)/2γ
Ni
=
2
γ
Ni
+1
+
γ
Ni
−1
γ
Ni
+1
M
uni
(A.5)
The ratio of the sound velocity is directly related to the ratio
of the temperature since a =
√
γ
Ni
k
B
T/m
Ni
.
The compressed air region induces a shock wave that
propagates into the quiescent ambient air. The velocity of the
compressed air behind the shock wave is formulated by the
Rankine–Hugoniot equation [20]:
v
comp
= a
amb
p
comp
p
amb
−1
γ
air
1+
γ
air
+1
2γ
air
p
comp
p
amb
−1
(A.6a)
where γ
air
= 1.4 is the ratio of specific heats of air. The pres-
sure and the velocity in the uniform nickel vapor region and
in the compressed air region are assumed to be equal:
v
uni
= v
comp
and p
uni
= p
comp
(A.6b)
The gas dynamic parameters at the uniform vapor region,
such as M
uni
and p
uni
, are directly related to the ambient
air pressure, p
amb
, and the ambient sonic velocity, a
amb
,by
((A.6a) and (A.6b)):
p
uni
p
amb
=1+γ
air
M
uni
a
uni
a
amb
γ
air
+1
4
M
uni
a
uni
a
amb
+
1+
γ
air
+1
4
M
uni
a
uni
a
amb
2
(A.6c)
Using (A.1) to (A.6), the gas dynamic parameters in each
region can be evaluated with the measured velocity of the
vapor front as the known parameter. The procedures of the
calculation are as follows:
1. Assuming a value for T
uni
, and using the measured ve-
locity of v
uni
, the Mach number in the uniform vapor re-
gion is calculated from the definition: M
uni
= v
uni
/a
uni
=
v
uni
/
√
γ
Ni
k
B
T
uni
/m
Ni
. The pressure in the uniform vapor re-
gion is then calculated from (A.6c).
2. Using the thermodynamic properties obtained from step 1,
the thermodynamic ptoperties in the rarefaction region can be
calculated from (A.5).
3. Using the thermodynamic properties in the rarefaction re-
gion from step 2, the thermodynamic properties at the target
surface can be calculated from (A.4).
4. Iteration is carried out until the temperature and the
pressure at the surface, calculated from step 3, satisfy the
Clausius–Claypeyron equation:
p
sur
= exp
m
Ni
∆H
RT
b
1−
T
b
T
sur
(A.7)
where R is the universal gas constant, and ∆H is heat of fu-
sion.
Acknowledgements. Partial support of this work by the National Science
Foundation under the Grant no. CTS- 9624890 is greatly acknowledged.
References
1. T.E. Mills, P.J. Bishop, A. Mirnardi: AIAA J. Thermophysics Heat
Transfer 8, 223 (1994)
2. V.K. Goncharov, V.I. Karaban: Zhurnal Priklandnoi Spekroskopii 45,
22 (1986)
3. R.S. Patel, M.Q. Brewster: J. Heat Transfer 112, 170 (1990)
4. R.K. Singh, J. Narayan: Phys. Rev. B 41, (1990)
5. C.L. Chan, J. Mazumder: 1989 J. Appl. Phys. 62, 4579 (1987)
6. A. Vertes, R.W. Dreyfus, D.E. Platt: IBM J. Res. Develop. 38, 3 (1994)
7. C.J. Knight: AIAA J. Thermophysics Heat Transfer 17, 519 (1979)
485
8. M. Aden, E. Beyer, G. Herziger: J. Phys. D 23, 655 (1990)
9. R. Kelly, R.W. Dreyfus: Nucl. Instrum. Method Phys. Res. B 32, 341
(1988)
10. Y. Zel’dovich, Y. Raiser: Physics of Shock Waves and High-Temperature
Hydrodynamic Phenomena (Academic Press, New York and London,
1966)
11. L. Spitzer: Physics of Fully Ionized Gases, 2nd Ed. (John Wiley &
Sons, New York, 1962)
12. F. Chen: Introduction to Plasma Physics and Controlled Fusion,(Ple-
mon, New York, 1984)
13. X. Xu, K.H. Song: J. Heat Transfer, in press (1997)
14. A.M. Azzeer, A.S. Al-Dwayyan, M.S. A1-Salhi, A.M. Kamal, M.A. Harith:
Appl. Phys. B 63, 307 (1996)
15. D.B. Geohegan: Appl. Phys. Lett. 60, 22, 2732 (1992)
16. J.N. Leboeuf, K.R. Chen, J.M. Donato, D.B. Geohegan, C.L. Liu,
A.A. Puretzky, R.F. Wood: Appl. Surf. Sci. 96, 14 (1996)
17. M. Martynyuk: Russian J. Phys. Chem. 57, 4, 494 (1983)
18. A. Miotello, R. Kelly: Appl. Phys. Lett. 67, 24, 3535 (1995)
19. J.J. Chang, B.E. Warner: Appl. Phys. Lett. 69, 4, 473 (1996)
20. H.W. Leipmann, A. Roshko: Elements of Gas Dynamics, Ch. 1, (John
Wiley & Sons, New York, 1957)