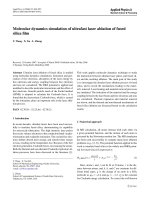
mechanisms of decomposition of metal during femtosecond laser ablation
Bạn đang xem bản rút gọn của tài liệu. Xem và tải ngay bản đầy đủ của tài liệu tại đây (390.8 KB, 15 trang )
PHYSICAL REVIEW B 72, 165415 ͑2005͒
Mechanisms of decomposition of metal during femtosecond laser ablation
Changrui Cheng and Xianfan Xu*
School of Mechanical Engineering, Purdue University, West Lafayette, Indiana 47907, USA
͑Received 2 July 2004; revised manuscript received 14 June 2005; published 17 October 2005͒
The mechanisms of decomposition of a metal ͑nickel͒ during femtosecond laser ablation are studied using
molecular dynamics simulations. It is found that phase explosion is responsible for gas bubble generation and
the subsequent material removal at lower laser fluences. The phase explosion process occurs as combined
results of heating, thermal expansion, and the propagation of tensile stress wave induced by the laser pulse.
When the laser fluence is higher, it is revealed that critical point phase separation plays an important role in
material removal.
DOI: 10.1103/PhysRevB.72.165415
PACS number͑s͒: 61.80.Az, 02.70.Ns, 79.20.Ds
I. INTRODUCTION
Pulsed laser ablation is the process of material removal
after the target is irradiated by intensive laser pulses. It is
now acknowledged that pulses with very short durations,
such as picosecond or femtosecond, are advantageous in
many applications.1 The short pulse duration confines heat
diffusion, which leads to high-quality machining. Sharpedged, clean and highly reproducible machining results have
been obtained using a femtosecond laser.2
Femtosecond laser ablation has become one of the most
intensively investigated topics in the research of lasermaterial interaction. However, the basic mechanisms leading
to ablation are still not conclusive. Femtosecond laser ablation occurs at very short temporal and spatial scales, involving complicated optical, thermodynamic, energy transfer, and
mechanical processes which are closely coupled. At the same
time, the target could be heated to extremely high temperature and pressure, where thermal and mechanical properties
of the material are generally unknown.
Different mechanisms, such as phase explosion,3–8 critical
point phase separation,9 spallation,6 and fragmentation7,8,10
have been proposed to explain the laser ablation process.
Phase explosion is homogeneous bubble nucleation close to
the spinodal temperature ͑slightly below the critical temperature͒, during which gas bubble nucleation occurs simultaneously in a super-heated, metastable liquid. The
temperature-density ͑T-͒ and pressure-temperature ͑p-T͒
diagrams of the phase explosion process are illustrated in
Fig. 1.3 During rapid laser heating, the liquid can be raised to
a temperature above the normal boiling temperature ͑point
A͒, which is in a state of superheating in the region between
the binodal line and the spinode line on the phase diagram,
the metastable zone. When the material approaches the spinode ͑point B͒, intense fluctuation could overcome the activation barrier for the vapor embryos to grow into nuclei. This
activation barrier decreases as the material gets closer to the
spinode, causing a drastic increase of the nucleation rate
which turns the material into a mixture of vapor and liquid
droplets. Therefore, spinode line is the limit of superheating
in the metastable liquid, and no homogeneous structure will
exist beyond it when the liquid is heated. Experimental work
has shown that phase explosion occurred during nanosecond
laser ablation of a metal.4,11
During femtosecond laser ablation, an important factor
that needs to be considered is the extraordinary heating rate.
Heating above the critical temperature directly from the solid
phase becomes possible ͑point A in Fig. 2͒, followed by expansion leading to the thermodynamically unstable region
͑B͒, causing material decomposition.12 This material decomposition process, from solid to supercritical fluid to the unstable region is termed critical point phase separation. Critical point phase separation induced by laser heating was
studied using a one-dimensional Lagrangian hydrodynamic
code.9 It was found that the peak temperature of the liquid
material exceeds the critical temperature during the initial
heating period, then decreases to below the critical temperature while the material keeps its homogeneity and crosses the
FIG. 1. ͑a͒ T- and ͑b͒ p-T
diagrams of phase explosion.
Dome in solid line is the binode.
Dome in dashed line is spinode.
SHL, super-heated liquid. SCV,
super-cooled vapor. CP, critical
point.
1098-0121/2005/72͑16͒/165415͑15͒/$23.00
165415-1
©2005 The American Physical Society
PHYSICAL REVIEW B 72, 165415 ͑2005͒
C. CHENG AND X. XU
FIG. 2. ͑a͒ T- and ͑b͒ p-T
diagrams of critical point phase
separation.
spinode line into the unstable zone, causing phase separation.
Laser ablation of silicon was studied using a scheme combining Monte Carlo and molecular dynamics,8 which showed
phase explosion occurs in femtosecond laser ablation
͑500 fs͒. The same study showed for a 50 ps pulse, laser
ablation is due to fragmentation caused by highly nonuniform strain rates or the instability in low-density liquids.
However, different trends were observed in another molecular dynamics ͑MD͒ study.6 A longer laser pulse ͑150 ps͒
leads to phase explosion, while using a shorter laser pulse
͑15 ps͒, the laser induced tensile stress has a strong effect on
ablation. The inconsistency among the results in the literature could be due to the different fluence range, pulse width,
materials studied, and the computational methods used.
Experimental measurements of transient parameters during femtosecond laser ablation such as temperature and pressure are highly challenging. In this work, we focus on molecular dynamic simulation of femtosecond laser ablation of
nickel, and investigate possible ablation mechanisms at different laser fluences. Nickel is modeled as a system of atoms
interacting via Morse potential, and molecular dynamics
simulations are performed on this model system. The laser
pulse width is fixed at 100 fs, the pulse width of the commonly used Ti:sapphire femtosecond laser. The detailed laser
ablation process will be illustrated, and the ablation phenomena together with the thermodynamic paths of materials at
different locations during ablation will be analyzed to identify the ablation mechanisms. To locate the thermodynamic
paths, calculations of the critical point and binode line are
conducted. As will be seen, we show that at lower laser fluences, phase explosion can be the dominant mechanism for
femtosecond laser ablation, and critical point phase separation occurs at higher laser fluences.
II. SIMULATION METHODS
A. Molecular dynamics modeling
The problem studied in this work is femtosecond laser
ablation of nickel in vacuum. The target has a thickness ͑in
the x direction͒ of 187 nm, and a lateral dimension of
10.6 nmϫ 10.6 nm. Note that the length of the material will
increase when it is heated, as will be seen in Sec. III. On the
other hand, the MD simulation is capable of tracking motions of atoms due to thermal expansion and ablation. The
laser pulse is incident along the x direction onto the target. It
has a uniform spatial distribution and a temporal Gaussian
distribution of 100 femtoseconds full width at half-maximum
͑FWHM͒ centered at t = 1 picosecond. The wavelength of the
laser is 800 nm.
In our MD model, the Morse potential13 is used to simulate the interactions among atoms in nickel,
⌽͑rij͒ = D͓e−2b͑rij−r͒ − 2e−b͑rij−r͔͒,
͑1͒
where D is the total dissociation energy, r is the equilibrium
distance, and b is a constant, with values of 0.4205 eV,
0.278 nm, and 14.199 nm−1, respectively.13 Although there
are other potentials suitable for metals, such as the
embedded-atom method ͑EAM͒,14 the Morse potential is
chosen in this work because it has been proven to be a good
approximation to the interactions between atoms in fcc metals such as nickel, and is capable of predicting many material
properties. It has been widely used to study the laser-metal
interaction in different laser applications.15–18 Its simple form
allows us to compute a relative large number of atoms,
which is essential for revealing the details of the laser ablation process.
The procedure of the MD calculation is described as follows. At each time step, the total force, velocity, and position
of all the atoms are calculated. The force vector acted on
atom i from atom j is
ץ⌽͑r ji͒ ជ
o
o
ជ
ro = 2Db͑e−2b͑r ji−r͒ − e−b͑r ji−r͒͒rជji ,
F ji = F͑r ji͒rជji = −
ji
ץr
͑2͒
o
where rជji is the unit vector of rជji, the position vector from j to
i. The total force on atom i is the summation of the force
vectors from all neighboring atoms. After the total force for
each atom is obtained, the velocity and position at the new
time step are calculated from the modified Verlet
algorithm.19,20
From Eq. ͑2͒, it is seen that the force between two atoms
becomes negligible when they are very far away from each
other. A cutoff distance, rc ͑taken as 2.46 r in this work͒, is
therefore selected and the force between two atoms is evaluated only when their distance is less than rc. The distances
between atoms and rc are compared using the cell structure
and linked list method.19,20 To avoid the time consuming
165415-2
PHYSICAL REVIEW B 72, 165415 ͑2005͒
MECHANISMS OF DECOMPOSITION OF METAL DURING…
evaluation of the forces using Eq. ͑2͒, a force table is precalculated, and the force between two atoms is obtained from
this table according to their distance. The simulation speed is
significantly increased by using these methods.
In this work, all the parameters are nondimensionalized to
minimize the truncation errors. The total number of atoms is
about 1 900 000 and a parallel processing technique is applied to accelerate the computation. A computer cluster composed of eight 2.0 GHz PCs is used. MPICH, a potable
implementation of message passing interface, the standard
for message-passing libraries, is applied for the parallel MD
calculation. More details of the numerical approach are
available elsewhere.21
B. Evaluation of thermodynamic parameters
In this work, precise evaluation of the thermodynamic
parameters of material is crucial to the investigation of ablation mechanisms. The methods to calculate the temperature,
pressure, and density are explained in this section.
The macroscopic parameters can be evaluated after the
force-velocity-position of all atoms are obtained. To evaluate
these parameters, the calculation domain is divided into layers perpendicular to the x direction. In this work, the thickness of the layers is the cutoff distance rc. This means that
temperature, pressure, density, etc., of the material are averaged in y-z cross sectional areas, and are functions of the x
coordinate at each time step.
As will be shown in Sec. II C, the two-temperature model
is applied, and the lattice and electrons of metals are considered as two systems having their own temperatures. The lattice temperature Tl is calculated by summing the kinetic energy, with the bulk velocity of the material excluded,
N
Tl =
1
m͚
3NkB i=1
͚ͩ
3
ͪ
͑vi,j − v j͒2 ,
j=1
͑3͒
where N is the total number of atoms in a volume where the
temperature is evaluated ͑about 10 000͒, kB is the Boltzmann
constant, and m is the mass of the atom. j represents the
spatial coordinates ͑x, y, and z when j = 1, 2 and 3, respectively͒, vi,j is the velocity of atom i at the jth coordinate, and
v j is the average velocity of the N atoms at the jth coordinate.
Pressure is another important quantity for the investigation of the thermodynamic processes during laser ablation. It
is calculated using the expression22
p = k BT l +
1
6V
ͳ
N
͚ ͚i Fជij · rជij
i=1 j
ʹ
.
͑4͒
Equation ͑4͒ is derived from the virial theory, which considers the interaction of molecules in the matter to derive the
equation of state. The first part ͑kBT͒ is from the momentum
transport related to the random motion of the atoms, and is
similar to the pressure in ideal gases where the forces between molecules and/or atoms are neglected. The second part
N
ជ
͓͑1 / 6V͚͒͗i=1͚ j iFij · rជ ͔͘ considers the pressure from the inij
teracting forces among atoms.
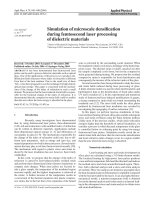
FIG. 3. The velocity distribution of the atoms at location
x = 184.5 nm and t = 120 ps. Laser fluence is 0.3 J / cm2.
In Eqs. ͑3͒ and ͑4͒, the volume with the lateral size of the
material ͑10.6ϫ 10.6 nm͒ and the thickness of the cutoff distance is chosen to evaluate the temperatures and pressures.
The number of atoms in such a volume ͑ϳ10 000͒ is large
enough to represent a Maxwell-Boltzmann velocity distribution ͓Eq. ͑5͔͒, the theoretical equilibrium velocity distribution,
P͑v͒ = 4v2
ͩ
m
2 k BT
ͪ
3/2
e−mv
2/2k T
B
.
͑5͒
An example is given in Fig. 3. The Maxwell-Boltzmann
velocity distribution of the atoms indicates that the local
equilibrium is established so that a temperature can be defined. Similar calculations under other times and laser fluences show that the local equilibrium is also achieved as
shown later in Figs. 15 and 20. This is consistent with other
work where a local equilibrium was found in ultrafast laser
heating.23
Proper boundary conditions are important to the simulation. On the top surface which is irradiated by the laser pulse,
the free boundary condition is applied. Periodical boundary
conditions are applied in the lateral directions ͑y and z͒. To
prevent the reflection of pressure wave, the bottom boundary
is subject to the so-called “nonreflecting boundary
condition.”24 For this boundary condition, the force calculation of atoms near the boundary is specially treated so that
their behavior is similar to those inside the material and the
incoming pressure wave will pass through the boundary. This
ensures that the ablation process will not be interfered with
by the reflected pressure wave.
C. Two temperature model for laser heating
In general, three energy transfer stages during femtosecond laser irradiation of metals have been identified.25 Initially, the free electrons absorb the energy from the laser.
This stage is characterized by a lack of thermal equilibrium
among the electrons. In the second stage, the electrons reach
thermal equilibrium and the density of states can now be
represented by the Fermi distribution. However electrons and
165415-3
PHYSICAL REVIEW B 72, 165415 ͑2005͒
C. CHENG AND X. XU
the lattice are still at two different temperatures. In the final
stage, electrons and the lattice reach thermal equilibrium and
thermal diffusion carries the energy into the bulk. A twotemperature model to predict the nonequilibrium temperature
distribution between electrons and the lattice during femtosecond laser irradiation of metals was first described by
Anisimov et al.26 Qiu and Tien27 derived the twotemperature model from the Boltzmann transport equation.
The two-temperature model looks at the heating mechanism
as consisting of the absorption of laser energy by the electrons and heating of the lattice by electron-lattice interaction.
It treats electrons and the lattice as two separate subsystems
with different temperatures governed by respective equations. It has been concluded that if the laser pulse duration is
much longer than the electron relaxation time which is of the
order of 1 fs, the first stage of electron nonequilibrium can
be ignored.28 As such, the existence of nonequilibrium between the electrons and the lattice is more important for the
study of femtosecond laser ͑typically ϳ100 fs͒ metal interaction, resulting in wide applications of the two-temperature
model ͑e.g., Ref. ͓29͔͒.
In the two-temperature model, the electron temperature
Te, and the lattice temperature Tl are subject to two coupled
one-dimensional ͑1D͒ governing equations,
Ce
ץTe ץ
ץTe
=
ke
− G͑Te − Tl͒ + S,
ץt ץx
ץx
ͩ ͪ
͑6͒
ץTl
= G͑Te − Tl͒,
ץt
͑7͒
Cl
where Ce and ke are volumetric specific heat and thermal
conductivity of electrons, respectively. Their temperature dependencies are approximated as Ce = ␥Te, e = e,0Te / Tl.
G͑Te − Tl͒ is the electron-lattice coupling term, which shows
that the energy transfer from electrons to the lattice is proportional to their temperature difference. The values of e,0,
␥, and G are taken as 91 W / m K, 1.065ϫ 103 J / m3 K2, and
3.6ϫ 1017 W / m3 K, respectively.29,30 S is the laser heating
source term expressed as
S=
I0 1 −͓͑t − t ͒/t ͔2 −x/d
0 p e
e
,
t pͱ d
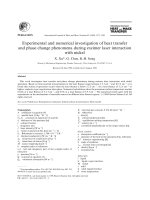
FIG. 4. Calculated p-v diagram near the critical point. Solid
bold line is the binode.
duction is always considered in the MD simulation, although
it is small compared with the electron conduction in a metal.
Another method has been used in literatures to consider the
electron-lattice coupling during laser heating,32,33 where the
energy coupling between the electrons and the lattice is considered as an additional term in the total force of each atom.
However, it can be shown that these two methods are identical.
To consider the effect of density variation from material
expansion and phase change, thermal conductivity and specific heat of electrons are scaled by the ratio of the local
density to the original density. Therefore, when density decreases, so do the effective thermal conductivity and specific
heat. This is consistent with the electron properties of
metals.34 Before the heating calculation is started, the material is equilibrated at 300 K for about 300 ps to ensure it is
under the expected initial equilibrium condition.
III. RESULTS
A. Evaluation of the critical point
͑8͒
where t p is the time constant determining the pulse duration,
and t0 is the time of the pulse center. To achieve a 100 fs
FWHM pulse centered at 1 ps, the values of t p and t0 are
0.06 ps and 1 ps, respectively. d is the absorption depth with
a value of 14 nm,31 and I0 is the absorbed laser fluence.
Equation ͑6͒ is solved using the TDMA ͑Tri-Diagonal
Matrix Algorithm͒ method with the adiabatic boundary condition applied on both boundaries. The value of temperatures
of electrons and the lattice in the coupling term, G͑Te − Tl͒, is
taken as those in the previous time step.
The lattice temperature is updated by scaling the velocities of all atoms ͑with bulk velocity excluded͒ by a factor
ͱ1 + G͑Te − Tl͒␦t / Ek,t at each time step, where Ek,t is the kinetic energy at the time t, and ␦t is the time step. This is
equivalent to solving Eq. ͑7͒, the governing equation of the
lattice equation in the two-temperature model. Lattice con-
Since we are interested in ablation around the critical
point, we first evaluate the phase diagram, including the critical point and the binode line of our model system near the
critical point. As will been seen, the phase diagram is crucial
for analyzing the phase change mechanisms in laser ablation.
The phase diagram is obtained by computing an equilibrium
heating problem with periodical boundary conditions on all
boundaries. At a fixed temperature, the pressure of the system as a function of specific volume is computed, that is, a
p-v curve is obtained at each temperature. The system is
equilibrated for a long time ͑200– 300 ps͒ at each p-v-T
value to ensure that the point on the phase diagram is at an
equilibrium state. This is repeated at different temperatures,
so p-v curves at different temperatures are obtained.
Figure 4 shows the results of the phase diagram and critical point calculation. It is seen that at 9700 K, the pressure
decreases continuously with the increase of specific volume,
indicating this temperature is above the critical temperature.
165415-4
PHYSICAL REVIEW B 72, 165415 ͑2005͒
MECHANISMS OF DECOMPOSITION OF METAL DURING…
FIG. 6. Electron and lattice temperatures at the surface and the
bottom of the target.
9700 K and 9300 K. More calculations at intermediate
temperatures indicate that the parameters of the critical
point are Tc = 9470± 40 K, c = 2500± 200 kg/ m3, and
pc = 1.08± 0.02 GPa. The critical point of nickel found
from
literature
is
9576 K / 2293 kg/ m3 / 1.12 GPa,35
3
7810 K / 2210 kg/ m / 0.49 GPa,36 and 9284 K.37 These values are extrapolated from low temperature data using semiempirical equations of state.
The binodal lines are obtained by connecting the points
where the vapor phase starts to appear and where the liquid
phase is turned into vapor completely. Between the binoldal
lines, the pressure is a constant at a constant temperature, and
liquid and vapor coexist as shown in Fig. 4.
In the following sections, the phase diagram obtained
from the above calculation will be used to reveal the thermodynamic paths of the phase change processes during laser
ablation.
B. Laser ablation
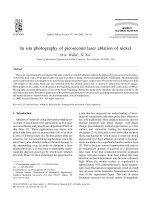
FIG. 5. Snapshots of the ablated area at different laser fluences
and times.
At 9300 K, the pressure does not decrease monotonously
with the increase of specific volume; the flat plateau indicates the region where the liquid and vapor phases coexist
which is confirmed by the observation of the two-phase
structure. Therefore, the critical temperature is between
The process of laser ablation is first analyzed from the
atomic distributions. Figure 5 shows snapshots of atomic distributions at laser fluences of 0.27, 0.3, 0.65, 1.0, and
1.5 J / cm2. Here, only the near surface region where the laser
energy is absorbed and laser ablation occurs is shown. In the
figure, each atom is represented by a black dot. Laser is
irradiated perpendicularly onto the right surface, while the
bottom of the target is always located at x = 0 nm ͑not shown
in the figure͒. To observe the interior of the target, the whole
domain is sliced into 10 layers with equal thicknesses in the
y direction, and the fifth layer is shown in these figures except Figs. 5͑c5͒, ͑d5͒, and ͑e5͒, where the whole thickness is
displayed. Note 0.27 J / cm2 is the lowest laser fluence to
cause volumetric phase change.
It is seen from these figures that the ablation phenomena
are different at low and high fluences. At 0.27 J / cm2 and
0.30 J / cm2 ͓Figs. 5͑a͒ and 5͑b͔͒, gas bubbles first appear
inside the material, and grow larger at later time steps. After
the size of bubbles is large enough, the material is separated
into pieces. On the other hand, at higher laser fluences, the
initial homogeneous phase turns into mixture of liquid drop-
165415-5
PHYSICAL REVIEW B 72, 165415 ͑2005͒
C. CHENG AND X. XU
FIG. 7. ͑a͒ Temperature and ͑b͒ pressure distributions at different time steps at laser fluence of 0.27 J / cm2.
lets and gas phase over a long length, completely different
from the low-fluence ablation where gas bubbles can be easily identified. The liquid droplets are then coalesced into bigger liquid clusters, while a certain number of atoms remain
as the gas phase, forming a ЉbackgroundЉ vapor phase. We
will point out in Sec. IV that different ablation patterns indicate different ablation mechanisms for low and high laser
fluences.
Another phenomenon seen in Fig. 5 is that at the two
lower laser fluences ͑0.27 J / cm2 and 0.30 J / cm2͒ the gas
bubbles are generated inside the material, rather than on or
near the surface. The distances from the surface to the origin
of gas bubbles at laser fluences 0.27 and 0.3 J / cm2 are 25
and 18 nm, respectively. The reason why gas bubbles are
generated inside the material will be discussed later in Sec.
IV.
C. Time evolution of temperature, pressure, and density
The detailed ablation process is analyzed in this section
by studying the time evolution of temperature, pressure, and
density in the target material. The electron and the lattice
temperature on the surface and the bottom of the material at
the laser fluence of 0.27 J / cm2 are shown in Fig. 6. It is seen
165415-6
PHYSICAL REVIEW B 72, 165415 ͑2005͒
MECHANISMS OF DECOMPOSITION OF METAL DURING…
that the electron temperature on the surface is increased
quickly to the peak value of 18 000 K, while the lattice temperature does not increase as fast. Due to the electron-lattice
coupling, the electron temperature starts to decrease and the
lattice temperature increases, until they reach approximately
the same value after tens of picoseconds. The electron and
lattice temperatures at the bottom stay constant at 300 K
within 100 ps after the laser pulse.
The lattice temperature and pressure wave for the laser
fluence of 0.27 J / cm2 at different time steps during the ablation process are shown in Fig. 7. Note that the laser pulse is
centered at 1 ps with duration of 0.1 ps. At time 0, the target
is at an equilibrium state of 300 K, and the pressure is almost
zero. After the laser pulse is incident on the target, the surface temperature increases dramatically, and a strong compressive ͑positive͒ pressure is generated and propagates into
the target. This compressive pressure is due to the thermal
expansion in the near surface region. A negative pressure
which represents a tensile stress follows the compressive
wave, but its magnitude is much smaller. As will be shown
later, this tensile stress has a significant effect on the material
separation process. Melting occurs at the surface at about
6 ps. It is also noticed that the lattice temperature of the
solid-liquid interface is about 3800 K, much higher than the
calculated melting temperature of nickel ͑2500 K͒, indicating the existence of strong overheating. The interfacial temperature decreases at later time steps and reaches about
2750 K at 90 ps when the melting process slows down but
does not stop. A lattice temperature disorder appears after
6 ps ͑for example, at about 150 nm at t = 15 ps͒. Compared
to the atomic distribution, it is found that this disorder always occurs at the liquid-solid interface; therefore, this temperature disorder is due to the energy transfer associated with
solid-liquid phase change. The peak temperature reaches the
highest value of 7700 K at 54 ps, lower than the critical
temperature 9470 K calculated in Sec. III A.
The different phases of the material can also be revealed
by the atomic number density distribution shown in Fig. 8,
which is evaluated from dividing the number of atoms in a
slice of material perpendicular to the depth direction x by the
volume of this slot. For solid, the atomic density fluctuates
from nearly zero to a high value along the x direction ͑see
Fig. 8, 0 ps͒, since the density is high around the lattice layer
but low in between the two lattice layers. Note that the thickness of the slice is much smaller than the lattice constant. For
liquid, the atomic number density is almost uniform since
there is no lattice structure ͑e.g., Fig. 8, 15 ps, 155– 195 nm͒.
For the gas state, since its density is much lower than that of
the liquid, the number density would be small comparing
with that of the liquid.
The temperature and pressure distributions for other fluences of 0.30, 0.65, 1.0, and 1.5 J / cm2 are shown in Figs. 9,
10, 11, and 12, respectively. It is seen from these figures that
the peak surface temperature increases significantly with the
laser fluence, and even exceeds the critical temperature at
three higher laser fluences ͑see Figs. 10–12͒. Also noted is
that at these three laser fluences, the surface temperature is
slightly lower than the interior temperature. As indicated in
Fig. 5, expansion is very strong near the ablation front. Figures 7 and 9 show that the total thickness of the target in-
FIG. 8. Atomic number density at different time steps at laser
fluence of 0.27 J / cm2.
creases 31 nm and 36 nm for 0.27 J / cm2 and 0.3 J / cm2, respectively, in about 45 ps after the laser pulse, while it
increases 94 nm, 132 nm, and 152 nm for the three higher
laser fluences. The stronger material expansion causes temperature decrease around the surface at higher laser fluences.
As will be shown in Sec. IV, this cooling eventually leads to
phase separation at these higher laser fluences, as compared
to what happened at lower laser fluences when the phase
change happens before significant cooling can take place.
Figures 9–12 reveal another important difference between
165415-7
PHYSICAL REVIEW B 72, 165415 ͑2005͒
C. CHENG AND X. XU
FIG. 9. ͑a͒ Temperature and ͑b͒ pressure distributions at different time steps at laser fluence of 0.3 J / cm2.
165415-8
PHYSICAL REVIEW B 72, 165415 ͑2005͒
MECHANISMS OF DECOMPOSITION OF METAL DURING…
FIG. 10. ͑a͒ Temperature and ͑b͒ pressure distributions at different time steps for fluence 0.65 J / cm2.
the laser-material interactions at low and high laser fluences.
As shown in Fig. 7͑b͒, a tensile stress follows the compressive wave induced by laser heating at 0.27 J / cm2. This tensile stress can also be observed for the fluence of 0.3 J / cm2
in Fig. 9͑b͒. However, for the three higher fluences of 0.65,
1.0, and 1.5 J / cm2 shown in Figs. 10͑b͒–12͑b͒, there is no
such tensile stress following the compressive stress. The possible reason is that at these higher laser fluences, since the
temperature near the surface is higher than the critical point,
the material is a super-critical fluid with a low density. This
low density super-critical fluid cannot withstand much tensile stress. It will be shown later in Sec. IV that the tensile
stress assists the phase change process at lower laser fluences, while at higher laser fluences, phase separation occurs
when the super-critical fluids enter the thermodynamic unstable zone as a result of expansion.
IV. DISCUSSIONS
A. Ablation at low laser fluences
The mechanisms leading to ablation is studied by analyzing the thermodynamic trajectories of groups of atoms that
undergo phase separation. The thermodynamic trajectory
represents the time evolution of the material under investigation in thermodynamic space. Specifically, the evolutions of
groups of atoms in T- diagrams are plotted and analyzed in
details. There is no preference in choosing the groups of
atoms. Atoms in one group are in close proximity to each
other, and follow the bulk motion of the material. Atoms are
allowed to enter or leave the group.
Figure 13 shows the groups of atoms analyzed for the
laser fluence of 0.3 J / cm2 at 120 ps ͓the same figure as Fig.
5͑b5͔͒. According to Fig. 13, groups 2 and 4 have turned into
165415-9
PHYSICAL REVIEW B 72, 165415 ͑2005͒
C. CHENG AND X. XU
FIG. 11. ͑a͒ Temperature and ͑b͒ pressure distributions at different time steps at laser fluence of 1.0 J / cm2.
gas at 120 ps, while groups 1, 3, and 5 are in the liquid phase
͑and will remain as liquid͒. Their thermodynamic trajectories
of densities and temperatures during the ablation process are
shown in Fig. 14. The arrows indicate the progress of time,
while the numbers along the trajectories mark the time in ps.
The binode and spinode lines are taken from the calculation
results in Sec. III A. From Fig. 14, it is seen that groups 2, 3,
and 4, which experience material separation, cross both the
binode line and the spinode line. These three groups undergo
a phase separation process, with groups 2 and 4 turning into
vapor. On the other hand, groups 1 and 5, which do not touch
the spinode, do not undergo phase change. This indicates that
the phase change of the material is directly related to whether
it reaches the spinode line or not. Recall what was described
in Sec. I for phase explosion, when liquid enters the metastable region and approaches the spinode, it will undergo the
phase explosion process and turn into a mixture of liquid and
vapor. Therefore, the thermodynamic trajectories of the
groups suggest that phase explosion occurs at this laser fluence.
In the above discussion, it is important that local thermal
equilibrium is achieved so that a temperature can be defined.
This can be verified by plotting out the velocity distribution
at the locations of interest and comparing it with the equilibrium Maxwell-Boltzmann distribution expression, Eq. ͑5͒. In
Fig. 15, the velocity distributions of atom groups 2 and 3 in
Figs. 13 and 14 at a number of time steps leading to ablation
are shown. The Maxwell-Boltzmann distributions that can
best represent these velocity distributions are also shown.
From Fig. 15, it is seen that velocities of atoms indeed follow
the equilibrium Maxwell-Boltzmann distribution.
Analyzing the ablation process at a lower fluence of
0.27 J / cm2 reaches the same conclusion, groups of atoms
that are not able to reach the spinode line do not experience
phase separation, while those crossing the spinodal line undergo phase separation.
165415-10
PHYSICAL REVIEW B 72, 165415 ͑2005͒
MECHANISMS OF DECOMPOSITION OF METAL DURING…
FIG. 12. ͑a͒ Temperature and ͑b͒ pressure distributions at different time steps at laser fluence of 1.5 J / cm2.
At a lower laser fluence of 0.25 J / cm2, no gas bubbles are
generated. A number of groups of atoms are marked in the
T- diagram in Fig. 16 at the time steps when they are closest to the spinode line. Although the temperature of liquid is
between 5500 K and 6900 K, much higher than the equilibrium boiling temperature ͑3186 K͒, none of these groups
reach the spinode line and turn into vapor. Therefore, liquid
vapor phase change does not occur at this laser fluence. This
confirms again that crossing the spinode line is necessary for
the material to turn into gas and experience decomposition.
FIG. 13. Positions of groups of atoms at laser fluence of
0.3 J / cm2.
FIG. 14. Thermodynamic trajectories of groups of atoms at laser
fluence of 0.3 J / cm2.
165415-11
PHYSICAL REVIEW B 72, 165415 ͑2005͒
C. CHENG AND X. XU
FIG. 15. Velocity distributions for ͑a͒ group 3 and ͑b͒ group 2 in Figs. 13 and 14.
165415-12
MECHANISMS OF DECOMPOSITION OF METAL DURING…
PHYSICAL REVIEW B 72, 165415 ͑2005͒
FIG. 16. Positions of groups of atoms on T- diagram at 45 ps
at laser fluence of 0.25 J / cm2.
FIG. 18. Thermodynamic trajectories of atoms groups. Fluence,
0.65 J / cm2.
B. Ablation at high laser fluences
One factor that facilitates phase explosion is the tensile
stress generated by laser heating. When the material is heated
by a laser pulse, its density decreases, which is mainly due to
the thermal expansion resulting from laser heating. However,
the propagation of the stress wave induced by laser heating
also has an effect on the density profile. As shown in Fig.
7͑b͒, there is a tensile stress after the strong compressive
wave passes. In Fig. 17, this tensile stress and the atomic
number density for the fluence of 0.3 J / cm2 are plotted together. The time step of 36 ps is chosen because gas bubbles
are generated about 3 ps later. At the surface, the tensile
stress remains at zero ͑as it should be according to the requirement of force balance͒. Under the surface, the increase
of the tensile stress tends to decrease the density. On the
other hand, the decrease of temperature tends to increase the
density. The combined effect is that the minimum density is
reached below the surface, where the material located is
more likely to reach the spinode line and undergo the phase
change process. This explains why the gas bubble appears
not at the surface, but under the surface as shown in Fig. 5.
FIG. 17. Profile of pressure and atomic number density at 36 ps
at laser fluence of 0.3 J / cm2.
Similar to the preceding section, the mechanism leading
to ablation at higher laser fluences is also analyzed from the
thermodynamic trajectories of groups of atoms.
Figure 18 shows the thermodynamic trajectories of several groups of atoms. The locations of these groups of atoms
at 90 ps are marked in Fig. 19. The laser fluence is
0.65 J / cm2. From Fig. 18, it is seen that all the three groups
are first raised to temperatures higher than the critical temperature and become a super-critical fluid. After expansion,
their temperature decreases, and they enter the unstable zone
below the critical point as the phase separation occurs at
about 30 ps. Groups 1 and 2 evolve into gas, while group 3
becomes liquid. Comparison between Figs. 5 and 18 shows
that there is no phase separation during the initial heating
period ͑from 1 ps to about 30 ps͒ although the density decreases continuously. The material remains homogeneous
until it enters the unstable zone after expansion, and the liquid ͑group 3͒ precipitates out from the homogeneous phase.
Similarly to Fig. 15, the velocity distributions of groups 2
and 3 at different time steps leading to ablation are plotted
and compared with the equilibrium Maxwell-Boltzmann distribution to verify the local thermal equilibrium condition.
Again, velocities of atoms are found to follow the equilibrium distribution, indicating that local thermal equilibrium is
achieved. ͑See Fig. 20.͒
The thermodynamic trajectories of the groups of atoms
described above are clearly different from those at lower
laser fluences, but follow that of critical point phase separation shown in Fig. 2͑a͒. Heating above the critical point,
followed by the expansion into the unstable zone that causes
phase separation has been clearly illustrated, which agrees
FIG. 19. Positions of groups of atoms on T- diagram at 90 ps
at laser fluence of 0.65 J / cm2.
165415-13
PHYSICAL REVIEW B 72, 165415 ͑2005͒
C. CHENG AND X. XU
FIG. 20. Velocity distributions for ͑a͒ group 3 and ͑b͒ group 2 in Figs. 18 and 19.
165415-14
MECHANISMS OF DECOMPOSITION OF METAL DURING…
PHYSICAL REVIEW B 72, 165415 ͑2005͒
with the theoretical description of critical point phase separation. Similar thermodynamic trajectories are found for laser fluences of 1.0 J / cm2 and 1.5 J / cm2. Therefore, it is concluded that critical point phase plays important roles in
material decomposition.
is through phase explosion. Bubble nucleation occurs inside
the metastable liquid at temperatures as the spinode is approached, and is assisted by the tensile stress developed during laser heating. At higher laser fluences critical point phase
separation occurs. The initial peak temperature reached exceeds the critical temperature. The super-critical fluid enters
the unstable zone after relaxation and loses its homogeneity,
causing phase separation.
V. SUMMARY
In this work, the mechanisms of femtosecond laser ablation of a nickel target are studied using molecular dynamic
simulations in a laser fluence range commonly used for materials processing. Two distinct laser fluence regimes are
identified, which are caused by different ablation mechanisms. At lower laser fluences, the peak temperature reached
is below the critical temperature, and material decomposition
*Author to whom correspondence should be addressed. Electronic
address:
1 D. von der Linde and K. Sokolowski-Tinten, Appl. Surf. Sci.
154–155, 1 ͑2000͒, and references therein.
2
F. Korte, J. Serbin, J. Koch, A. Egbert, C. Fallnich, A. Ostendorf,
and B. N. Chichkov, Appl. Phys. A: Mater. Sci. Process. A77,
229 ͑2003͒.
3 R. Kelly and A. Miotello, Appl. Surf. Sci. 96–98, 205 ͑1996͒.
4
K. H. Song and X. Xu, Appl. Surf. Sci. 127, 111 ͑1998͒.
5 J. H. Yoo, S. H. Jeong, X. L. Mao, R. Grief, and R. E. Russo,
Appl. Phys. Lett. 76, 783 ͑2000͒.
6 L. V. Zhigilei, Appl. Phys. A: Mater. Sci. Process. A76, 339
͑2003͒.
7 D. Perez and L. J. Lewis, Phys. Rev. Lett. 89, 255504 ͑2002͒.
8
P. Lorazo, L. J. Lewis, and M. Meunier, Phys. Rev. Lett. 91,
225502 ͑2003͒.
9 K. Sokolowski-Tinten, J. Bialkowski, A. Cavalleri, D. von der
Linde, A. Oparin, J. Meyer-ter-Vehn, and S. I. Anisimov, Phys.
Rev. Lett. 81, 224 ͑1998͒.
10 D. Perez and L. J. Lewis, Phys. Rev. B 67, 184102 ͑2003͒.
11
X. Xu, in Annual Review of Heat Transfer, edited by C.-L. Tien,
V. Prasad, and F. P. Incropera ͑Bell House, New York, 2001͒,
Vol. 12, p. 79.
12 V. P. Skripov and A. V. Skripov, Sov. Phys. Usp. 22, 389 ͑1979͒.
13
L. A. Girifalco and V. G. Weizer, Phys. Rev. 114, 687 ͑1959͒.
14 S. M. Foiles, M. I. Baskes, and M. S. Daw, Phys. Rev. B 33,
7983 ͑1986͒.
15 W. K. Liu, J. M. Yuan, and S. H. Lin, Phys. Rev. A 60, 1363
͑1999͒.
16 E. Ohmura, I. Fukumoto, and I. Miyamoto, Proc. SPIE 4088, 84
͑2000͒, and references therein.
17 V. Constantoudis and C. A. Nicolaides, Phys. Rev. E 64, 056211
͑2001͒.
18 N. N. Nedialkov, S. E. Imamova, and P. A. Atanasov, J. Phys. D
ACKNOWLEDGMENTS
Support of this work by the National Science Foundation
Grant No. 0219098-CTS is acknowledged. C.C. also thanks
the Fellowship support from the Purdue Computational Research Institute.
37, 638 ͑2004͒.
P. Allen and D. J. Tildesley, Computer Simulation of Liquids
͑Clarendon, Oxford, 1987͒.
20 X. Wang and X. Xu, Int. J. Heat Mass Transfer 46, 45 ͑2002͒.
21
C. Cheng and X. Xu, Appl. Phys. A: Mater. Sci. Process. A79,
761 ͑2004͒.
22
J. M. Haile, Molecular Dynamics Simulation: Elementary Methods ͑Wiley, New York, 1992͒.
23 X. Wang and X. Xu, ASME J. Heat Transfer 124, 265 ͑2002͒.
24
C. Schäfer, H. M. Urbassek, L. V. Zhigilei, and B. J. Garrison,
Comput. Mater. Sci. 24, 421 ͑2002͒.
25
J. Hohlfeld, S.-S. Wellershoff, J. Güdde, U. Conrad, V. Jähnke,
and E. Matthias, Chem. Phys. 251, 237 ͑2000͒.
26
S. I. Anisimov, B. L. Kapeliovich, and T. L. Perel’man, Sov.
Phys. JETP 39, 375 ͑1974͒.
27 T. Q. Qiu and C. L. Tien, J. Heat Transfer 115, 835 ͑1993͒.
28 T. Q. Qiu and C. L. Tien, Int. J. Heat Mass Transfer 37, 2789
͑1994͒.
29
S. S. Wellershoff, J. Hohlfeld, J. Güdde, and E. Matthias, Appl.
Phys. A: Mater. Sci. Process. A69, S99 ͑1999͒.
30
P. A. Atanasov, N. N. Nedialkov, S. E. Imamova, A. Ruf, H.
Hügel, F. Dausinger, and P. Berger, Appl. Surf. Sci. 186, 369
͑2002͒.
31 D. R. Lide, Handbook of Chemistry and Physics, 77th ed. ͑CRC
Press, Boca Raton, FL, 1996͒.
32 H. Häkkinen and U. Landman, Phys. Rev. Lett. 71, 1023 ͑1993͒.
33
D. S. Ivanov and L. V. Zhigilei, Phys. Rev. B 68, 064114 ͑2003͒.
34
R. Berman, Thermal Conduction in Solids ͑Clarendon, Oxford,
1976͒.
35 D. A. Young and B. J. Alder, Phys. Rev. A 3, 364 ͑1971͒.
36 M. M. Martynyuk, Russ. J. Phys. Chem. 57, 810 ͑1983͒.
37 D. A. Young, UCRL-52352, Lawrence Livermore Laboratory,
1977.
19 M.
165415-15