numerical analysis of the spectral response of an nsom measurement
Bạn đang xem bản rút gọn của tài liệu. Xem và tải ngay bản đầy đủ của tài liệu tại đây (767.5 KB, 9 trang )
Birck Nanotechnology Center
Birck and NCN Publications
Purdue Libraries Year
Numerical analysis of the spectral
response of an NSOM measurement
Edward C. Kinzel
∗
Xianfan Xu
†
∗
Purdue University,
†
Birck Nanotechnology Center, School of Materials Engineering, Purdue University,
This paper is posted at Purdue e-Pubs.
/>Appl Phys B (2008) 93: 47–54
DOI 10.1007/s00340-008-3178-0
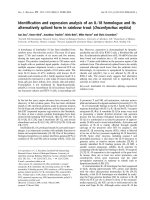
Numerical analysis of the spectral response of an NSOM
measurement
E.C. Kinzel ·X. Xu
Received: 29 June 2008 / Published online: 30 August 2008
© Springer-Verlag 2008
Abstract Near-field Scanning Optical Microscopy (NSOM)
is a powerful tool for investigating optical field with res-
olution greater than the diffraction limit. In this work, we
study the spectral response that would be obtained from an
aperture NSOM system using numerical calculations. The
sample used in this study is a bowtie nanoaperture that has
been shown to produce concentrated and enhanced field.
The near- and far-field distributions from a bowtie aperture
are also calculated and compared with what would be ob-
tainable from a NSOM system. The results demonstrate that
it will be very difficult to resolve the true spectral content of
the near-field using aperture NSOM. On the other hand, the
far-field response may be used as a guide to the near-field
spectrum.
PACS 07.79.Fc · 68.37.Uv ·42.79.Gn
1 Introduction
Near-field Scanning Optical Microscopy (NSOM) is a
powerful tool for peering beyond the diffraction limit. It
plays an increasingly important role for the investigation
of nanoscale devices that manipulate light on length scales
that do not effectively couple into the far-field such as sub-
wavelength apertures and plasmonic structures [1, 2]. One of
the principle advantages of NSOM is the potential to resolve
the spectral content in the near-field in addition to resolving
optical signals with high spatial resolution.
E.C. Kinzel · X. Xu (
)
School of Mechanical Engineering and Birck Nanotechnology
Center, Purdue University, West Lafayette, IN 47907, USA
e-mail:
In order to measure the near-field, a probe must scatter
the evanescent waves into the far-field where they can be
measured by a photo sensor such as a photo multiplier tube.
These near-field probes are constructed with nanoscale fea-
ture sizes, often using standard micro and nanofabrication
techniques. The dimensions of the probe permit a very small
interrogation volume. Because the position of the probe can
be very accurately controlled relative to the specimen of in-
terest, NSOM can spatially resolve optical signals as well as
topography of a sample.
In many applications the spectral response of the nano-
scale specimen is of interest. The purpose of this paper is
to evaluate how NSOM measurements can reveal the spec-
tral information. There exist possible differences between
the actual near-field and the NSOM measured signals, which
can be understood from Bethe’s theory [3]. The Bethe’s the-
ory analytically examined the light transmission through a
subwavelength circular aperture in a perfectly conducting
screen. For illumination by a normally incident plane wave,
the ratio of the diffracted energy to the incident energy, T ,
through a circular hole of radius r is given by a first order
approximation as
T ≈
1024π
2
27
r
4
λ
4
. (1)
It is expected that signal passing through such an aperture of
an NSOM probe will have longer wavelengths more signif-
icantly attenuated, therefore distorting the spectral distribu-
tion of the near field.
A nanoscale bowtie aperture is selected as the sample in
this work whose near- and far-field are to be studied. The
bowtie aperture is a type of ridge waveguide, and together
with other nanoscale apertures, are of current interest as a
means of producing a nanoscale near-field spot [4–7]. Its
48 E.C. Kinzel, X. Xu
Fig. 1 Schematic of bowtie aperture
Table 1 Cutoff wavelengths for different outline dimensions of bowtie
waveguide
a [nm] 125 150 175 200
λ
1
[nm] 410.5 516.5 625.4 736.9
optical throughput is much higher than a similarly sized
circular or square aperture because its cutoff wavelength
is much longer [4]. Loading a waveguide with ridges is a
well known approach in microwave engineering for raising
the cutoff wavelength and increasing the useful operational
range [8, 9]. A schematic of a nanoscale bowtie aperture
studied is shown in Fig. 1. A thin metallic film (aluminum
in this study) is evaporated on top of a dielectric substrate
which is typically quartz. A plane wave polarized in the y-
direction is incident from the bottom of the substrate, prop-
agating in z-direction. For the work presented in this paper,
the aperture is defined by a 25×25 nm gap (s =d =25 nm)
and in a metal film with thickness of 150 nm (t =150 nm).
These dimensions are selected because they are representa-
tive of real apertures milled using a focused ion beam (FIB)
in aluminum films evaporated onto quartz substrates. By se-
lecting the outer dimensions, a and b, the resonant wave-
length of the aperture can be tuned. Table 1 shows the nu-
merically calculated cutoff wavelengths for the first propa-
gating mode of the various sized waveguides (a = b with
s =d =25 nm).
Figure 2(a) shows the schematic of an NSOM probe
formed by milling a circular hole of radius r onto the
apex of the pyramidal tip, which is a typical tip used in
an atomic force microscope (AFM). The AFM probe is
formed by evaporating a thin (120 nm) aluminum coat-
ing onto a silicon nitride core. Detail description of the
NSOM probe fabrication was given elsewhere [1]. When
using such an NSOM probe for measuring the near field
response of a sample (a bowtie aperture in this case),
the aperture is illuminated from the bottom through the
Fig. 2 Problem definition: (a) probe geometry and (b) Probe scanning
bowtie nanoaperture
quartz substrate by a plane wave polarized in the y-
direction and propagating along the z-axis. The signal is
collected by focusing a microscope objective onto the exit
of the NSOM probe. The probe can be in intimate con-
tact with the specimen surface during the NSOM measure-
ment.
In this study, the near-field and far-field distributions
of the bowtie aperture are computed. The field from the
bowtie aperture collected by the NSOM probe is also cal-
culated and compared with the near-field and far-field re-
sults. To isolate the geometric response from the material
response, the problem is first addressed by modeling the
metal surfaces as a perfect electrical conductor (PEC). The
ability of the NSOM probe to resolve the resonant peaks
is analyzed numerically along with the effect of the ra-
dius of the NSOM probe aperture. The calculations are then
expanded to consider the properties of a real metal, alu-
minum.
2 Numerical analysis
2.1 Simulation setup
This study uses HFSS (Version 10.1), a software package
based on the finite element method (FEM) in the frequency
domain to solve the Maxwell’s equations [10]. This software
package has been used previously to investigate nanoscale
‘C’ waveguide apertures [6], including a validation of its
applicability to the length scale using real metal properties
in the optical frequency range. The computational domain
is discretized using tetrahedral elements. Edge basis func-
tions and second-order interpolation functions are expanded
over the elements [6, 10]. Once the field distribution has
been solved, the mesh is refined to add more elements in
regions where the intensities or gradients are high. This iter-
ative approach is very useful because the mesh needs to be
Numerical analysis of the spectral response of an NSOM measurement 49
Fig. 3 E-field magnitude for
150 nm thick PEC bowtie
aperture (a =b =150 nm)
under plane wave illumination
(wave polarized in y-direction)
for λ =400 nm in the
(a) H plane, (b) E plane, and
λ =800 nm in the (c) H plane
and (d) E plane
very dense around the aperture and sparser where the fields
are weak, which permits the boundaries to be placed fur-
ther from the strongly radiating features, and is in contrast
to finite difference time domain (FDTD) techniques, which
normally do not provide as much flexibility in their grids.
Another advantage of using FEM in the frequency domain
is that the optical properties for the various materials can be
readily implemented as a function of wavelength, whereas to
simulate these metals in the time-domain, the Debye model
is typically used which results in non-trivial errors if it is
not properly fit to the wavelength range of interest. Operat-
ing in the frequency-domain also simplifies the calculation
of the far-field data, because the time-domain solution data
requires conversion (Fourier transform) to the frequency do-
main before application of the algorithm. ‘Perfect E’ and
‘Perfect H ’ boundary conditions are applied to the xz and
yz planes, respectively. These symmetry conditions reduce
domain size and increase the overall accuracy of the simu-
lation by permitting a greater density of elements to be em-
ployed in the relevant portions of the geometry.
2.2 PEC results
The first step in this study is to identify the near and far-
field responses from the aperture in Fig. 1 without any probe
present. To isolate geometric effects from material effects,
the metallic film is first modeled as a perfect electric con-
ductor (PEC). For all the work presented in this paper, the
incident wave has a 1 V/m peak value of the E field (2 V/m
peak-to-peak). Figure 3 shows the magnitude of the elec-
tric field at one instant in time (or rather phase-space) for
a bowtie with a = b = 150 nm with incident plane wave
with a free space wavelength of λ = 400 nm (below cutoff)
and λ =800 nm (above cutoff) polarized in the y-direction
(also see Table 1 for cutoff wavelengths). This can be ob-
served by noting the discontinuity at the entrance of the
aperture indicating propagation. The calculation shows that
for λ =400 nm, part of the incident wave is reflected back
by the metal film to form a standing wave, and some of the
light also couples into a TE mode and propagates through
the aperture. The spatial shape of this mode serves to con-
centrate the energy in the gap region of the aperture. This is
50 E.C. Kinzel, X. Xu
Fig. 4 Near-field response
(energy stored in
electromagnetic fields and the
magnitude of the pointing
vector) from PEC bowties of
various sizes
appealing because the mode can be used to concentrate the
incident energy to a near field spot with dimensions on the
same order as the gap on at the exit plane, as shown in pre-
vious numerical work on ridge waveguide apertures [4, 11].
The majority of the energy transmitted from the waveguide
is stored in evanescent field near the exit plane, however, a
small amount of the light does couple to the far-field. In the
λ = 800 nm case all the modes are cutoff and the field is
evanescently decaying through the waveguide.
Figure 4 illustrates the spectral dependence of the
bowtie’s near-field emission on its outline dimensions
(a and b). The field is sampled at the center of the aper-
ture on the exit plane (the free-space side of the metal film).
The energy stored in the electric and magnetic fields are,
u
E
=εE
2
/2 and u
H
=μH
2
/2, respectively [9]. In a propa-
gating wave, these two quantities are equal; however, this is
not necessarily true in an evanescent field [9]. From our near
field results, it was found that the energy stored in the elec-
tric field is about one order of magnitude higher than that in
the magnetic field. The Poynting vector, P = E × H gives
the magnitude of the energy flow and its direction. Figure 4
shows the sum of the energy density stored in the electric
and magnetic field and the magnitude of the Poynting vec-
tor at the center of the gap in the exit plane for different
sized bowtie apertures (all with a = b). It is interesting to
observe that the peak field intensities in the near-field all
occur slightly at wavelengths slightly longer than the cut-
off wavelengths listed in Table 1. The peak value of the
Poynting vector also decreases for larger apertures (longer
wavelengths) relative to the peak value of the potential en-
ergy density. The larger near-field intensity at resonance for
larger apertures may be explained by the fact that the inci-
dent radiation is being concentrated in the gap region and
a greater amount of incident energy is harvested by these
apertures.
The far-field pattern is calculated by the transforming the
fields calculated at the boundaries of the simulation using
the free-space Green’s function [10]. A signature of the far-
field is that the E field is orthogonal to the H field and scaled
by η, the impedance of the medium. This allows easy calcu-
lation of the radiated power. The far-field response has both
an angular and spectral dependence as shown in Fig. 5(a)
and (b), plotted at λ = 500 and λ = 750 nm, respectively.
To represent the collection of the emitted light by a mi-
croscope objective in a far-field measurement, the radiated
power is integrated over a collection angle, which is selected
to be 27
◦
corresponding to a 50× objective with NA =0.45.
Figure 5(c) shows the far field resonant peaks are closely
correlated with the near-field emission of the bowtie aper-
ture.
The next step in this study is to examine if the resonance
can be resolved by NSOM measurements. Figure 6 shows
the magnitude of the electric field with the presence of an
NSOM probe for a bowtie sample with a = b = 150 nm. It
can be seen that the field is disturbed by the probe and very
little of the energy propagates into the probe. To calculate
an NSOM signal, the Poynting vector is integrated over the
signal plane of the probe as shown in Fig. 2. Figure 7 shows
the magnitude of this signal for a probe with a circular aper-
ture and a diameter of 150 nm. The resonant peaks of the
various sized bowties are all above the cutoff wavelength of
the circular hole in the probe. This leads to the resolution of
only the shortest wavelength resonant peaks. The signals are
also slightly blue shifted because of the greater sensitivity to
shorter wavelengths and therefore better coupling between
the bowtie aperture and the probe at shorter wavelengths.
The results shown above also suggest a great spectral
sensitivity to the probe dimensions. To illustrate this, the
a =b =150 nm bowtie is imaged by probes with apertures
of different diameters. Figure 8 shows the calculated signals
along with the Poynting vector for the aperture without any
probe. The signals were all scaled to unity at 400 nm. It is
seen that the holes with larger radius would better resolve
the spectral information. However, using a probe with large
Numerical analysis of the spectral response of an NSOM measurement 51
Fig. 5 Far-field patterns for PEC bowtie aperture, a =b =150 nm, (a) below the cutoff wavelength, λ =500 nm, (b) above the cutoff wavelength:
λ =750 nm, along with (c) the radiated E field for different sized bowties at different wavelengths
Fig. 6 Magnitude of E field for
150 nm bowtie examined with a
50 nm hole in the (a) H plane
and (b) E plane
52 E.C. Kinzel, X. Xu
Fig. 7 Response from PEC bowties from NSOM probe with a 75 nm
radius hole
Fig. 8 Signal from different radius probes
radius will result in a larger sample volume, which will re-
duce the spatial resolution. It should also be pointed out that
there is several orders of magnitude difference between the
signals from the 25 and 100 nm radius probes.
2.3 Real materials
At optical wavelengths, the optical properties of metal must
be considered as they significantly affect the field distribu-
tions. The field penetrates a finite amount into a metal and
the conductor introduces a tangible amount of loss. In ad-
dition, resonant effects such as surface-plasmons may be
an issue [5]. The properties of metal such as aluminum
vary significantly over optical wavelengths as can be seen
in Fig. 9(a) [12]. By contrast, the dielectric properties for
both silicon nitride and quartz [13] do not vary significantly
over this interval.
Fig. 9 Optical properties of (a) aluminum and (b) silicon nitride from
[12] and synthetic quartz from [13]
The distance that the fields penetrate into a metal is given
by the skin depth of the metal, which is expressed as [10]:
δ =
λ
2π Im(
√
ε)
, (2)
where ε is the dielectric function of metal. The field pene-
tration into the metal surface serves to effectively make the
aperture’s profile larger. The varying imaginary portion of
the permittivity as a function of wavelength leads to vari-
able losses given by [9, 10]
P
l
=R
s
C
|J
s
|
2
dl, (3)
where R
s
is the surface resistance of the conductor and
J
s
is the surface current given by ˆn×H on the metal
surface. Compared to Figs. 3 and 6,Fig.10 shows that
these effects significantly modify the response of the aper-
ture.
Figures 11(a) and (b) show the response of bowtie aper-
tures with different sizes using properties of aluminum, in
the near- and far-field, respectively. The variance of the
permittivity shown in Fig. 8 is reflected in both the near
and far-fields and the peaks from the PEC model are dra-
Numerical analysis of the spectral response of an NSOM measurement 53
Fig. 10 Magnitude of E fields
for bowtie 550 nm nanoaperture
in 150 nm thick aluminum on
the (a) H plane and (b) E plane,
and on the (c) H plane and
(d) E plane with an NSOM
probe
matically washed out. This can be attributed to the ef-
fects of the varying permittivity of aluminum discussed
above.
Figure 12 shows the Poynting vector averaged over the
exit plane of an aluminum coated NSOM probe with a
150 nm diameter hole imaging the different sized aluminum
bowties shown previously. The initial resonant peak has
been dramatically blue shifted and the convolution with the
material properties is evident.
Examining Fig. 11(b), it can be seen that the far-field
response from the aperture is much closer to the near-field
response than that of the simulated NSOM probe measure-
ments. Figures 7 and 8 both show that it will be difficult to
resolve the resonant frequency in the near field using a small
circularly shaped aperture. Therefore, the far field measure-
ment is a better choice for studying the spectral response of
a nanoscale field.
3 Conclusions
The resonance of different sized nanoscale apertures was de-
termined numerically both in the near- and far-fields. For the
PEC system these are shown to be discrete peaks and there
is a close correlation between the near- and far- fields. How-
ever, when trying to resolve these peaks using an NSOM
probe, there is a significant attenuation for the longer wave-
lengths. For real systems, the spectral response is compli-
cated by the field penetration into the metal and the vary-
ing permittivity of the metal. These effects can be present
in both the sample and probe, complicating the near-field
measurements. Finally, it was shown that for ridge nanoscale
apertures, the resonant wavelength can be more readily de-
termined from far-field measurements than using an NSOM
system.
54 E.C. Kinzel, X. Xu
Fig. 11 Potential energy stored in the (a) near field and (b) radiated
electric field for different sized apertures in aluminum films
Fig. 12 Signal from different sized bowties using a probe with
r =75 nm with aluminum films
Acknowledgements We gratefully acknowledge the funding pro-
vided by the National Science Foundation and the Defense Advanced
Research Projects Agency. We also greatly appreciate the assistance
of Hjalti Sigmarsson and Dr. William Chappell in learning and under-
standing the HFSS software.
References
1. E.X. Jin, X. Xu, J. Microscopy 229, 503–511 (2008)
2. L. Wang, X. Xu, Appl. Phys. Lett. 90, 261105 (2007)
3. H. Bethe, Phys. Rev. 66, 163–182 (1944)
4. X. Jin, X. Xu, Jpn. J. Appl. Phys. 43, 407–417 (2004)
5. E.X. Jin, X. Xu, Appl. Phys. B 84, 3–9 (2006)
6. K. ¸Sendur, W. Challener, C. Peng, J. Appl. Phys. 96, 2743–2752
(2004)
7. J.A. Matteo, D.P. Fromm, Y. Yuen, P.J. Schuck, W.E. Moerner,
L. Hesselink, Appl. Phys. Lett. 85, 648–650 (2004)
8. D.M. Pozer, Microwave Engineering (Wiley, New York, 2003)
9. S. Ramo, J.R. Whinnery, T. Van Duzer, Fields and Waves in Com-
munication Electronics (Wiley, New York, 1994)
10. Ansoft Inc., HFSS™ high frequency structural simulator, Ver-
sion 10.1. />11. X. Shi, L. Hesselink, Jpn. J. Appl. Phys. 41, 1632 (2002)
12. E.D. Palik, Handbook of Optical Constants of Solids (Academic
Press, New York, 1998)
13. I.H. Malitson, J. Opt. Soc. Am. 55(10), 1205–1209 (1965)