resonant oscillation of misch metal atoms in filled skutterudites
Bạn đang xem bản rút gọn của tài liệu. Xem và tải ngay bản đầy đủ của tài liệu tại đây (377.8 KB, 4 trang )
Resonant Oscillation of Misch-Metal Atoms in Filled Skutterudites
Yaguo Wang,
1
Xianfan Xu,
1,
*
and Jihui Yang
2,†
1
School of Mechanical Engineering and Birck Nanotechnology Center, Purdue University, West Lafayette, Indiana 47907, USA
2
Materials and Processes Lab, GM R&D Center, Warren, Michigan 48090, USA
(Received 20 December 2008; published 1 May 2009)
We investigate vibrational behaviors in misch-metal filled antimony skutterudites in the time domain.
At higher filling ratios of guest atoms, the vibration frequency approaches that of the cage structure and
the amplitude becomes stronger. Furthermore, the reduction of lattice thermal conductivity over a wide
temperature range can be explained using the measured resonant vibrational frequency. These findings
reveal that the reduction of the lattice thermal conductivity is a result of scattering of acoustic phonons due
to the resonant interaction between guest atoms and lattice phonons.
DOI: 10.1103/PhysRevLett.102.175508 PACS numbers: 63.20.Àe, 65.40.Àb, 78.47.JÀ
Caged compounds such as skutterudites and clathrates
filled with guest atoms are found to have a significantly
reduced thermal conductivity [1,2], favorable for being
used as thermoelectric materials. A concept called
‘‘phonon-glass-electron-crystal (PGEC)’’ was used to de-
scribe the role of guest atoms in the cages constructed by
host atoms [3]. The guest atoms are weakly bonded to the
cage structure and vibrate locally and incoherently, hence
the name ‘‘rattler’’. These rattlers provide an extra phonon-
scattering channel and decrease the phonon mean free path,
which results in the suppression of the lattice thermal
conductivity [4]. Vigorous efforts have been directed to-
ward revealing the vibrational properties of filled skutter-
udites. Infrared (IR) absorption spectroscopy [5] and
Raman spectroscopy [6,7] were used to identify IR and
Raman active modes. Rattling of guest atoms, on the other
hand, was not observed in Raman spectroscopy, consistent
with first-principles calculations that showed rattling is not
Raman active [8]. Inelastic neutron scattering [9,10] and
nuclear inelastic scattering [11] were used to determine the
low-energy localized vibration modes of the rattlers. The
PGEC paradigm was challenged in two recent studies
[12,13]. Neutron spectroscopy and ab initio computations
of La- and Ce-filled Fe
4
Sb
12
skutterudites showed well-
defined phase relations and quasiharmonic coupling be-
tween the guests and the host lattice, and the phonon
crystal behavior of the host [12]. In another neutron
triple-axis spectroscopy study, the guest atoms in a clath-
rate material were found to lower the velocity of acoustic
phonons [13]. Therefore, it is still an open question regard-
ing the role of guest atoms.
Here we carry out ultrafast time-resolved optical mea-
surements to investigate vibrational behaviors of filled
antimony skutterudites. Ultrafast time-resolved optical
measurement is a powerful tool to detect vibrational modes
[14,15] and has been used recently to investigate phonon
vibrations and scattering in Bi and Bi
2
Te
3
=Sb
2
Te
3
super-
lattice materials [16,17]. In this work, the ultrafast optical
measurement is used to elucidate interactions between
guest atoms and the host lattice in misch-metal filled
antimony skutterudites. For the first time, vibrations
caused by guest atoms is observed in the time domain.
The results reveal strong interactions between guest atoms
and the host lattice that reduce lattice thermal conductivity.
Samples were prepared using procedures documented in
other publications [18]. The filling materials are misch
metal noted by Mm. The starting misch metal consists of
Ce, La, Nd, Pr, Si, Fe, Al and O with atomic percentages of
50.75, 22.75, 16.22, 5.72, 3.35, 0.72, 0.50, and less than
0.01, respectively, which were determined using Electron
Probe Microanalysis (EPMA) with an uncertainty less than
2%. The use of misch metal instead of pure rare-earth
elements was mainly due to its much lower cost and there-
fore its potentials for being used in commercial products. It
is noted that the four primary rare-earth elements in the
misch metal, Ce, La, Nd, and Pr, consist of 95.44% of the
total material whereas their atomic weights vary from
138.9 to 144.2 only. Therefore, it is expected that the misch
metal would have similar effect as those pure rare-earth
elements. Five samples are studied in this work, including
one unfilled skutterudite sample. Their compositions, de-
termined by EPMA, and corresponding nominal represen-
tations are listed in Table I. X-ray powder diffraction was
performed on a Philips diffractometer and the data indicate
all samples are phase pure with the exception of trace
amounts of Sb, FeSb
2
and MmSb
2
( 1 vol%).
TABLE I. Nominal representations and compositions of filled
and unfilled skutterudites.
Nominal representation Composition
Co
0:9
(unfilled) Co
0:9
Fe
0:1
Sb
3
Mm
0:55
Mm
0:55
Fe
2:44
Co
1:56
Sb
11:96
Mm
0:65
Mm
0:65
Fe
2:92
Co
1:08
Sb
11:98
Mm
0:72
Mm
0:72
Fe
3:43
Co
0:57
Sb
11:97
Mm
0:82
Mm
0:82
Fe
4
Sb
11:96
PRL 102, 175508 (2009)
PHYSICAL REVIEW LETTERS
week ending
1 MAY 2009
0031-9007=09=102(17)=175508(4) 175508-1 Ó 2009 The American Physical Society
Ultrafast optical measurements are performed in a col-
linear pump-probe scheme. Laser pulses with 50 fs FWHM
(full width at half maximum) are generated by a Spectra
Physics Ti:sapphire system with the center wavelength at
800 nm and a repetition rate of 1 kHz. A second harmonic
crystal is used to generate pump pulses centered at 400 nm.
The pump and probe beams are focused onto the sample at
normal direction with diameters of 80 and 20 m and
fluences of 2:2mJ=cm
2
and 0:02 mJ=cm
2
, respectively.
The pump beam is modulated by a chopper and the re-
flected probe beam is measured. The time resolution is
about 7 fs.
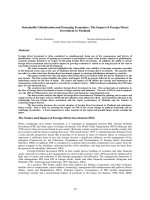
Time-resolved reflectivity data of all the samples are
shown in Fig. 1. The difference in the immediate responses
in the filled and unfilled samples is due to the change to the
electronic structure and its excitation state by filling, and
the nature of this change will be investigated in another
study. Figure 1(b) shows the oscillation signals after re-
moving the background nonoscillatory part using a digital
filter. The dominant oscillation frequencies can be deter-
mined by fitting the experimental data with a damping
harmonic oscillator model [17,19], and the fitted frequen-
cies are listed in Table II. For the filled skutterudites, the
uncertainty in frequency determination is about
Æ0:02 THz. The damping and revival behavior of oscilla-
tion in Mm
0:65
indicates the existence of two vibrational
modes, and two oscillators are used to fit the data. For the
unfilled sample, the oscillation is weaker and only the first
few oscillations were used, and the vibration frequency is
found to be about 4.6 THz with an uncertainty of
Æ0:2 THz.
An important finding from Fig. 1(b) is that the vibra-
tional amplitude increases with increasing filling ratio,
indicating the effect of filling on the vibration of the
guest-host system. To identify these strong oscillations,
the Stokes Raman spectra are also collected on the same
samples using a Jobin Yvon T64000 Raman system with a
514.5 nm excitation source and a spectral resolution better
than 1cm
À1
. It can be seen from Fig. 2 that, whereas the
Raman measurements detect the A
g
optical phonon modes
in the host lattice, the modes measured with ultrafast
optical experiments are in general different from the
Raman modes. The two dashed lines in Fig. 2 shows the
two A
g
modes of the Sb
4
ring [6], and the arrows are the
frequencies obtained from the ultrafast optical measure-
ments. Table II and Fig. 2 show that, with lower filling
ratios, the differences between the Raman modes and the
ultrafast pump-probe measured modes are larger. This is
consistent with the theory that vibrations associated with
-10
0
10
20
30
40
012345
Delay (ps)
∆
R/R (X 10
-3
)
Co
0.9
Mm
0.55
Mm
0.65
Mm
0.72
Mm
0.82
(a)
0
1
2
3
4
12345
∆R/R (X 10
-3
)
Mm
0.82
(b)
Mm
0.72
Mm
0.65
Mm
0.55
Co
0.9
Delay (ps)
FIG. 1. Time-resolved reflectivity of unfilled and filled
samples. (a) The as-recorded data. The oscillations are due to
the host lattice in the unfilled skutterudite or interactions be-
tween the guest atoms and host lattice in the filled skutterudites
(see text). (b) Oscillatory signals after the carrier signals are
removed. The ‘‘x’’ symbols are experimental data points, and the
lines are fitting results. In both (a) and (b), data are shifted along
the vertical axis for clarity.
TABLE II. Frequencies of oscillation in unfilled and filled
skutterudites.
Sample Co
0:9
Mm
0:55
Mm
0:65
Mm
0:72
Mm
0:82
(THz) 4.6 4.82 4.76, 4.42 4.69 4.62
0
2
4
6
8
60 80 100 120 140 160 180 200
1.6 2.4 3.2 4 4.8 5.6
Intensity (Arb. Units)
Raman Shift (cm
-1
)
Mm
0.82
Mm
0.72
Mm
0.65
Mm
0.55
Co
0.9
Vibration Frequency (THz)
FIG. 2. Raman spectra. Vertical dashed lines mark the two A
g
modes of the Sb
4
ring, and the arrows show the frequencies from
ultrafast optical experiments. Data are shifted vertically for
clarity. The vibration frequencies measured in the ultrafast
measurement approach that of the host Sb4 ring at higher filling
ratio, indicating stronger guest-host interactions at a higher
filling ratio.
PRL 102, 175508 (2009)
PHYSICAL REVIEW LETTERS
week ending
1 MAY 2009
175508-2
the filled atoms are not Raman active [8]. As the filling
ratio increases, the vibration frequency approaches that of
the lower-frequency A
g
mode of the Sb
4
ring structure.
This is because with a higher filling ratio, the interactions
between guest atoms and the host lattice become stronger
(the larger vibrational amplitude in the ultrafast optical
measurement). This stronger interaction causes the vibra-
tion frequency to shift closer to that of the host lattice,
which was predicted by Li et al. [7].
The collective motion of guest atoms and the host lattice
is also similar to the results obtained in Koza et al.’s work,
where the coherent coupling between guest atoms and the
host lattice was detected even though their work was
focused on lower energy modes [12]. Also as suggested
by Keppens et al., there exist two eigenmodes of filled
atoms in La
0:9
Fe
3
CoSb
12
[9]: the more localized lower-
frequency mode is associated with La moving towards the
‘‘void’’ and the higher frequency mode is the motion
towards a nearest-neighboring Sb atom. The oscillations
observed in ultrafast optical experiments are related to the
higher frequency coupling between guest atoms and host
Sb atoms.
To evaluate the effect of vibrational modes on lattice
thermal conductivity, the measured vibration frequencies
are used to compute lattice thermal conductivity using the
resonance scattering model [ 20]. Thermal conductivity
measurements were made in a Quantum Design physical
property measurement system between 2 and 300 K. The
electronic contributions to the conductivity were sub-
tracted using the data from resistivity measurements and
the Wiedemann-Franz Law. The accuracy of our thermal
conductivity data is 10% near room temperature and aver-
ages about 5% over the measurement temperature range.
According to the Debye theory, lattice thermal conductiv-
ity can be expressed as [21]:
L
¼
k
B
2
2
k
B
T
@
3
Z
D
=T
0
x
4
e
x
À1
C
ðe
x
À 1Þ
2
dx; (1)
where x ¼ @!=k
B
T, @ is the reduced Planck constant, !
the phonon frequency, k
B
the Boltzmann constant, T the
absolute temperature, the sound velocity,
D
the Debye
temperature, and
C
the phonon relaxation time which can
be described as a summation of various phonon-scattering
processes [18,20]:
À1
C
¼
L
þ A!
4
þ B!
2
T exp
À
D
3T
þ
C!
2
ð
2
À !
2
Þ
2
;
(2)
where L, A, B, and C represent grain-boundary, point
defect, umklapp, and phonon resonant scattering, respec-
tively. The last term, the phonon resonant scattering, is the
resonant interaction between guest atoms and lattice pho-
nons, with the resonant frequency obtained from the
ultrafast optical measurements. The Debye temperature
D
used in the calculation is 270 K for all samples, which is
determined from the temperature dependent specific heat
measurement.
Figure 3 shows that lattice thermal conductivities of
filled and unfilled samples can be modeled very well
over the entire 2 orders of magnitude temperature span.
The dashed lines in Figs. 3(b)–3(e) show lattice thermal
conductivities without the resonant scattering term. It is
clear that resonant scattering of phonons is effective in
reducing lattice thermal conductivity. Table III lists the
parameters used in computing the data in Fig. 3. The
influence on lattice thermal conductivity from each pa-
rameter was discussed in a sensitivity study in a previous
publication [18]. The fact that each parameter dominates a
different temperature range allows for determining the
fitting parameters relatively accurately. Here, based on
Æ5% experimental uncertainty of thermal conductivity
data, the uncertainties of L, A, B, and C are estimated to
0
1
2
3
4
5
6
7
8
0 50 100 150 200 250 300
Temperature(K)
κ
L
(W m
-1
K
-1
)
Co
0.9
(a)
0
1
2
3
4
0 50 100 150 200 250 300
κ
L
(W m
-1
K
-1
)
Temperature(K)
Mm
0.55
(b)
0
1
2
3
4
0 50 100 150 200 250 300
Temperature(K)
Mm
0.65
κ
L
(W m
-1
K
-1
)
(c)
0
1
2
3
4
5
0 50 100 150 200 250 300
Temperature(K)
κ
L
(W m
-1
K
-1
)
Mm
0.72
(d)
0
1
2
3
4
5
6
05010015020025030
0
Temperature(K)
Mm
0.82
κ
L
(W m
-1
K
-1
)
(e)
FIG. 3. Lattice thermal conductivities as a function of tem-
perature. Circles are experimental data. Solid and dashed lines
are calculation results with and without resonant scattering,
respectively.
TABLE III. Parameters used in Eqs. (1) and (2).
Samples L (m) A (10
À43
s
3
) B (10
À18
sK
À1
) C (10
38
s
À3
)
Co
0:9
3.03 84.754 5.951 0
Mm
0:55
4.35 404.88 6.712 1.736
Mm
0:65
3.15 267.707 8.66 1.851
Mm
0:72
7.21 244.562 11.461 2.897
Mm
0:82
2.37 96.667 16.07 4.988
PRL 102, 175508 (2009)
PHYSICAL REVIEW LETTERS
week ending
1 MAY 2009
175508-3
be about Æ32%, Æ20%, Æ20%, and Æ10%, respectively.
It is also noticed from Fig. 3 that thermal conductivity
reductions in all filled samples are similar. This is because
the resonant scattering causes more reduction in thermal
conductivity in samples with higher filling ratio (Fig. 3),
whereas scattering from point defect is maximum when the
filling ratio is about 50%. Phonon-point defect scattering is
mainly due to the mass fluctuation between filled atoms (y)
and void (1-y)[22]. Figure 4 plots the point defect scatter-
ing parameter A against yð1-yÞ and a linear dependence can
be seen, which is consistent with [22].
Our results suggest that interactions between guest
atoms and the host lattice reduce the lattice thermal con-
ductivity. This is not exactly the same as the PGEC theory
[1,3,4] that the rattling of guest atoms causes thermal
conductivity reduction. Our results suggest, instead of
guest atoms acting alone, the resonant interactions between
guest atoms and the host lattice (the mode between the
guest atoms and the neighboring Sb atoms described in [9])
causes additional scattering to the acoustic phonons and
reduces lattice thermal conductivity.
In summary, we investigated vibrational behaviors of
misch-metal filled antimony skutterudites in the time do-
main using ultrafast optical measurements. Our results
revealed resonant interactions between guest atoms and
the host lattice. The reduction of lattice thermal conduc-
tivities was explained with the measured vibration fre-
quencies over a large temperature range, indicating that
resonant interactions between guest atoms and the host
lattice act as additional scattering centers of acoustic pho-
nons and reduce lattice thermal conductivity.
We want to thank Dr. A. Q. Wu for his initiative and
valuable efforts on this project, and Dr. V. Drachev for his
help on Raman spectroscopy. Partial support to this work
by the Sandia National Laboratory (No. 620550) and the
Air Force Office of Scientific Research (FA9550-08-1-
0091) are gratefully acknowledged. J. Y. wants to thanks
Jan F. Herbst and Mark Verbrugge for continuous support
and encouragement. The work is also in part supported by
G.M. and by the Department of Energy under corporate
agreement DE-FC26-04NT42278.
*To whom correspondence should be addressed. Phone:
(765) 494-5639
†
[1] B. C. Sales, D. Mandrus, and R. K. Williams, Science 272,
1325 (1996).
[2] K. A. Kovnir and A. V. Shevelkov, Russian Chemical
Reviews 73, 923 (2004).
[3] G. A. Slack, in CRC Handbook of Thermoelectrics, edited
by D. M. Rowe (CRC Press, Boca Raton, 1995).
[4] G. S. Nolas, D. T. Morelli, and T. M. Tritt, Annu. Rev.
Mater. Sci. 29, 89 (1999).
[5] S. V. Dordevic et al., Phys. Rev. B 60, 11 321 (1999).
[6] G. S. Nolas et al., J. Appl. Phys. 79, 2622 (1996).
[7] L. X. Li et al., Chem. Phys. Lett. 347, 373 (2001).
[8] J. L. Feldman et al., Phys. Rev. B 68, 094301 (2003).
[9] V. Keppens et al., Nature (London) 395, 876 (1998).
[10] R. P. Hermann et al., Phys. Rev. Lett. 90, 135505 (2003).
[11] G. J. Long et al., Phys. Rev. B 71, 140302 (2005).
[12] M. M. Koza et al., Nature Mater. 7, 805 (2008).
[13] M. Christensen et al., Nature Mater. 7, 811 (2008).
[14] T. K. Cheng et al., Appl. Phys. Lett. 57, 1004 (1990).
[15] T. E. Stevens, J. Kuhl, and R. Merlin, Phys. Rev. B 65,
144304 (2002).
[16] A. Q. Wu, X. Xu, and R. Venkatasubramanian, Appl. Phys.
Lett. 92, 011108 (2008).
[17] Y. Wang, X. Xu, and R. Venkatasubramanian, Appl. Phys.
Lett. 93, 113114 (2008).
[18] J. Yang et al., Phys. Rev. B 67, 165207 (2003).
[19] O. V. Misochko et al., Phys. Rev. Lett. 92, 197401 (2004).
[20] R. O. Pohl, Phys. Rev. Lett. 8, 481 (1962).
[21] J. Callaway, Phys. Rev. 113, 1046 (1959).
[22] G. P. Meisner et al., Phys. Rev. Lett. 80, 3551 (1998).
0
100
200
300
400
500
0.14 0.16 0.18 0.2 0.22 0.24 0.26
y(1-y)
A (10
-43
s
3
)
FIG. 4. Point defect scattering coefficient A vs yð1-yÞ, where y
is the filling ratio.
PRL 102, 175508 (2009)
PHYSICAL REVIEW LETTERS
week ending
1 MAY 2009
175508-4