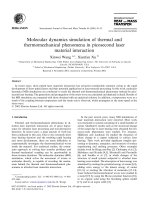
thermophysical properties of thermal barrier coatings
Bạn đang xem bản rút gọn của tài liệu. Xem và tải ngay bản đầy đủ của tài liệu tại đây (246.3 KB, 7 trang )
Surface and Coatings Technology 120–121 (1999) 89–95
www.elsevier.nl/locate/surfcoat
Thermophysical properties of thermal barrier coatings
R.E. Taylor a,
*
, X. Wang b,X.Xub
a TPRL Inc., 2595 Yeager Road, West Lafayette, IN 47906, USA
b Purdue University, School of Mechanical Engineering, West Lafayette, IN 47907, USA
Abstract
Thin layers of thermal barrier coating (TBCs) are applied to metallic components of heat engines to reduce metal temperatures
and to provide environmental protection. This results in increased engine efficiency and prolonged operational life. Of special
current interest is the use of TBCs in aircraft engines. The TBCs, often yttria-stabilized zirconia ( YSZ ), are deposited on nickel
or cobalt-based superalloy components used in high-temperature environments. The thermophysical properties (especially thermal
conductivity) of the coatings are extremely important since, together with the coating thickness, they control the temperature drop
across the coating. Accurate determinations of the thermal conductivity of the coating are critical in designing the engines and in
research aimed at decreasing the thermal conductivity of TBCs. Such research includes very thin multiple layers, compositional
changes and deposition techniques. The number of potentially applicable techniques is limited because of the sample configurations.
Consequently, the reproducibility of results from a technique or agreement between the results from different techniques may not
be satisfactory. © 1999 Elsevier Science S.A. All rights reserved.
Keywords: Thermal barrier coatings; Thermal conductivity; Thermal diffusivity; Thin layers; Zirconia
1. Introduction whereas excellent results measured using the same tech-
niques on near ideal samples have not been released for
publication. Thus, analysts may draw erroneous conclu-Thin layers (usually 5–10 mil thick) of thermal barrier
coatings (TBCs) are applied to metallic components of sions concerning the validity of techniques as well as
the magnitude of the thermal conductivity values.heat engines to reduce their operating temperatures,
increase environmental protection and extend the life of
the components. Currently of special interest is the use
of TBCs in aircraft engines. Values of the thermophysical
2. Measurement techniques for thermal conductivity
properties, especially thermal conductivities of these
determination
coatings, are extremely important since temperature
drops across the coatings are controlled by the thermal
Although a number of techniques have been
conductivity and operating temperature. Thus, accurate
employed, the overwhelming majority of the measure-
determinations of the thermal conductivity are critical
ments have been performed by three methods: (1) laser
in designing the engines and in research to improve (in
flash diffusivity, (2) 3-omega, and (3) photoacoustic.
this case to decrease) the thermal conductivity of TBC
These methods are all described extensively in the litera-
coatings. A number of techniques have been used to
ture; only brief descriptions will be given here.
determine the thermal conductivity of TBC coatings,
The laser flash technique [1,2], which is an ASTM
but there has been no summary paper published on an
standard method ( E1461), involves subjecting the entire
inter-comparison of results by different techniques under
front surface of a small (coin size) specimen to a very
controlled conditions — although the scatter of results
short burst of energy from a laser. The irradiation times
even from the same technique have sometimes been
are typically less than 1 ms. The resulting temperature
substantial. Unfortunately, poor results from measure-
rise curve for the rear surface is recorded and analyzed
ments on improperly sized samples have been published,
(Fig. 1). The analysis includes comparing this experi-
mental curve with that calculated from the mathematical
* Corresponding author.
solution of a semi-infinite specimen initially at a constant
0257-8972/99/$ – see front matter © 1999 Elsevier Science S.A. All rights reserved.
PII: S0257-8972(99)00339-4
90 R.E. Taylor et al. / Surface and Coatings Technology 120–121 (1999) 89–95
Fig. 1. Schematic of laser flash technique.
temperature subjected to a flash of energy. A large heating element is deposited on the sample to form a
number of diffusivity values can be calculated from the
narrow line source of heat on the surface of an infinite
rise curve. The equation is a=K
x
l2/t
x
where a is the
half volume using either photolithography or evapora-
thermal diffusivity, K
x
are known constants correspond-
tion through a mask. An a.c. power of controllable
ing to different percentage rises, l is the sample thickness
frequency is supplied to the heater, and the temperature
and t
x
is the elapsed time for the rear face temperature
response of the heater is determined from its resistance.
to rise to x% of its maximum. The maximum rise is
The thermal conductivity is determined from the power
typically about 1°C, so all the diffusivity values are
and the third harmonics of the voltage oscillations. The
based on essentially the same ambient temperature. The
method is useful for very thin films, but so far, it has
raw data can be examined on-line and appropriate
been limited to temperatures below 500°C.
corrections made for heat losses, [3] finite pulse time
The photoacoustic technique [6 ] involves periodic
offset [4] or non-uniform heating. This elegant, rapid,
heating of the surface of the sample by a radiant heat
well-developed method uses small samples of simple
source. The sample is in a small acoustic chamber. The
geometry and is useful over an extremely large range of
surface heating causes acoustic waves that are detected
diffusivity values and measurement temperatures. Well
by microphones. A schematic of the experimental appa-
over one-half of the conductivity values measured since
ratus for the photoacoustic measurement is shown in
1980 have been obtained by this technique. In order to
Fig. 2. The diffusivity of the sample is determined from
convert diffusivity results to thermal conductivity values,
the phase lag between the heat source and the acoustic
the diffusivity results are multiplied by the bulk density
wave and/or the ratio between the amplitude of the
(d) and specific heat (C
p
). Both of these properties are
acoustic signal of the sample and the amplitude of the
thermodynamic properties, relatively insensitive to
acoustic signal of a reference with known thermal and
microstructure, small variations in composition, etc.,
optical properties. Theoretical relations between the
and are relatively easy to determine. Therefore, the
phase lag and thermal and optical properties and
conversion of diffusivity values to conductivity values
the geometry of the sample have been well established
generally is not of major concern, and the diffusivity,
[6 ]. In practice, to improve the measurement accuracy,
specific heat, density route is usually more accurate than
the unknown thermal diffusivity is obtained from a
heat flux, temperature gradients and sample geometry
procedure of curve-fitting of the measured phase lag or
determinations.
amplitude ratio in the frequency range used in the
The 3-omega technique was developed by Cahill [5].
experiment. Generally, the photoacoustic signal is mea-
It is similar to the hot-wire technique in that it utilizes
sured in the frequency range between 100 and 20 000 Hz.
radial flow of heat from a single element that is used as
The maximum temperature rise at the sample surface is
both heater and thermometer. The major difference is
estimated to be less than 0.5°C. The method is limited
the use of the frequency dependence of a temperature
oscillation instead of a time domain response. A narrow in temperature range due to the microphones.
91R.E. Taylor et al. / Surface and Coatings Technology 120–121 (1999) 89–95
Fig. 2. Schematic of the photoacoustic technique.
3. Sensitivity study of laser flash technique An unpublished study at TPRL based on 5 mil TBC
coatings on 14 mil superalloy substrates, demonstrated
that accuracies and reproducibilities of several per centSensitivity studies of the laser flash technique for
measurements on TBCs have been carried out. The could be achieved from 100 to 1200°C (Fig. 4). Thus,
the laser flash technique is quite capable of yieldinginput parameters that enter into a two-layer calculation
are the thicknesses, densities and specific heats of each useful data for coatings of the thicknesses contemplated
for aircraft engine use.layer, the diffusivity of one layer and the measured half
rise times. The sensitivity of each of these parameters
also depends on the relative values between these param-
eters for the various layers, i.e. the relative magnitudes
4. Comparison of results by different measurement
of the layer thicknesses and the relative magnitudes of
techniques
the diffusivity/conductivity values of the coating and
substrate. The calculations of the properties of the
There has been no published account of a round-
unknown layer is based upon parameters estimation (i.e.
robin program specifically aimed at inter- comparing
iterative) procedures. The results of a sensitivity analysis
results on the same TBC/superalloy composite samples.
for a 11 mil YSZ layer bonded onto a 25 mil superalloy
However, several samples were measured using the laser
substrate are shown in Fig. 3 [7]. The abscissa is the
flash method at TPRL and by the photoacoustic tech-
percentage error in an input parameter, and the ordinate
nique at Purdue University. Only the amplitude method
is the resulting change in the calculated thermal conduc-
was used in the calculations for the photoacoustic tech-
tivity value. For example, a 10% error in coating thick-
nique since the TBC layer was too thick for the use of
ness, i.e. 0.0010 inches (1 mil ), causes a 20% error in
the phase lag method. The major source of error in
the calculated conductivity values. However, a curve
using the amplitude method comes from the uncertain-
that is almost horizontal, such as that for substrate
ties in determining the surface reflectivity. Since the
density or specific heat, indicates that the errors in those
surface of the TBC sample is fairly rough, the uncer-
parameters have a negligible effect. For the same config-
tainty of measuring the reflectivity, which includes both
uration of a 4.1 mil coating on a 24 mil substrate, the
the diffuse and the specular components, is estimated to
most sensitive parameters are the substrate thickness,
be ±10%. Using the numerical analysis, this uncertainty
substrate diffusivity and measured half-times [7]. In
in reflectivity causes about ±10% of uncertainty in
other words, several parameters associated with the
determining the conductivity values of the sample 1758.
substrate dominate the accuracy of the calculated con-
Samples 1736 and 1787 are also measured using the
ductivity values of the coating. This is due to the fact
amplitude method and are subjected to the same uncer-
that the major portion of the transit time for the heat
tainty analysis.
pulse is associated with the substrate. The time associ-
The results for the two techniques are compared in
ated with the coating is relatively small, and errors in
Table 1. It can be seen that the results obtained from
the substrate parameters have a large effect on this
the two techniques agree with each other within the
value. The same study [7] showed that measuring the
experimental uncertainty range. However, the agreement
conductivity values of a 3.3 mil YSZ layer on a 120 mil
for Sample 1736 may be fortuitous. The uncertainty in
the layer thicknesses of this sample is large. This samplesuperalloy was untenable by the usual flash technique.
92 R.E. Taylor et al. / Surface and Coatings Technology 120–121 (1999) 89–95
Fig. 3. Errors in calculated conductivity values for a 11 mil YSZ layer bonded onto a 25 mil superalloy substrate caused by errors in input
parameters.
consisted of 2.6 mil TBC on 110 mil substrate, and this mal conductivity of the TBC by increasing atomic scale
disorder.is a very poor ratio for the laser flash. As discussed
previously, for the laser flash method, the uncertainty Taylor [7], Josell et al. [9] and Lee et al. [10] have
all shown that the interfacial resistance of TBCs con-in thickness greatly affects the thermal conductivity
results. However, the thickness value is not needed when sisting of many thin YSZ layers is small. Thus, the
conductivity values of such composites are essentiallythe photoacoustic method (the amplitude method) is
used. The data obtained from the photoacoustic method equal to those calculated from the conductivity values
of the constituents and their volume fractions, and noshould be more reliable for this sample.
Although 3-omega measurements were not performed advantage is gained by fabricating TBCs consisting of
many thin layers.on these samples, it was stated that 3-omega and laser
flash measurements have yielded comparable results The general effects of porosity on thermal conductiv-
ity of mixtures have been extensively studied. There arewhere near optimum type samples were employed [8].
numerous equations relating thermal conductivity to
porosity. These are usually based on equations for
binary mixtures, with the pores being a discontinuous5. TBC studies
phase with negligible conductivity [11]. Equations that
take into account pore geometry such as spherical,There are three obvious ways to attempt to lower the
thermal conductivity of TBCs. These are: (1) to make platelets ( laminae) and cylinders and orientation have
been derived or determined empirically [11]. Since thethe TBCs of many thin alternating layers to create a
significant interfacial resistance; (2) to increase and various equations yield a variety of values, it is usually
possible to fit porosity data reasonably well to at leastcontrol porosity; and (3) to decrease the inherent ther-
93R.E. Taylor et al. / Surface and Coatings Technology 120–121 (1999) 89–95
Fig. 4. Errors in calculated conductivity values for a 5 mil YSZ layer bonded onto a 15 mil superalloy substrate caused by errors in input parameters.
one equation. A study specifically aimed at studying the with producing low conductivity coatings by this
approach is that the conductivity values may increaseeffects of grain size and porosity of bulk yttria-stabilized
zirconia is under way at the University of Connecticut substantially during heating. Thermal diffusivity values
for an as-sprayed TBC and sister samples heat-treatedunder the direction of Professor N. Padture [12]. The
first results show that the conductivities of dense poly- for 36 h at 1090°C (36-1093), 5 h at 1371°C (5-1371)
and 100 h at 1371°C (100-1371) are shown in Fig. 5 [7].crystalline and single crystal YSZ are the same. Data
on the relation between the thermal conductivity and The density values for these samples were 5.100, 5.104,
5.006 and 5.066 g cm−3, respectively. The increase inthe pore size and total porosity have been obtained and
are in the course of publication [12]. diffusivity values with increasing heat treatment is evi-
dent, and the changes are substantial. Because theThe microstructure of TBCs is well known to substan-
tially influence the thermal conductivity. The problem specific heat values (Table 2) are essentially unchanged
and the density changes are relatively small, the conduc-
tivity value changes mirror the diffusivity value changes.
Table 1
Since the material is to be used in high-temperature
Comparison of conductivity values
engines with a long operating life, these changes are
Sample Laser flash Photoacoustic
important [7].
I.D. ( W cm−1 K−1)(Wcm−1 K−1)
1736 0.0042a 0.0045
1758 0.0066 0.0061
6. Summary and conclusions
1787 0.0096 0.0098
The thermal conductivity values for ZRO
2
and TBCs
a 2.6 mil TBC on 110 mil substrate according to supplier. Very non-
are low (in the range of 0.004–0.012 W cm−1 K−1) and
optimum for laser flash. Value uncertain within ±20% due to uncer-
tainty in thicknesses.
are not strongly temperature-dependent. The low
94 R.E. Taylor et al. / Surface and Coatings Technology 120–121 (1999) 89–95
Fig. 5. Thermal diffusivity values of plasma-sprayed YSZ subjected to heat treatment for various times (h) and temperatures (°C ). ‘Cool’ refers to
cooling curve data.
values are caused by atomic disorder, and thus grain TBC/substrate composites by the laser flash, photo-
acoustic or 3-omega techniques under specified condi-
boundary scattering and interfacial resistance do not
tions. Each technique has its advantages and
play a major role. Reliable thermal conductivity values
disadvantages. The laser flash technique can readily be
for TBCs can be obtained on free-standing or
used from below room temperature to the melting point
of the substrate, whereas the other techniques are useful
Table 2
only at lower temperatures. However, the flash technique
Specific heat values
depends critically upon the coating and substrate thick-
Temperature (°C ) Specific heat (J/gC)
ness, whereas the other techniques do not. A particularly
attractive approach is to measure the values near room
23 0.469
temperature using both the laser flash and the photoa-
100 0.499
coustic (or 3-omega) techniques and then use the flash
200 0.542
technique for higher temperature measurements. A com-
300 0.569
400 0.593
parison of the near room temperature values by the
500 0.605
other techniques can be used to determine the effective
600 0.618
coating and substrate thicknesses for the flash
700 0.621
experiments.
800 0.630
900 0.637
1000 0.645
1100 0.647
Acknowledgements
1200 0.649
1400 0.653
The authors wish to acknowledge the contributions
1500 0.655
of the TPRL staff, especially Mr H. Groot and Ms
95R.E. Taylor et al. / Surface and Coatings Technology 120–121 (1999) 89–95
urement Methods, Recommended Measurement Techniques and
J. Ferrier for their efforts in measuring TBCs. We also
Practices Vol. 2 , Plenum Press, New York, 1992, p. 281.
wish to thank Prof. K.S. Ravichandran of The
[3] L.M. Clark III,, R.E. Taylor, J. Appl. Phys. 46 (1975) 714.
University of Utah for preparing some of the samples
[4] R.E. Taylor, L.M. Clark III, High Temp. High Press. 6 (1974) 64.
measured in this project.
[5] D.G. Cahill, Rev. Sci. Instrum. 62 (2) (1990) 802.
[6 ] A. Rosencwaig, A. Gersho, J. Appl. Phys. 47 (1976) 64.
[7] R.E. Taylor, Mater. Sci. Eng. A 245 (1998) 160.
[8] W.P. Allen, United Technologies Research Center, E. Hartford,
CT, private communication.
[9] D. Josell, A. Cezairliyan, J.E. Bonevich, Int. J. Thermophys. 19
References
(2) (1998) 525.
[10] S M. Lee, D.G. Cahill, W.P. Allen, Microscale Thermophys.
Eng. 2 (31–36) (1998) 31.[1] R.E. Taylor, K.D. Maglic
´
, K.D. Maglic
´
, A. Cezairliyan, V.E.
Peletsky (Eds.), Compendium of Thermophysical Property Meas- [11] A.E. Powers, KAPL-2145 UC-25, Metals, Ceramics and Materials
Report (TID-4500) Conductivity in Aggregates, 16th editionurement Methods, Survey of Measurement Techniques Vol. 1,
Plenum Press, New York, 1984, p. 305. (1961).
[12] N. Padture, The University of Connecticut, private[2] K.D. Maglic
´
, R.E. Taylor, K.D. Maglic
´
, A. Cezairliyan, V.E.
Peletsky (Eds.), Compendium of Thermophysical Property Meas- communication.