removal of basic blue 159 from aqueous solution using
Bạn đang xem bản rút gọn của tài liệu. Xem và tải ngay bản đầy đủ của tài liệu tại đây (864.96 KB, 12 trang )
Journal of Applied Chemical Research, 7, 4, 51-62 (2013)
Journal of
Applied
Chemical
Research
www.jacr.kiau.ac.ir
Removal of Basic Blue 159 from Aqueous Solution Using
Banana Peel as a Low-Cost Adsorbent
Maral Pishgar
1*
, Mohammad Esmaeil Yazdanshenas
2
, Mohammad Hosein Ghorbani
1
,
Khosro Farizadeh
3
1
Islamic Azad University, South Tehran Branch, Tehran, Iran
2
Islamic Azad University, Yazd Branch, Textile Department, Yazd, Iran
3
Islamic Azad University, Shahre Rey Branch, Textile Department, Tehran, Iran
Received 30 Jun. 2013; Final version received 12 Aug. 2013
Abstract
In this paper, the adsorption of Basic Blue159 (BB159) onto banana peel as a low-cost
material was studied. At rst, the banana peel was sieved. Later, banana peel particles
were characterized by eld emission scanning electron microscopy (FESEM), energy
dispersive x-ray spectroscopy (EDXS) and Fourier Transform Infrared (FTIR) techniques.
Batch adsorption experiments were carried out as a function of pH, contact time, initial dye
concentration, the mass of adsorbent and mixing speed. Batch adsorption models, based on
the assumption of the Pseudo-rst-order, Pseudo-second-order, Elovich and Intraparticle
diffusion mechanism, showed that kinetic data follow closely the pseudo-second-order model.
Results indicate that banana peel could be used as an adsorbent to remove the cationic dyes
from contaminated watercourses.
Key words: Banana peel, Kinetic, Low-Cost material, Basic dye, Banana peel.
Introduction
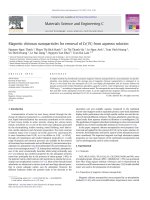
Textile industries have shown a signicant increase
in the use of synthetic complex organic dyes as
coloring materials [1]. Adsorption has been used
extensively in industrial process for separation and
purication. The removal of colored and colorless
organic pollutants from industrial wastewater
is considered as an important application of
adsorption processes [2].Treatment of dye
wastewater involves physico-chemical methods
such as coagulation, precipitation, adsorption
by activated coal, oxidation by ozone, ionizing
radiation and ultra ltration. These methods are
costly, less efcient, has limited application but
*Corresponding author: Maral Pishgar, Islamic Azad University, South Tehran Branch, Tehran, Iran, Email: maral.pishgar@gmail.
com. Tel.: +989127620508.
M. Pishgar et al., J. Appl. Chem. Res., 7, 4, 51-62 (2013)
52
also generate wastes which are difcult to dispose
off [3].
The search for alternative sources of nutrients,
such as agricultural residues, has a double
advantage: they add value to this waste while
lowering the costs of producing enzymes. Another
interesting feature of lignocelluloses residues is
the physical–chemical properties of the functional
groups available on their surface. These groups are
responsible for the adsorption capacity of some
specic solutes through ionic interactions. Natural
sorbents have been obtained from agricultural
waste, such as corn cobs, coconut shell, sugar cane
bagasse and fruit peel like orange and banana [4].
Banana, which belongs to the Musaceae family,
is native to the Indonesian Malaysian region
of Asia. Banana peel is a solid waste with high
carbohydrate content, around 60% of dry matter.
It is thus possible that it supports fungal growth
[5]. The production of bananas and plantains in
the world exceeded 94 million tons by 2008, with
Africa, Latin America and the Caribbean being
the major exporters [6]. At the time of harvest, a
banana plants estimated to have a weight of 100
kg, of which 15 kg correspond to leaves, 50 kg to
pseudo-stalks, 33 kg to fruits and 2 kg to rachis
[7].
The banana peel has been used as bioadsorbent
of soluble contaminants, such as dyes [4], metal,
and phenolic compounds. Different processes for
color removal typically include physical, chemical
and biological schemes. Some processes, such as
electrochemical techniques and ion pair extraction,
are relatively new for textile waste treatment, while
others have been used in the industry for a long
time. Adsorption has been found to be superior to
other techniques for water re-use in terms of initial
cost, simplicity of design, use of operation and
insensitivity to toxic substances [8].
The aim of this work was to study the adsorption
of BB159 from aqueous solution onto banana peel
as a low cost adsorbent. Basic Blue159 (BB 159)
was chosen as a model dye. The banana peel was
characterized by FESEM, EDXA and FTIR. The
effect of pH solution, contact time, initial dye
concentration, the mass of adsorbent and mixing
speed on adsorption of banana peel were studied.
The Pseudo-rst-order, Pseudo-second-order,
Elovich and Intraparticle diffusion were used to
study of adsorption kinetic of BB159 on banana
peel. Results indicate that banana peel could be
used as adsorbent to remove the cationic dyes
from contaminated watercourses.
Experimental
Materials
Basic Blue159 was purchased from BEZEMA
Company and used without further purication.
Table 1 illustrates some characteristics of BB159.
All other chemicals were provided from Merck
chemical company. All other chemicals were
provided from Merck chemical company.
M. Pishgar et al., J. Appl. Chem. Res., 7, 4, 51-62 (2013)
53
Instrumentation
A Unico 4802 UV-Visible spectrophotometer
was employed for absorbance measurements
using quartz cell of 1 cm path length. A pH meter
(Metrohm 691, Metrohm, and Riverview, FL,
USA) was chosen to measure the pH values of
sorption process.
Methods
Preparation and characterization of adsorbent
The banana peel was obtained from fruit purchased
at a local market. It was dried in sunlight for 7
days. The dried banana peel was ground and sieved
with planetary mill (Planetry Ballmill/ PM100).
Field emission scanning electron microscopy
(FESEM-S-4160) analysis was carried out to study
its surface texture.
Preparation of dye stock solution
The stock solution was prepared by dissolving
accurately weighted dye in distilled water to the
concentration of 1000 mgl
-1
Adsorption process
The adsorption experiments were carried out in
batch processes. In each experiment 100 mL of the
dye solution was mixed with 0.4 gr of banana peel
in a glass tub. After a predetermined time interval
the mixture was centrifuged and ltered and
quantity of dye not adsorbed, i.e. that remaining
in solution, was measured by spectrophotometer at
700 nm. The same experiment was repeated using
different parameters: initial dye concentration
(50–400 mgl
-1
) contact time (5-120 min), the mass
of adsorbent (0.2-0.8g), pH of solution (3-10) and
mixing speed (100-400 rpm).
Kinetic studies
0.4gram of adsorbent was used for adsorption of
BB159 at different times (5-120min, pH 9, mixing
speed 200 rpm and initial dye concentrations (50-
400 mgl
-1
) .The amount of equilibrium adsorption
q
e
(mgg
-1
) was calculated using the equation 1:
WVCCq
et
/)(
0
(1)
Table 1. Charactristics of Basic Blue 159.
Name and
color index(C.I) structure commercial name
Ȝ
max
(nm)
CAS Number
Basic Blue
159
Astrazon Blue FBL
700nm
105953
-
73
-
9
NNN
N
N
S
N
M. Pishgar et al., J. Appl. Chem. Res., 7, 4, 51-62 (2013)
54
Where q
t
is the quantity of dye adsorbed on the
adsorbent (mgg
-1
).at any time, C
0
and C
t
are
the initial and dye concentrations (mgl-1) after
adsorption time t, respectively. V is the volume of
the solution (L) and W is the mass of dry adsorbent
(g).
The percentage of removed dye in solution for
each treatment can be given by:
Removal
percentage
=
బ
ି
బ
×
100
(2)
Where C
0
and C
e
(mgl
-1
) are initial dye concentration
and dye concentration after sorption procedure.
The BB159 concentrations graph for standard
solution versus absorbance at 700 nm wave
length,at where the maximum absorbance was
reached, was prepared and used to determine the
concentration of an unknown solution. For each
adsorption process, the absorbance of dye solution
was monitored. Then, the BB159 concentrations
in the residual solution and the dye adsorbed by
banana peel were calculated using the standard
graph. Subsequently, the adsorption rate of BB159
on banana peel was plotted.
Results and discussion
Characterization of adsorbent
FTIR were used to analyze functional group
distributions in the banana peel. Figure 1 shows
the FTIR of banana peel particles. In Figure 1,
the peaks around 3444.64 cm
-1
, 2923.34 cm
-1
,
1733.88 cm
-1
and 1037.36 cm
-1
resulted from O-H
stretch, C-H stretch, C=O stretch and C-O stretch,
respectively. It can be found that banana peel
has hydroxyl and carbonyl groups. These groups
have negative charge where can be good sites for
adsorption of Basic Blue 159.
Figure 1. FTIR spectrum of banana peel.
3903.72
3870.06
3854.24
3838.93
3821.27
3802.49
3750.17
3711.73
3690.22
3674.93
3649.51
3412.03
2922.96
2853.64
1734.46
1617.27
1402.04
1242.02
1035.35
828.31
765.60
701.88
669.93
638.32
612.12
581.52
551.80
525.50
500100015002000250030003500
500100015002000250030003500
Wavenumber cm-1
88 90 92 94 96 98 100
88
90
92
94
96
98
100
Transmittance [%]
M. Pishgar et al., J. Appl. Chem. Res., 7, 4, 51-62 (2013)
55
Field emission scanning electron microscopy
(FESEM) has been a main tool for characterizing
the surface morphology and fundamental physical
properties of the adsorbent surface. It is useful
for establishing the particle shape, porosity and
appropriate size distribution of the adsorbent. The
FESEM of banana peel was recorded and is shown
in Figure 2.In the FESEM micrograph 2(a) the
bright spots show the rough and porous surface of
the adsorbent, which one of the factors increasing
adsorption capacity. The loaded FESEM images
show the adsorption of Basic Blue 159 on the
banana peel. In Figure 2(b) depicting the surfaces
of particle after adsorption, it is clearly seen that
the caves, pores and surfaces of adsorbent were
covered by dye.
(a) (b)
Figure 2. Field emission scanning electron microscope of (a) banana peel and (b) dye adsorbed banana
peel.
The energy dispersive X-ray spectrometry
(EDXS) analysis was employed to determine the
composition of banana peel. Energy dispersive
X-Ray spectrum (EDXS) of banana peel is
shown in Table 2. It shows peaks corresponding
to K (Potassium), C (Carbon), O (Oxygen), Mg
(Magnesium) and Cl (Chlorine), no trace amount
of other impurities could be seen in the detection
limit of the EDXS. The results show that oxygen
is the most elements in banana peel. It is indicated
that hydroxyl, carbonyl groups where have been
shown in FTIR are the most important groups in
banana peel
Table 2. The Energy dispersive X-Ray spectrum (EDXS) of banana peel.
Elements
Norm. C (wt. %)
Carbon
33.24
Oxygen
56.27
Magnesium
0.29
Silicon
0.69
Chlorine
1.83
Potassium
7.68
Total: 100 %
M. Pishgar et al., J. Appl. Chem. Res., 7, 4, 51-62 (2013)
56
Effect of the mass of adsorbent
The removal of BB159 by banana peel were
studied by changing the quantities of sorbents (0.2,
0.4, 0.6 and 0.8g) for the initial dye concentration
of 100 mgL
-1
at room temperature, pH 9 and
mixing speed 200 rpm for 60 min. The residual dye
concentration was measured by spectrophotometer
after centrifuged and ltration. In Figure 3 the
dye removal percentage by different masses of
adsorbent is shown. The results indicated that
increase in mass of adsorbent to 0.4 g leads to
increasing in BB159 removal percentage. The
results show that the more masses of adsorbent
have a different effect and leads to decrease of dye
adsorption. It seems that aggregation of adsorbent
occur when mass of adsorbent is high [9].
Figure 3. Effect of adsorbent dose on the adsorption of BB159 on banana peel.
90.5
91
91.5
92
92.5
93
93.5
0 0.2 0.4 0.6 0.8 1
Adsorbent dose (g)
% removal
Effect of pH
The pH of the dye solution is one of the most
important parameters which controlled the
adsorption process, particularly the adsorption
capacity. The pH of the solution changed due
to,(1) the surface charge of the adsorbent, (2) the
degree of ionization of the adsorptive molecule
and (3) extent of dissociation of functional groups
on the active sites of the adsorbent [10]. Figure
4 shows the effect of pH on removal percentage
of BB159 by banana peel. It was revealed that
the decolonization efciency increased with the
increase of pH and reached a maximum level at
the pH of 9.0.Carolyn Palma and et all [12] have
shown that if the pH of a solution is higher than
the value of pH pzc, the surface of the adsorbent
has a negative net charge since the acid groups
are de-protonated and could preferably interact
with cationic species. In solutions with a lower
pH than pH pzc, the net charge of solid surface is
M. Pishgar et al., J. Appl. Chem. Res., 7, 4, 51-62 (2013)
57
positive since the basic groups have the ability to
share electrons, i.e., they are proton acceptors, and
could do with those negatively charged, According
to these results, banana peel could be a low-cost
bioadsorbent to uptake Basic dyes from industrial
wastewater [11].
Figure 4. Effect of pH on the adsorption of BB159 by banana peel.
0
10
20
30
40
50
60
70
80
90
100
0 2 4 6 8 10 12
pH
% removal
Effect of mixing speed
The contact of dye molecules to adsorbent particles
is very important in adsorption process. The mixing
speed leads to increase in contact of dye molecules
to adsorbent particles. The effect of mixing speeds
on dye adsorption has shown in Figure 5. According
to Figure 5, increase of the mixing speed from 100
rpm to 200 rpm leads to increasing in dye removal
percentage. The experimental data shows that
higher mixing speed (300 and 400 rpm) causes to
decrease of the dye removal percentage. It seems
that increase in mixing speed leads to increase in
turbulence and decrease in contact of dye molecules
to adsorbent particles.
Figure5.
Effect of mixing speed on the adsorption of BB159 by banana peel.
90.5
91
91.5
92
92.5
93
93.5
94
94.5
95
95.5
0 100 200 300 400 500
% removal
rpm
Figure 5.
M. Pishgar et al., J. Appl. Chem. Res., 7, 4, 51-62 (2013)
58
Effect of contact time and initial dye concentration
Determining of equilibrium time is another
important parameter in adsorption which
represents the adsorption of BB159 on banana
peel. In Figure 6, the effect of contact time and
initial dye concentration on adsorption of BB159
by banana peel is shown. According to Figure 6,
the dye adsorption increases with increasing of
time to 60 minfor all initial dye concentrations.
Longer time has no inuence on dye adsorption.
This means that the dye adsorption reaches to
equilibrium for different concentrations. Also, the
results show that increasing of dye concentration
leads to increase in BB159 adsorbed on banana
peel. The maximum adsorption of BB159 on
banana peel reaches at 400 mgL-1Increasing of
initial dye concentration improved number of
collisions between dye molecules and banana peel
particles. Hence a higher initial concentration of
dye will enhance the adsorption process [12].
Figure 6. Effect of the contact time and initial dye concentration on BB159 adsorption by banana peel.
0
20
40
60
80
100
120
0 50 100 150
50 mg/l
100 mg/l
150 mg/l
200 mg/l
400 mg/l
t (min)
q
୲
(
mg
/
gr
)
Adsorption kinetics
Adsorption kinetics has been proposed to elucidate
the adsorption mechanism. The mechanism of
adsorption depends on the physical and chemical
characteristics of the adsorbent as well as on the
mass transport process. In order to investigate the
mechanism of BB159 adsorption on the banana
peel and examine the potential rate-controlling
step, i.e., mass transfer or chemical reaction. The
capability of Pseudo-rst-order, Pseudo-second-
order, Elovich kinetic and Intraparticle diffusion
models was examined in this study.
Pseudo rst order
This model assumed that the rate of solute uptake
with time was directly proportional to difference in
saturation concentration and the adsorbed amount
[13, 14]:
)(
1 te
t
qqk
dt
dq
(3)
Where k
1
is the rate constant of Pseudo rst order,
q
e
and q
t
are the amount of dye adsorbed(mg/g) at
contact time t (min), respectively. After Integrating
with the boundary conditions at t=0, q
t
=0 and at
M. Pishgar et al., J. Appl. Chem. Res., 7, 4, 51-62 (2013)
59
t=t, q
t
=q
t
and rearranging equation (4), the rate
law for a Pseudo-rst-order reaction became:
tkqqq
ete 1
ln)ln( (4)
The k1 and qe values calculated from the slope and
intercept of the plot of ln (q
e
-q
t
) against t (Figure
7). Thek
1
,q
e
and R
2
values are listed in Table 3.
Figure 7. Pseudo first order kinetics for BB159 adsorption on banana peel.
-3.5
-3
-2.5
-2
-1.5
-1
-0.5
0
0.5
1
0 20 40 60 80 100
50 mg/L
100 mg/L
150 mg/L
200 mg/L
400 mg/L
t(min)
ln
(
ݍ
െ
ݍ
௧
)
Pseudo second order
Ho [15] proposed a second order model for the
sorption of divalent metal ions onto peat particles
based on the adsorption capacity of the adsorbents
with the goal of differentiating the kinetics of
a second-order rate expression based on the
adsorbent concentration from models which are
based on the solute concentration and represent a
pseudo-second-order rate expression.
The linearized from of the Pseudo-second-order
model as given by Ho [15]:
2
2
)(
te
t
qqk
dt
dq
(5)
Where k
2
(mggmin
-1
) is the rate constant of
pseudo second order adsorption, q
e
is the amount
of dye adsorbed on the adsorbent at equilibrium
(mgg-1) and q
t
is the amount of dye adsorbed on
the adsorbent at any time,t (mgg
-1
) .Integrating
equation (6) and applying the initial conditions:
e
e
t
q
t
qk
q
t
2
2
1
(6)
and The initial adsorption rates h (mggmin-1) can
be calculated from the pseudo second order model
by the following equation:
2
2 ei
qkh (7)
Where hi is the initial dye adsorption rate.
k
2
(mggmin
-1
) can be calculated from the slope and
intercept of the plot of t/q
t
against t (Figure 8) .The
values of k
2
, hi, qe and R
2
are listed in Table 3.
Similar phenomenon has been observed in the
adsorption of methylene blue by hazelnut shells
and wood sawdust [16], activated carbon prepared
M. Pishgar et al., J. Appl. Chem. Res., 7, 4, 51-62 (2013)
60
from rattan sawdust [18] and bamboo based activated carbon.
Figure 8. Pseudo second order kinetics for BB159 adsorption on banana peel.
0
2
4
6
8
10
12
0 20 40 60 80 100 120 140
50 mgШL
100 mgШL
150 mgШL
200 mgШL
400 mgШL
t(min)
t
q
୲
ൗ
Elovich
The Elovich equation is given as follows [17]:
)exp(
t
t
q
dt
dq
ED
(8)
Where α is the initial sorption rate (mggmin
-1
) and
β is the desorption constant (gmg
-1
). To simplify
the Elovich equation, it is presumed that αβt >> 1
and by applying the boundary conditions q
t
= 0 at t
= 0, this equation becomes [17].
tq
t
ln)ln(
EDEE
(9)
Figure 9. Elovich kinetics for BB159 adsorption on banana peel.
0
20
40
60
80
100
120
0 1 2 3 4 5 6
50 mg/L
100 mg/L
150 mg/L
200 mg/L
400 mg/L
ln
t
ݍ
௧
Intra-particle diffusion
Any adsorption process consists of different steps,
the surface diffusion followed by Intra-particle
diffusion. In general, the adsorption was governed
by the liquid phase mass transport. The mass
transfer rate can be expressed as a function of the
square root of time (t). The intra-particle diffusion
model was expressed by [18]:
M. Pishgar et al., J. Appl. Chem. Res., 7, 4, 51-62 (2013)
61
Cktq
t
2
1
(10)
Where qt is the amount of dye adsorbed on banana
peelat time t, and k is the intra-particle diffusion
rate constant. The values of R
2
are listed in Table
3. The results show that experimental data did not
t well into the Intra particle diffusion equation.
The R
2
values calculated from the slope and
intercept of the plot of q
t
against √t (Figure 10).
igure 10. Intra particle kinetics for BB159 adsorption on banana peel.
0
20
40
60
80
100
120
0 2 4 6 8 10 12
50 mg/L
100 mg/L
150 mg/L
200 mg/L
400 mg/L
ξ
t
ݍ
୲
Table 3. The values of Pseudo first order, Pseudo second order, Elovich and Intra-particle diffusion models
for the adsorption of BB159 on banana peel.
50mg/l
100mg/l
150mg/l
200mg/l
400mg/l
Pseudo first order
K
1
0.0328
0.0257
0.0063
0.0275
0.0208
q
e cal
2.1591
0.852
0.6597
0.88
1.22
R
2
0.9865
0.8992
0.9902
0.8903
0.7393
Pseudo second
order
K
0.045
0.075
0.097
0.041
0.025
q
e cal
11.68
23.86
35.58
48.309
96.15
R
2
0.9998 0.9999 0.9999 0.9998 0.9999
ܐ
ܑ
6.139
42.69
122.79
65.68
231.12
Elovich
R
2
0.9915
0.9465
0.6963
0.9456
0.952
Intra-particle
Diffusion
R
2
0.943
0.849
0.8184
0.9828
0.8841
M. Pishgar et al., J. Appl. Chem. Res., 7, 4, 51-62 (2013)
62
Conclusion
In this research the removal of Basic blue 159
(BB159) from aqueous by banana peel was studied.
Banana peel was characterized by FESEM, FTIR
analysis and EDXS. The adsorption was highly
dependent on various operating parameters, like:
the mass of adsorbent, initial dye concentration,
contact time, pH and mixing speed (rpm).The
results show that the best removal percentage
observed at 60 min, 0.4 g adsorbent, 200 rpm
and pH9.The kinetic of BB159 adsorption onto
banana peel was examined using the pseudo-rst-
order, pseudo-second-order, Elovich and Intra-
particle diffusion models. The adsorption kinetic
followed the pseudo-second-order kinetic model.
The results indicate that banana peel could be used
as adsorbent to remove the cationic dyes from
contaminated watercourses.
References
[1] A.M. Talarposhti, T. Donelly, Water Research,
35 (2), 425 (2001).
[2] Z. Al-Qodah, Water Research, 34 (17), 4295
(2000).
[3] K.C. Chen, WT. Wu JY.Huang, JY.Houng, J.
Ind. Microbiol. Biotechnol., 23, 686 (1990).
[4]V. K. Gupta, J. Environ. Manag., 90, 8, 2313
(2009).
[5] J. P. Essien, E. J. Akpan , E. P. Essien,
Bioresour., 96, 1451 (2005).
[6] FAO (Food and Agriculture Organization of
the United Nations): Faostat Statistics Database
(last updated December 2009), Agriculture, Rome,
Italy (2008).
[7] M. Bao, S. Delgado, M. Garcı´a, M. Torres,
Rev, Agroquim, Tecnol. Aliment., 27, 24 (1987).
[8] V. Meshko, L. Markovska, M. Minchev, A. E.
Rodrigues, Water Research, 35 (14), 3357 (2001).
[9] H.B. Senturk, D. Ozdes, C. Duran,
Desalination, 252, 81 (2010).
[10] B. K. Nandi, A. Goswami, M. K. Purkait,
Applied Clay Science, 42, 583 (2009).
[11] C. Palma, E. Contreras, J. Urra, Waste Biomass
Valor, 2, 77 (2011).
[12] B. H. Hameed, D. K. Mahmoud, A. L. Ahmad,
J. Hazard. Mater., 158, 65 (2008).
[13] S. Lagergren, Handlinger., 24, 1 (1998).
[14] Y. Zhou, Q. Jin, T. Zhu, Q. Zhang, T. Ma,
Cellulose Chemistry and Technology, 46 (5-6),
319 (2012).
[15] Y. S. Ho, Thesis, Univ. Birmingham,
Birmingham, U. K. (1995).
[16] F. Ferrero, J. Hazard. Mater., 142, 144 (2007).
[17] K. Farizadeh, M. E. Yazdanshenas, M.
Montazer, A. Rashidi, R. M. A. Malek, J. Textile
Research, 33, 443 (2009).
[18] J. W. J. Weber, J. C. Morriss, J. Sanit, Eng.
Div. Am. Soc. Civil Eng., 89, 31 (1963).