morphology change of self-assembled zno 3d nanostructures with different ph
Bạn đang xem bản rút gọn của tài liệu. Xem và tải ngay bản đầy đủ của tài liệu tại đây (963.51 KB, 6 trang )
Materials Chemistry and Physics 113 (2009) 389–394
Contents lists available at ScienceDirect
Materials Chemistry and Physics
journal homepage: www.elsevier.com/locate/matchemphys
Morphology change of self-assembled ZnO 3D nanostructures with different pH
in the simple hydrothermal process
Jae-Min Jang
a
, Sung-Dai Kim
b
, Hee-Man Choi
a
, Jin-Yeol Kim
a
, Woo-Gwang Jung
a,∗
a
School of Advanced Materials Engineering, Kookmin University, 861-1 Jeongneung-dong Seongbuk-gu, Seoul 136-702, Republic of Korea
b
Department of Quality Non-Destructive Testing, Seoul Sanggye Vocational School, 771-2 Sanggye-dong, Nowon-gu, Seoul 139-831, Republic of Korea
article info
Article history:
Received 28 January 2008
Received in revised form 21 July 2008
Accepted 25 July 2008
PACS:
62.23.−c
Keywords:
Zinc oxide
Morphology
Self-assembly
Hydrothermal process
pH
Nanostructure
abstract
Self-assembled ZnO 3D nanostructures were fabricated on a Si substrate using a simple hydrothermal
process with ammonia and zinc acetate dihydrate solutions at 95
◦
C. The changes in morphology and
characteristics of the ZnO nanostructures were investigated over a range of pH (9.0–11.8). The texture
of the ZnO crystal was evaluated using the texture coefficient (TC) for the specific reflecting plane. The
results showed that pH is the main factor affecting the morphology of the ZnO nanostructure. The ZnO
nanostructures fabricated were single-crystalline with good crystal quality. The PL spectra showed that
the ZnO nanostructures fabricated at pH >10.0 had good optical properties with low defect content. This
demonstrates that themorphology of ZnO nanostructures fabricated using a simple hydrothermal process
can be controlled by the pH of the solution.
© 2008 Elsevier B.V. All rights reserved.
1. Introduction
A wide variety of nanostructures of compound semiconductors
such as nanowires, nanotubes and nanorods have been reported
for oxides [1], nitrides [2], sulphides [3] and arsenides [4]. Among
them, zinc oxide (ZnO) isa very importantII–VI semiconductor with
a direct band-gap of 3.37 eV and a large exciton binding energy of
60 meV [5]. In addition, it has many interesting properties includ-
ing near-ultra violet (UV) emission, transparent conductivity, and
piezoelectricity. ZnO nano-materials are expected to b e applied
widely in the manufacture of electrical devices, including transpar-
ent conducting electrodes in solar cells, flat panel displays, surface
acoustic devices, UV lasers and chemical and biological sensors
[6–10].
Many deposition methods have been used to fabricate ZnO
nanostructures [11–15]. In most methods, complicated facilities
are required to fabricate a variety of nanostructures. A simple
technique not involving complicated equipment with intricate
reactions might be a solution for the easy and economic platform
in ZnO nanostructure processing. Some progress has been made
in this field with a variety of ZnO nanostructures being reported
∗
Corresponding author. Tel.: +82 2 910 4643; fax: +82 2 910 4320.
E-mail address: (W G. Jung).
[16–19]. However, in these reports, the synthesis was performed at
temperatures over 100
◦
C or using an autoclave or other activator.
In this study, a simple hydrothermal synthesis was developed
to produce self-assembled ZnO three-dimensional (3D) nanostruc-
tures, and the morphology of the ZnO 3D nanostructures fabricated
at different pH in the synthesis solution was examined carefully.
This method includes only the reactions in aqueous solution at
temperatures below 100
◦
C. Single crystalline ZnO nanostructures
were fabricated without any supplementary equipment, such as an
autoclave. This method has many advantages over other chemical
growth methods, i.e. low cost, easy processing in large area and low
temperature processing.
2. Experimental
A solution of 0.17 mol zinc acetate dihydrate (Zn(CH
3
COOH)
2
·2H
2
O) in 1000 ml
deionised water was stirred at room-temperature for 20 min. The solution was then
adjusted to the desired pH by adding an aqueous solution of NH
4
OH droplets into
a well-stirred aqueous zinc acetate solution. The pH of the mixed aqueous solution
was controlled in the range from 9.0 to 11.8. The final solution was heated to 95
◦
Con
a hot-plate. During heating, the solution was stirred continuously. When the aque-
ous solution reached 95
◦
C, a (1 0 0) Si substrate was dipped into the final solution
for 120 min. This growth time was used to ensure sufficient thickness of the ZnO
nanostructures through the preliminary experiments. After keeping the substrate
in aqueous solution for the desired time, the sample was washed several times in
deionised water and dried with blowing nitrogen (N
2
) gas.
The ZnO nanostructures obtained were characterized by field emission scan-
ning electron microscopy (FE-SEM, JEOL, JSM-7401F). The structural properties
0254-0584/$ – see front matter © 2008 Elsevier B.V. All rights reserved.
doi:10.1016/j.matchemphys.2008.07.108
390 J M. Jang et al. / Materials Chemistry and Physics 113 (2009) 389–394
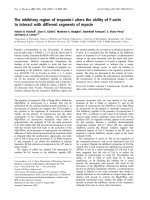
Fig. 1. X-ray diffraction patterns of the ZnO 3D nanostructures synthesized at dif-
ferent pH: (a) pH 9.0; (b) pH 9.5, 10.0; (c) pH 10.5, 11.0; (d) pH 11.5.
were examined by X-ray diffraction (XRD, Bruker, D8) with Cu K␣ radiation
( = 1.540598 Å) and high resolution transmission electron microscopy (HR-TEM,
JEOL, JEM-2100F). The optical properties were studied using a photolumines-
cence mapper (PL, Accent, RPM2000) with a Nd-YAG laser at a wavelength of
266 nm.
3. Result and discussion
The ZnO 3D nanostructures with various morphologies were
synthesized at pH 9.0–11.8 and 95
◦
C in a hydrothermal process.
Fig. 1 shows the XRD patterns of the ZnO nanostructures synthe-
sized in solutions at different pH. The patterns from the ZnO 3D
nanostructures shown in Fig. 1 are in accordance with the typi-
cal wurtzite hexagonal structure in the reference data (JCPDS No.
36–1451). The full width at half maximum (FWHM) of the main
peaks showed that thesynthesized ZnOnanostructureswerehighly
crystalline, even though they had been prepared at temperatures
below 100
◦
C. A small peak at 2Â =53
◦
corresponding to the Si sub-
strate was also observed. No other peaks related to impurities were
detected in the pattern within the detection limit of XRD. The
intensity from samples at pH 10.5, 11.0 and 11.5 was much higher
than that from samples at pH 9.0, 9.5 and 10.0. Because the same
growth time had been used for each preparation, it is estimated
that the growth rate of ZnO nanostructure in the pH 9.0, 9.5 and
10.0 solutions was much lower than that in the pH 10.5, 11.0 and
11.5 solutions. This suggests a higher intensity in the XRD patterns
of the ZnO nanostructures at pH 10.5, 11.0 and 11.5 than at pH 9.0,
9.5 and 10.0.
The preferential orientation of the ZnO crystallites at different
pH of solution was compared by calculating the relative texture
coefficient (TC) using the following equation [20]:
TC(hkl) =
I(hkl)/I
0
(hkl)
1/N˙
N
I(hkl)/I
0
(hkl)
(1)
where N is the number of diffraction peaks, I(hkl) and I
0
(hkl)are
the integrated intensities corresponding to the (hkl) reflection of
the sample containing the textured and randomly oriented crys-
tallites, respectively. A sample with randomly oriented crystallites
presents a TC (hkl) of 1, while a larger value indicates an abundance
of crystallites oriented to the (hkl) plane. Table 1 shows the calcu-
lated texture coefficients for wurtzite ZnO samples synthesized in
this work. It is obvious that the (0 0 4) and (1 1 0) peaks have high
texture coefficients when the pH of the solution was <10.0. The TCs
for the (0 0 4) peak were 3.67 and 3.54, respectively, which are the
highest values among the peaks observed in each sample. On the
other hand, the TC for the (1 0 0), (0 0 2), (1 01) and (1 0 3) peaks
were larger then 1 when the pH was >10.0. When the pH was 11.5,
the (10 0) peak showed the highest TCof all diffraction peaks. It was
also observed that the TC of the (1 00) and (1 0 1) peaks increased
with increasing pH.Forthe (00 2)plane, the TCvalueincreased with
increasing pH in the lower pH range, showing a maximum value
at pH 10.5–11.0, and decreased at pH 11.5. As shown in Fig. 2, the
morphology of the ZnO nanostructures synthesized from the pH
>10.0 solutions shows a hexagonal shape nanorod-bundle. From
these observations, it was estimated that the morphology of the
ZnO nanostructures were determined by competition between the
values of TC (1 00), TC (10 1) and TC (00 2).
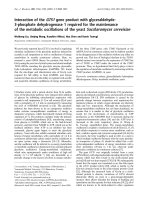
Fig. 2 shows the FE-SEM images of the self-assembled ZnO 3D
nanostructures, which were synthesized in an aqueous solution
at various pH. The shape of the ZnO 3D nanostructures showed
different morphologies for each sample depending on the solu-
tion pH. As shown in Fig. 2(a–c), a budding flower shape ZnO was
obtained from the solution at pH 9.0 and 9.5, and a blossom shape
was recognized for processing at pH 10.0. Table 2 summarizes the
morphology of the ZnO 3D nanostructures fabricated at different
pH using a hydrothermal process. It was recognized from the FE-
SEM images that the ZnO nanostructures formed at low pH were
smaller and shorter. At pH 10.5, the high magnification image in
Fig. 2(d) shows flower-shape d structures consisting of hundreds
of sharp-tipped hexagonal ZnO nanorods. The diameter of these
individual nanorods ranged from 200 to 300 nm with a length of
3–4 m. All the nanorods appeared to have originated from a single
center arranging then in a spherical shape exhibiting a flower-like
Table 1
The texture coefficients of the different planes for the ZnO nanostructures synthesized at various pH
ASTM pH
(hkl) I
0
9.0 9.5–10.0 10.5–11.0 11.5
I TC I TC I TC I TC
100 57 76 0.75 86 0.76 3151 1.40 2619 1.62
a
002 44 54 0.69 79 0.91 2705 1.56
a
1857 1.49
101 100 103 0.58 116 0.59 4613 1.17 3631 1.28
102 23 24 0.59 25 0.55 844 0.93 601 0.92
110 32 59 1.04 68 1.07 1038 0.82 707 0.78
103 29 24 0.47 26 0.45 849 1.13 600 1.11
200 4 – – – – 166 1.05 101 0.89
112 23 20 0.49 23 0.51 627 0.69 455 0.70
201 11 14 0.72 14 0.64 306 0.70 239 0.77
004 2 13 3.67
a
14 3.54
a
64 0.81 47 0.83
202 4 – – – – 117 0.74 71 0.63
a
Indicates the highest texture coefficient at each growth condition.
J M. Jang et al. / Materials Chemistry and Physics 113 (2009) 389–394 391
Fig. 2. FE-SEM images of the ZnO 3D nanostructures synthesized at different pH: (a) pH 9.0; (b) pH 9.5; (c) pH 10.0; (d) pH 10.5; (e) pH 11.0; (f) pH 11.5; (g) pH 11.8; (h) high
magnification image of pH 11.8.
morphology. A similar morphology was observed in the samples
processed at pH 11.0. However, each ZnO nanorod at pH 11.0 had a
larger diameter and length than at pH 10.5. In Fig. 2(e), the diam-
eter and length of the ZnO nanorod synthesized at pH 11.0 was
300–400 nm and 6–7 m, respectively. A similar flower-like mor-
phology was reported by Zhang et al. in which growth occurred at
higher temperatures [21]. Fig. 2(f) shows the two types of ZnO 3D
nanostructures obtained while processing at pH 11.5. One type has
a similar morphology to that observed at pH 11.0, and the other
is a bundle of hexagonal ZnO nanorods that coalesced with each
other, as shown in the inset in Fig. 2(f). The spherical morphology
shown in Fig. 2(g) was obtained at pH 11.8. The image of the ZnO 3D
nanostructure shows the sphere to consist of many bundles of ZnO
nanorods which are similar to the bundles in the samples obtained
at pH 11.0. The magnified image in Fig. 2(g) shows the hexagonal
shape in the cross section of the coalesced ZnO nanorods.
392 J M. Jang et al. / Materials Chemistry and Physics 113 (2009) 389–394
Table 2
Summary of shape of the ZnO 3D nanostructures fabricated in solutions at different pH using a hydrothermal process
As shown in Fig. 2, the shape and morphology of the ZnO nanos-
tructures depends on the solution pH. This behavior may indicate
the mechanism for the formation of this different morphology. In
the lower pH solution, the leaf-like ZnO changed to a needle-like
shape with increasing pH, e.g. very slender ZnO nanorods were syn-
thesized in pH 10.5. The diameter of the ZnO nanorods increased
with increasing pH. This was attributed to the growth rates of spe-
cific planes of the ZnO nanorods. At pH 10.5 and 11.0, the growth
rate for the (0 0 2) plane was large, and the growth rates of the
(1 00) and (1 1 0) planes increased at higher pH, resulting in a
hexagonal-shaped ZnO nanorod. This was previously mentioned
and confirmed in the discussion of the texture coefficient in Table 1.
The results showed that the crystallization and morphology of
ZnO nanostructures depend on the initial pH of solution. Fig. 3
shows the mechanism of ZnO formation in solution at different pH.
It can be seen that ZnO formation is originated from the dehydra-
tion of Zn(NH
3
)
4
2+
. However, at pH <10.0, zinc cations (Zn(NH
3
)
4
2+
)
transform easily to the zinc hydroxide (Zn(OH)
2
) precursor. There-
fore, ZnO nanostructures nucleate in a heterogeneous system. On
the other hand, when the pH is >10.0 through the addition of more
ammonia, all the zinc hydroxide dissolves resulting in the forma-
tion of a clear solution. This behavior was demonstrated by the
observation that the aqueous solution became frosty with the for-
mation of white precipitates when a small amount ammonia water
wasadded. Thesolution thenturned clear after the additionof more
ammonia. Therefore, the addition of more ammonia to the aqueous
solution to adjust the pH to 11.5 and 11.8, reduced the growth rate
of ZnO nanostructures by the large amount of Zn(OH)
4
2−
because
the solubility of NH
3
in this solution was lower [21]. This resulted
in denser nanorods with a flat hexagonal shape under these growth
conditions.
Fig. 4 shows low and high magnification TEM images of a ZnO
nanorod synthesized at pH 10.5 with the selected area electron
diffraction (SAED) pattern. The SAED pattern in Fig. 4(a) shows the
many single crystals of ZnO, and the inset i n Fig. 4(b) indicates them
to b e single crystals.The HR-TEM image inFig. 4(c) shows the appar-
ently well-resolved lattice fringes of the ZnO nanorod crystals. The
interplanar spacing was measured to be 0.52nm, which is equal to
the lattice constant in the reference (JCPDS No. 36–1451) for ZnO.
The SAED patternin Fig. 4(d) shows visible bright spots correspond-
ing to all the crystal planes of the ZnO phase. This indicates that the
ZnO nanorod is a single crystal growing preferentially along the
c-axis [0001].
Fig. 5 shows the room-temperature photoluminescence spec-
tra. The spectra show a strong UV peak at approximately 374 nm
(3.33 eV) and a broad yellow emission ranging from 500 to 700 nm.
The PL data were not collected at 526 nm because of the secondary
peak of the Nd-YAG laser. A relatively very weak PL intensity was
observed for the samples grown in the solutions at pH 9.0 and 9.5. A
similar tendency was observed in the intensity of XRD patterns, as
illustrated in Fig. 1. The highest intensity was observed in the ZnO
flower-like sample at pH 10.5, in which the morphology was most
sharp. The PL spectra show no shift in the PL peak in these ZnO 3D
nanostructures due to a quantum confinement effect, probably due
to the large diameter and size of the nanostructures. The position
of UV emission in Fig. 5 is in accordance with that in the PL spec-
tra for the samples fabricated by other investigators using a similar
method [17,18,21]. A weak and broad yellow emission near 600 nm
(2.07 eV) was observed in the PL spectrum. In particular, a relatively
high intensity of yellow emission was observed in the samples
grown atpH 9.0 and9.5. Thisyellow emission was attributed mainly
to the recombination of electrons in the oxygen vacancies (Vo
+
)
with the photo-excited holes in the valance band [22]. This is strong
evidence indicating an in increased concentration of oxygen vacan-
cies. The sharp excitonic emission and weak deep-level emission
peak suggest that the ZnO flower-like nanostructures fabricated in
the solutions at pH >10.0 have a lower defect concentration and
high optical quality. Overall, the best optical property and crystal
Fig. 3. Schematic diagram of the growth of ZnO nanostructures through a hydrothermal process at different pH.
J M. Jang et al. / Materials Chemistry and Physics 113 (2009) 389–394 393
Fig. 4. HR-TEM images of the ZnO 3D nanostructure synthesized at pH 10.5: (a) an electron beam perpendicular to the wide surface; (b) a low magnification image ofan
individual ZnO nanorod; (c) high magnification image; (d) SAED pattern of an individual nanorod.
Fig. 5. Room-temperature photoluminescence spectra from the ZnO 3D nanostruc-
tures grown in solutions of different pH (
ex
= 266 nm).
quality of self-assembled ZnO 3D nanostructure were obtained at
pH 10.5.
4. Summary
Self-assembled Zinc oxide (ZnO) 3D nanostructures were fabri-
cated on a (1 0 0) Si substrate at 95
◦
C using a simple hydrothermal
process in ammonia and zinc acetate dihydrate solutions. The
changes in morphology and the characteristics of the ZnO nanos-
tructures were investigated at pHs ranging from 9.0 to 11.8.
The texture was evaluated by the texture coefficient of the spe-
cific planes in the ZnO nanostructures. The change in shape was
attributed to the growth rates of the specific planes in the ZnO
nanostructure. It was found that the solution pH is the main factor
affecting the morphology of the ZnO nanostructure. XRD and SAED
showed that the ZnO nanostructures were single-crystalline with
good crystallinity. The PL spectra showed that the ZnO nanostruc-
tures fabricated at pH >10.0 have good optical properties with a low
defect concentration. Overall, the best optical property and crystal
quality of self-assembled ZnO 3D nanostructure were obtained at
pH 10.5.
Acknowledgments
This study was supported by the ERC (Center for Materials
and Processes of Self-Assembly) program of MOST/KOSEF (R11-
2005-048-00000-0) and the Research Program 2008 of Kookmin
University in Korea.
Appendix A. Supplementary data
Supplementary data associated with this article can be found,
in the online version, at doi:10.1016/j.matchemphys.2008.07.108.
394 J M. Jang et al. / Materials Chemistry and Physics 113 (2009) 389–394
References
[1] M.H. Huang, S. Mao, H. Feick, H.Q. Yan, Y.Y. Wu, H. Kind, E. Weber, R. Russo, P.D.
Yang, Science 292 (2001) 1897.
[2] W G. Jung, S H. Jung, P. Kung, M. Razeghi, Nanotechnology 7 (20 06) 54.
[3] J.H. Zhan, X.G. Yang, D.W. Wang, S.D. Li, Y. Xie, Y. Xia, Y. Qian, Adv. Mater. 12
(2000) 1348.
[4] J. Noborisaka, J. Motohisa, T. Fukui, Appl. Phys. Lett. 86 (2005) 213102.
[5] C. Klingshirn, Phys. Status Solidi B 71 (1975) 547.
[6] P. Zu, Z.K. Tang, G.K. Wong, M. Kawasaki, A. Ohtomo, H. Koinuma, Y. Segawa,
Solid State Commun. 103 (1997) 459.
[7] D.M. Bangall, Y.G. Chen, Z. Zhu, T. Yao, Appl. Phys. Lett. 70 (1997) 2230.
[8] Y.C. Kong, D.P. Yu, B. Zhang, W. Fang, S.Q. Feng, Appl. Phys. Lett. 78 (2001) 407.
[9] Y. Li, G.W. Meng, L.D. Zhang, F. Philip, Appl. Phys. Lett. 76 (2000) 2011.
[10] K. Omichi, K. Kaiya, N. Takahashi, T. Nakamura, S. Okamoto, H. Yamamoto, J.
Mater. Chem. 11 (2001) 262.
[11] J Y. Park, Y S. Yun, Y S. Hong, Appl. Phys. Lett. 87 (2005) 123108.
[12] H M. Cheng, H C. Hsu, Y K. Tseng, L J. Lin, W F. Hsieh, J. Phys. Chem. B 109
(2005) 8749.
[13] X.H. Zhang, Y.C. Liu, X.H. Wang, S.J. Chen, G.R. Wang, J.Y. Zhang, Y.M. Lu, D.Z.
Shen, X.W. Fan, J. Phys.: Condens. Matter 17 (2005) 3035.
[14] D. Banerjee, J.Y. Lao, D.Z. Wang, J.Y. Huang, Z.F. Rena, Appl. Phys. Lett. 83 (2005)
2061.
[15] T. Minemoto, T. Negami, S. Nishiwaki, H. Takakura, Y. Hamakawa, Thin Solid
Films 372 (2000) 173.
[16] U. Pal, P. Santiago, J. Phys. Chem. B 109 (2005) 15317.
[17] X. Xia, Z. Ye, G. Yuan, L. Zhu, B. Zhao, Appl. Surf. Sci. 253 (2006) 909.
[18] Z. Fang, K. Tang, G. Shen, D. Chen, R. Kong, S. Lei, Mater. Lett. 60 (2006) 2530.
[19] Z.Z. Ye, F. Yang, Y.F. Lu, M.J. Zhi, H.P. Tang, L.P. Zhu, Solid State Commun. 142
(2007) 425.
[20] C.S. Barrett, T.B. Massalski, Structure of Metals, Pergamon Press, Oxford, Eng-
land, 1980 (Chapter 9).
[21] J. Zhang, L. Sun, J. Yim, H. Su, S. Liao, C. Yan, Chem. Mater. 14 (2002) 4172.
[22] Z.L. Wang, J. Phys. Condens. Matter 16 (2004) R829.