PHASE LOCKED LOOP AND FM DEMODULATION
Bạn đang xem bản rút gọn của tài liệu. Xem và tải ngay bản đầy đủ của tài liệu tại đây (175.8 KB, 12 trang )
1
P
RINCE OF
S
ONGKLA
U
NIVERSITY
D
EPARTMENT OF
E
LECTRICAL
E
NGINEERING
210-302 Third-Year Electronics Laboratory: E1
P
HASE
-L
OCKED
L
OOP AND
FM
D
EMODULATION
In this lab you will investigate phase lock loop (PLL) operation and its application for
FM demodulation using the CMOS 4046 integrated circuit. The IC contains two
different phase detectors and a VCO. It also includes a zener diode reference for
power supply regulation and a buffer for the demodulator output. The user must
supply a loop filter in a close-loop to operate the PLL. The high input impedances and
low output impedances of the 4046 make it easy to select external components.
Notes
1. This lab is fairly complicated. Be sure that you understand how the circuits are
supposed to work before coming into the lab. Do not try to build something
that you have not fully understood and analyzed. Read this entire document
before beginning to work on it.
2. Students are strongly recommended to read supplementary handouts (see
references) to comprehend a theoretical background of PLL operation as well
as internal circuit building blocks within the 4046 IC.
3.
Handle the 4046 with care. CMOS integrated circuits are easily destroyed.
Avoid
static discharges. Use a 10k- resistor to couple the signal generator to the PLL.
Avoid shorting the outputs to ground or the supply. A TTL gate can withstand
this kind of abuse, but CMOS cannot (be careful of loose wires). CMOS does
not have the output strength to drive capacitive loads. VSS should be
connected to ground, VDD should be connected to 5V, and pin 5 should be
connected to ground (otherwise the VCO is inhibited).
4. Answer all questions (marked by underlines) with scientific/engineering
analysis and discussion when writing up the lab report.
2
1. Phase-Locked Loop Concepts
Phase-locked loop is a feedback loop where a voltage-controlled oscillator (VCO) can
be automatically synchronized (“locked”) to a periodic input signal. The locking
property of the PLL has numerous applications in communication systems (such as
frequency, amplitude, or phase modulation/demodulation- analog or digital), tone
decoding, clock and data recovery, self-tunable filters, frequency synthesis, motor
speed control, etc.
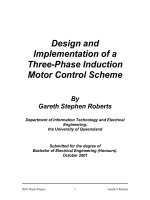
The basic PLL has three components connected in a feedback loop, as shown in the
block diagram of Figure 1: a voltage-controlled oscillator (VCO), a phase detector
(PD) or phase comparator, and a low-pass loop filter (LPF).
Figure 1: Block diagram of a basic phase-locked loop (PLL)
The VCO is an oscillator whose frequency
f
osc
is proportional to input voltage
v
o
(=
V
vcoin
). The voltage at the input of the VCO determines the frequency
f
osc
of the
periodic signal
v
osc
at the output of the VCO. The output of the VCO,
v
osc
, and a
periodic incoming signal
v
i
are inputs to the phase detector. When the loop is locked
on the incoming signal
v
i
, the frequency
f
osc
of the VCO output
v
osc
is exactly equal
to the frequency
f
i
of the periodic signal
v
i
,
f
osc
=
f
i
( 1)
It is also said that the PLL is in the locked condition. The phase detector produces a
signal proportional to the phase difference between the incoming signal and the VCO
output signal. The output of the phase detector is filtered by a low-pass loop filter.
The loop is closed by connecting the filter output to the input of the VCO. Therefore,
the filter output voltage
v
o
controls the frequency of the VCO.
A basic property of the PLL is that it attempts to maintain the frequency lock (
f
osc
=
f
i
) between
v
osc
and
v
i
even if the frequency
f
i
of the incoming signal varies in time.
Suppose that the PLL is in a locked condition, and the frequency
f
i
of the incoming
signal increases slightly. The phase difference between the VCO signal and the
incoming signal will begin to increase in time.
3
As a result, the filter output voltage
v
o
increases, and the VCO output frequency
f
osc
increases until it matches
f
i
, thus keeping the PLL in a locked condition. The
range of frequencies from
f
i
=
f
min
to
f
i
=
f
max
where the locked PLL remains in the
locked condition is called the lock range of the PLL. If the PLL is initially locked,
and
f
i
becomes smaller than
f
min
, or if
f
i
exceeds
f
max
, the PLL fails to keep
f
osc
equal
to
f
i
, and the PLL becomes unlocked,
f
osc
≠
f
i
. When the PLL is unlocked, the VCO
oscillates at the frequency
f
o
called the centre frequency, or the free-running
frequency of the VCO. The lock can be established again if the incoming signal
frequency
f
i
gets close enough to
f
o
. The range of frequencies
f
i
=
f
o
–
f
c
to
f
i
=
f
o
+
f
c
such that the initially unlocked PLL becomes locked is called the capture range of the
PLL. Make sure you understand and can distinguish the definitions of lock range and
capture range! – it will become more obvious when you manage to run the PLL
successfully.
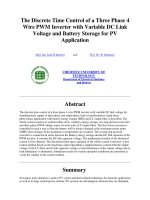
The lock range is wider than the capture range. So, if the VCO output frequency
f
osc
is plotted against the incoming frequency
f
i
, we obtain the PLL steady-state
characteristic shown in Figure 2. The characteristic simply shows that
f
osc
=
f
i
in the
locked condition, and that
f
osc
=
f
o
=
constant
when the PLL is out-of-locked
(unlocked). A hysteresis can be observed in the
f
osc
(
f
i
) characteristic because the
capture range is smaller than the lock range.
Figure 2: Steady-state f
osc
(f
i
) characteristic of the basic PLL.
From this point, students need to carefully study a brief theory of the PLL in the
supplementary handout [1, 2]. Make sure you understand the PLL concept and
locking mechanism. Furthermore, it is essential to clearly understand a mathematical
sense of the PLL in a locked condition (section 10.4.2) using s-domain analysis and
try to relate the whole concept to the feedback control theory. As mentioned above,
when the PLL is in a locked condition the input frequency
f
i
will be equal to the
frequency of the signal from the VCO,
f
osc
–
so why is it called Phase-Locked Loop
instead of Frequency-Locked Loop? What is the real meaning of Phase? Should we
4
employ frequency comparator instead of phase comparator since we want to track the
input frequency?
While the PLL of Figure 1 is in a locked condition, it can effectively be modelled
by the block diagram as depicted in Figure 3. The loop low-pass filter is represented
by a transfer function F(s) where the integration 1/s block is needed to convert an
angular frequency from the VCO
ω
osc
into the corresponding phase
Φ
osc
. Identify the
building block that represents the phase detector? Instead of using phase detector, can
we replace it with a frequency comparator? Note that K
O
is the VCO proportional
constant and K
D
is the phase comparator’s “gain”.
Σ
Low-pass filter
F(s)
Voltage-Controlled
Oscillator
K
O
rad/s
V
1/s
K
D
V/rad
Φ
i
Φ
osc
ω
osc
Φ
ε
V
O
Figure 3: Block diagram (in s-domain) of the PLL in Figure 1.
Transfer functions between V
O
/
Φ
i
or V
O
/
ω
i
(
ω
i
being an input frequency in rad/s and it
is related to phase by
dt
d
i
i
Φ
=
ω
or in s-domain
ω
i
= s
Φ
i
) can be derived from Figure
3 to be
)(
)(
)(
sFKKs
sFsK
s
V
OD
D
i
O
+
=
Φ
(2)
)(
)(
)(
sFKKs
sFK
s
V
OD
D
i
O
+
=
ω
(3)
In this experiment Eq.(3) will be used extensively in the design for different cases of
filter transfer function F(s).
2. The 4046 Integrated Circuit Phase-Locked Loop
A block diagram of the 4046 PLL is shown in Figure 4. The large rectangle indicates
the 4046 boundary and the rests are external circuit components that may be
connected to the IC to render specific functions. Read carefully through the data sheet
before starting to build any circuit. Try to understand functionalities of each pin. It
will help you carry out the experiment smoothly.
The CD4046BC
1
micropower phase-locked loop (PLL) consists of a low power,
linear, voltage-controlled oscillator (VCO), a source follower, a zener diode, and two
1
HEF4046 can also be used
5
phase comparators. The two phase comparators have a common signal input and a
common comparator input. The signal input can be directly coupled for a large
voltage signal, or capacitively coupled to the self-biasing amplifier at the signal input
for a small voltage signal. Phase comparator I, an exclusive OR gate, provides a
digital error signal (phase comp. I Out) and maintains 90° phase shifts at the VCO
center frequency. Between signal input and comparator input (both at 50% duty
cycle), it may lock onto the signal input frequencies that are close to harmonics of the
VCO center frequency. Phase comparator II is an edge-controlled digital memory
network. It provides a digital error signal (phase comp. II Out) and lock-in signal
(phase pulses) to indicate a locked condition and maintains a 0° phase shift between
signal input and comparator input. The linear voltage-controlled oscillator (VCO)
produces an output signal (VCO Out) whose frequency is determined by the voltage at
the VCO IN input, and the capacitor and resistors connected to pin C1A, C1B, R1 and
R2. The source follower output of the VCOIN (demodulator Out) is used with an
external resistor of 10 kΩ or more.
The INHIBIT input, when high, disables the VCO and source follower to minimize
standby power consumption. The zener diode is provided for power supply regulation,
if necessary.
Figure 4: Block diagram showing an internal structure of 4046 PLL.
A single positive supply voltage is needed for the chip. The positive supply voltage
VDD is connected to pin 16 and the ground is connected to pin 8. In this experiment
we will employ VDD = +5V. The incoming signal
v
i
goes to the input of an internal
6
amplifier at the pin 14 of the chip. The internal amplifier has the input biased at about
VDD/2; therefore, the incoming signal should be capacitively coupled to the input.
The incoming ac signal
v
i
of about one volt peak-to-peak is sufficient for proper
operation. The ac coupling capacitor C
i
together with the input resistance R
i
≈ 100kΩ
at the pin 14 form a high-pass filter. C
i
should be selected so that
v
i
is in the pass-band
of the filter, i.e., so that the input frequency f
i
> 1/(2πR
i
C
i
) for the lowest expected
frequency f
i
of the incoming signal. The output of the internal amplifier is internally
connected to one of the two inputs of the two phase detectors inside the chip.
3. Voltage-Controlled Oscillator
The voltage-controlled oscillator (VCO) on the 4046 produces a square wave on pin 4
whose frequency varies with the input voltage (pin 9). The VCO characteristics are
user-adjustable by three external components: R1, R2 and C1.
• Basing upon the graphs in 4046 datasheet, design the VCO with a supply
voltage VDD of 5V to render a center frequency (f
0
) approximately at 200kHz
and being able to tune roughly between 100kHz (f
min
) and 300kHz (f
max
).
• Sketch the output signal from the VCO for f
min
, f
max
, f
0
, (f
min
+ f
max
)/2 and when
VCO
IN
=VDD/2 and plot the output frequency (f
osc
) versus VCO’s DC input
voltage (VCO
IN
) with VCO
IN
from 0V to VDD (=5V). From this graph,
calculate the VCO constant K
O
(in radians/sec-volt), which is the ratio of the
change in operating frequency versus the input voltage. Note that the loop
filter is not needed in this part. It is important to determine K
O
experimentally
because its value will be needed for the design of the PLL loop filter in the
subsequent parts of the experiment.
4. Phase Comparator I
The phase comparator I on the 4046 is simply an XOR logic gate (exclusive-OR),
with logic low output (v
Φ
= 0V) when the two inputs are both high or both low, and
the logic high output (v
Φ
= VDD) otherwise. Figure 5 illustrates the operation of the
XOR phase detector when the PLL is in the locked condition. V
i2
(the amplified of
input
v
i
) and
v
osc
(the VCO output) are two phase-shifted periodic square-wave
signals at the same frequency
f
osc
=
f
i
= 1/T
i
, and with 50% duty ratios. The output of
the phase detector is a periodic pulse signal v
Φ
(t) at the frequency of 2
f
i
, and with the
duty ratio D
Φ
which depends on the phase difference ∆
Φ
(in radians) between
v
i
and
v
osc
,
D
Φ
= ∆
Φ/π
( 4)
7
Figure 5: Operation of the 4046’s phase comparator I (XOR gate).
The periodic signal v
Φ
(t) at the output of the XOR phase detector can be expressed by
Fourier series:
( )( )
ki
k
k
kP
tfkvVtv
θπ
φ
−+=
∑
∞→
=
4sin)(
1
(5)
where V
P
is the DC component of v
Φ
(t), and
v
k
is the amplitude of the
k
th
harmonic at
the frequency 2k
f
i
. Prove that V
P
is equal to V
DD
⋅∆
Φ/π
? Plot V
P
against
∆
Φ
for 0
≤
∆
Φ
≤
π
. What is the K
D
of this particular XOR-gate phase comparator?
Analysis of a more complicated phase comparator II is beyond the scope of this
experiment, in later part of the experiment we will use phase comparator II just to see
its functionality without obtaining the corresponding K
D
value.
5. Loop Filter Design
The loop filter is placed between one of the phase detector’s output (either pin 2 or
pin 13) and the VCO input (pin 9). This filter attenuates the high frequency harmonics
present in the phase detector output. It also significantly controls the PLL loop
dynamics.
The output v
Φ
(t) of the phase detector is filtered by an external low-pass filter before
being fed into the VCO. In Figure 4, the loop filter is a simple passive RC filter. The
purpose of the low-pass filter is to pass the dc and low-frequency portions of v
Φ
(t) and
to attenuate high-frequency ac components at frequencies 2kf
i
. The simple RC filter
has the transfer function:
p
s
CsR
sF
ω
+
=
+
=
1
1
1
1
)(
23
(6)
with
8
23
2
1
2 CR
f
p
p
ππ
ω
== (7)
is the cut-off frequency of the filter. If f
p
<< 2f
i
, i.e., the cut-off frequency of the filter
is much smaller than twice of the incoming-signal frequency f
i
, the output of the filter
is approximately equal to the dc component V
P
of the phase detector’s output. In
practice, the high-frequency components are not completely eliminated and can be
observed as high-frequency ac ripple around the dc or slowly-varying
v
o
.
With F(s) described by a simple first-order low-pass filter of Eq.(7), the PLL closed-
loop transfer function of Eq.(3) can be re-arranged into a standard form of the second-
order transfer function, that is
++
=
1
2
11
)(
2
2
s
s
K
s
V
n
n
Oi
O
ω
ξ
ω
ω
(8)
Prove that:
pDOn
KK
ωω
=
(9)
and
DO
p
KK
ω
ξ
2
1
= (10)
For a second-order system, it generally requires to have a damping factor
ξ
to be 1/√2
for an optimal operation (Find out why?).
(5.1) Using information for K
O
and K
D
obtained from previous sections to design the
low-pass filter such that the damping factor
ξ
= 1/√2. Calculate the corresponding
low-pass filter’s bandwidth and the bandwidth of the closed-loop response! Is it
possible to design a low-pass filter that renders
independent
values between the
filter’s bandwidth (and closed-loop bandwidth) and the damping factor?
With the design you have got, you can now build up a complete PLL circuitry using a
phase comparator I (XOR gate) as the phase detector and your circuit should look
similar to that in Figure 6, noting that values of R1, R2 and C1 have been previously
designed in section 3.
9
Figure 6: The basic PLL with an XOR gate as a phase detector and a simple
lowpass filter as a loop filter.
(5.2) If there is no incoming input signal, v
i
= 0, observe the signals at pin 2 and
VCO’s output (pin 4) and input (pin 9). Explain what is happening!? Measure the
free-running frequency
f
o
.
(5.3) Apply a 1Vp-p square wave as an incoming input signal
v
i
at frequency
f
i
–
adjust
f
i
to be sufficiently close to the free-running frequency
f
o
. Use a dual-trace
oscilloscope to monitor
v
i
and VCO output
v
osc
. When the PLL operates in a locked
condition, you should be able to simultaneously view signals from both channels of
the oscilloscope (two signals are at the same frequency), otherwise one of the
waveform on the scope screen is blurred or is moving with respect to the other. By
changing
f
i
of the incoming signal, measure the actual lock range and capture range
of the PLL. Determine the minimum peak-to-peak amplitude of the incoming signal
v
i
such that the PLL remains locked. Does this particular PLL lock on harmonics?
Record the waveforms
v
i
,
v
osc
, output from the phase detector (
v
Φ
), and input of the
VCO (
v
o
) for the PLL in the locked condition at three different frequencies:
(a)
f
i
=
f
o
;
(b)
f
i
= the lowest frequency of the lock range
(c)
f
i
= the highest frequency of the lock range
Analyse what you have measured! Compare the phase difference between
v
i
and
v
osc
to the theoretical prediction for the three frequencies of the incoming signal.
Plot the hysteresis characteristic (similar to Figure 2) of your PLL.
Also sketch the waveforms
v
osc
,
v
Φ
, and
v
o
when the PLL is NOT in the locked
condition, explain what you see.
Employ Phase Comparator II as the PLL’s phase detector and re-do the whole of this
section. Compare the results to those obtained with the Phase Comparator I.
10
(5.4) Re-design your low-pass filter with two new bandwidths (
ω
p
) of ten times higher
and lower than originally obtained from section (5.1), calculate the corresponding new
values of
ξ
. With these two new filters, re-do the whole of section (5.3) using both
types of phase comparators. Compare the results to what have been obtained in
section (5.3). Analyse your results!
What are the advantages and disadvantages of the PLL employing a simple first-order
low-pass filter?
6. Lead-Lag Filter as a Loop Filter
A disadvantage of the second-order loop PLL system designed in section 5 is that the
bandwidth of the loop is basically dictated by loop gain K
O
K
D
. In general, the loop
gain also sets the lock range, so that with the simple filter used above these two
parameters are constrained to be comparable. Situations do arise in phase-locked
communications in which a wide lock range is desired for tracking large signal-
frequency variations, yet a narrow loop bandwidth is desired for rejecting out-of-band
signals. Using a very small
ω
p
would accomplish this were it not for the fact that this
also produces underdamped loop response. By adding a zero to the loop filter, the
loop filter pole can be made small while still maintaining good loop damping. This
can be accomplished by employing a lead-lag filter in Figure 7 as a loop filter instead
of a simple low-pass filter.
R4
R5
C3
IN OUT
Figure 7: Lead-lag filter.
Transfer function F(s) of the lead-lag filter can be arranged in a form of
p
z
s
s
sF
ω
ω
′
+
+
=
1
1
)(
(11)
Express
ω
z
and
ω
'
p
in terms of R4, R5 and C3.
Show that the closed-loop transfer function of the PLL in Figure 3 can be found to be:
++
+
=
1
2
1
1
)(
2
2
s
s
s
K
s
V
n
n
z
Oi
O
ω
ξ
ω
ω
ω
(12)
when the lead-lag filter in Figure 7 is employed as a loop filter, where
11
pDOn
KK
ωω
′
=
(13)
+
′
=
zDO
pDO
KK
KK
ω
ω
ξ
11
2
(14)
Design the lead-lag filter to render
ω
′
p
=16krad/s (also calculate the corresponding
closed-loop bandwidth
ω
n
) with a damping factor
ξ
=1/√2.
With the design you have, carry out the same experiment as in section (5.3). Analyse
the results you measure. Try to increase
ω
′
p
to 160krad/s while maintaining
ξ
at 1/√2
and explain what you see.
7. FM Modulation and Demodulation
In this part of the experiment, we investigate the application of PLL for FM
demodulation. Students are strongly advised to read a supplementary note on FM
demodulation technique using PLL [4].
(7.1) Another 4046 IC is needed to generate an FM modulated signal. Use the design
information from section 3 to generate FM carrier signal at frequency f
0
(150kHz) and
modulate it with 1kHz sinusoidal signal. Hint: you will only need the VCO on 4046 to
build this FM modulator. Observe the output signal of the VCO, what do you see?
(7.2) Inject the modulated FM signal from section (7.1) into the input of the PLL you
designed in section 6 (with
ω
′
p
=16krad/s and use phase comparator II as a phase
detector). Here, the PLL is being employed as an FM demodulator. Have you
managed to recover the 1kHz modulating signal. Explain the operation of the entire
system (FM modulator and demodulator). Sketch the demodulated signal and compare
it with the modulating on the same scope screen. What happens if phase comparator I
(XOR gate) is employed instead of phase comparator II. Are you still able to recover
the modulating signal if it is changed from sinusoid to square or triangular waves?
With the set-up you have, measure the following parameters of your PLL: settling
time, percentage overshoot, rise time of the PLL dynamics. Do they agree with
theoretical calculations? (please refer to [5])
Analyse the results you have obtained and conclude the experiment.
[Optional] Try injecting MP3 music to the input of the modulator and see if you can
manage to recover and hear the original sound from your demodulator. You definitely
need a speaker for this!
[Optional] Use Matlab-Simulink, Orcad-PSPICE to perform system simulation and
verify functionalities of your FM modulation/demodulation system.
• Specifically, inspect spectrum of the FM signal when the carrier has been
modulated by a 1-kHz sinusoidal signal – compare your results with
theoretical predictions.
12
• Carry out experiment to examine the phase-locking transient dynamic of your
system with respect to classical feedback control theoretical concept
(overshoot, damping, settling time, natural frequency, etc).
Write up the report. Remember, results without theoretical analysis and
scientific discussion are meaningless and carry no marks!
References
:
[1] B. Razavi, Design of Analog CMOS Integrated Circuits, Chapter 15, McGrawHill,
2001.
[2] P. R. Gray and R. G. Meyer, Analysis and Design of Analog Integrated Circuits,
Chapter 10, 3
rd
ed., Jonh Wiley & Sons, 1993 (or latest edition).
[3] Fairchild Semiconductor, CD4046BC Micropower Phase-Locked Loop, 2002.
Downloadable from
[4] J. Dunlop and D. G. Smith, Telecommunications Engineering, 3
rd
Ed., Chapman &
Hall, pp68-70, 1994.
[5] N. S. Nise, Control Systems Engineering, 4
th
Ed., John Wiley & Sons, 2004.
September, 2009