2020 05 15 20103077v1 full
Bạn đang xem bản rút gọn của tài liệu. Xem và tải ngay bản đầy đủ của tài liệu tại đây (954.58 KB, 13 trang )
medRxiv preprint doi: version posted May 20, 2020. The copyright holder for this preprint
(which was not certified by peer review) is the author/funder, who has granted medRxiv a license to display the preprint in perpetuity.
It is made available under a CC-BY 4.0 International license .
Mathematical Modeling and Simulation of SIR Model for COVID-2019
Epidemic Outbreak: A Case Study of India
Dr. Ramjeet Singh Yadav
Department of Computer Science and Engineering, Ashoka Institute of Technology and
Management, Varanasi-221007, Uttar Pradesh, India
Abstract
The present study discusses the spread of COVID-2019 epidemic of India and its end by
using SIR model. Here we have discussed about the spread of COVID-2019 epidemic in
great detail using Euler's method. The Euler’s method is a method of solution of ordinary
differential equations. The SIR model has the combination of three ordinary differential
equations. In this study, we have used the data of COVID-2019 Outbreak of India on 8th
May, 2020. In this data, we have used 135710 susceptible cases, 54340 infectious cases and
1830 reward/removed cases for the initial level of experimental purpose. Data about a wide
variety of infectious diseases has been analyzed with the help of SIR model. Therefore, this
model has already been well tested for infectious diseases. Using the data on the number of
COVID-2019 outbreak cases in India, the results obtained from the analysis and simulation of
the proposed model show that the COVID-2019 epidemic cases increase for some time and
thereafter this outbreak will decrease. The results obtained from the SIR model also suggest
that the Euler’s method can be used to predict transmission and prevent the COVID-2019
epidemic in India. Finally, from this study, we have found that the outbreak of COVID-2019
epidemic in India will be at its peak on 25 May 2020 and after that it will work slowly and on
the verge of ending in the first or second week of August 2020.
Keywords-SIR Model, Euler’s Method, Differential equations, Coronavirus, COVID-19
data set of India, SARS-CoV-2 Epidemics, Social distancing, Lockdown.
1. Introduction
Today, the corona virus epidemic has emerged as an important challenge in front of the
world. COVID-19 has about 354 confirmed cases and 24503 deaths as of May 4, 2020 [1].
Almost the entire population of the world is currently using lockdown, social distancing and
masks to stop this epidemic. India is also using such resources to fight this epidemic at the
moment. The COVID-19 epidemic is a member of SARS-Cov-2 family. No medicine has
been prepared for this disease yet. COVD-2019 is an epidemic spreads from one human to
another at a very rapid speed due to the breathing or contact of an infected person.
Hence COVID-2019 is a contagious disease. The incubation period of this disease is 2 to 1 4
days. In a recent study, it has been found that the overall mortality rate of COVID-19
epidemic is estimated at about 2-3%. This disease proves fatal for people above 60 years. The
overall mortality rate for people above 40 years of age is about 27% [2, 3]. In India, on
January 20, 2020, a patient of COVID-19 was found. This person came to Kerala from
Wuhan city of China. The first case of COVID-19 was found at the end of November 2014 in
Wuhan city of China. After 30 January 2020, the corona virus slowly spread in whole India.
1
medRxiv preprint doi: version posted May 20, 2020. The copyright holder for this preprint
(which was not certified by peer review) is the author/funder, who has granted medRxiv a license to display the preprint in perpetuity.
It is made available under a CC-BY 4.0 International license .
On 19 March 2020, the Prime Minister of India, Narendra Modi announced the janata curfew
on 22 March. After this, the Prime Minister gave lockdown to India all over India till 14
April 20 20. Even after lockdown in India, COVID-19 epidemic patients continued to grow.
Today, according to COVID-19 epidemic data in India which was available on Indian council
of medical research (ICMR) website, 81970 are infected, 27920 were cured and 2649 people
died on 15 May 2020. However, India has a much larger population density than other
countries and apart from this; medical facilities are not available in sufficient quantity.
Therefore, the risk of spreading corona virus is very high here. Despite all these, corona
infection in India is very less compared to other countries. In recent studies, it has been found
that the cause of corona virus infection in India is low due to warm climate as well as
humidity [4, 5], Bacille Calmette-Guérin (BCG) vaccination and a large amount of young
population [6]. Due to all this, the resistance of people here is very high compared to other
countries. All these studies are preliminary studies and no scientific evidence of this type of
study is available till now [7]. Hence there is a need to study COVID-2019 outbreak with
more evidence now. In this study we have presented an epidemic model based on sir method
of COVID-19 spread to India. Most epidemics have an initial exponential curve and then
gradually flatten out [8]. In this proposed study, we have also considered the effects of social
distancing on the growth of infections, lockdown and face mask India. India announced a
countrywide lockdown on March 24 for 21 days although a study has suggested that this
period may be insufficient for controlling the COVID-19 pandemic [9]. In the present study,
we have assumed the effects of social distancing measures, lockdown and face cover from the
time of spread to India.
Hence there is a need to study COVID-2019 with more evidence now. In this proposed study,
we have presented an epidemic model based on SIR method of COVID-19 spread to India.
The proposed SIR model has three differential equations. The solution of such type of
differential equation is difficult and time consuming. Therefore we have used Euler’s method
for solving these three differential equations. Most epidemics have an initial exponential
curve and then gradually flatten out.
The objectives of these studies are given below:
1. Finding the rate of spread of the disease with help of SIR model.
2. The development SIR model for exposed COVID-2019 outbreak at peak in India.
3. Forecast of COVID-2019 outbreak of India with next days, months even a year for
better management for doctors and various government organizations.
4. For find out the ending stage of COVID-2019 outbreak in India.
2. SIR Model
In this proposed study, we have considered an epidemic model which was developed by
Kermack and McKendrick in 1927 [10]. This epidemic model is also known as SIR
(Susceptible, Infective and Recover/Removed) epidemic model. This model have already
used successfully in several outbreak diseases like Avian influenza, Cholera, SARS, Ebola,
Plague, Yellow fever, Meningitis, MERS, Influenza, Zika, Rift Valley Fever, Lassa fever,
Leptospirosis [11, 12, 13, 14, 15]. The SIR model is very useful for future prediction, end
and peak of epidemic disease and other related activity of outbreak diseases [12].
Let us consider the population of India remains constant regarding the study COVID-2019
outbreak in India. Here, we have chosen all COVID-2019 tested population of India on 7
2
medRxiv preprint doi: version posted May 20, 2020. The copyright holder for this preprint
(which was not certified by peer review) is the author/funder, who has granted medRxiv a license to display the preprint in perpetuity.
It is made available under a CC-BY 4.0 International license .
April 2020. In this proposed study, we have total COVID-2020 tested population is divided
into three parts:
1. ( ) The number of susceptible population at time t i.e. number of total COVID2019 tested population till 7 April 2020.
2. ( ) The number of infectives population at time t, i.e. number of infected COVID2019 population of India till 7 April 2020.
3. ( ) The number of recovered population at time t, i.e. number of recovered or died
or naturally immune to the disease COVID-2019 population of India till 7 April 2020.
In this proposed study, we have take ( ) is equal to the recovered population plus died
population from COVID-2019 outbreak of India on 7 April 2020 for the sake of simplicity of
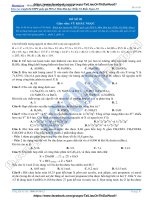
this study [16]. Figure 1 shows the description of proposed SIR model for not considering
virus evolution.
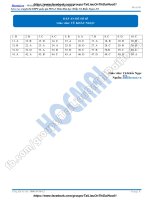
This model does not consider the development of COVID-2019 like most of the diseases.
But, in contrast my proposed SIR model which is shown in figure 2 does consider the
development of COVID-2019 outbreak of India. This model also predicts maximum growth
of COVID-2019 outbreak in India. Figure 2 shows the description of SIR model for
recovered re-tuning into susceptible because the COVID-2019 outbreak of India has evolved
into one which can re-infect.
𝒓(𝒕)
𝒂(𝒕)
𝑰(𝒕)
𝑺(𝒕)
𝑹(𝒕)
Figure 1: Description of SIR model not considering COVID-2019 outbreak virus evolution
𝒓(𝒕)
𝑺(𝒕)
𝒂(𝒕)
𝑰(𝒕)
𝑹(𝒕)
Figure 2: Description of SIR model considering COVID-2019 outbreak virus evolution
3. Methodology of SIR Model
Let us consider the following three differential equations are used for experimental studies
and experimental discussion for COVID-2019 of India. The description of these three
differential equations is given below:
( )
(1)
( )
(2)
( )
(3)
The parameters r and a of above differential equations are known as the infection rate and
recovery/removal rate of COVID-2019 of India. In this proposed study the average time of
COVID-2019 outbreak of India is approximately 14 days. These numerical values of r and a
3
medRxiv preprint doi: version posted May 20, 2020. The copyright holder for this preprint
(which was not certified by peer review) is the author/funder, who has granted medRxiv a license to display the preprint in perpetuity.
It is made available under a CC-BY 4.0 International license .
are very useful in initial level for solving the three differential equations of COVID-2019
outbreak of India.
The three differential equations (1), (2) and (3) of the proposed SIR epidemic model for
COVID-2020 outbreak of India can be also written as [12]:
(4)
(5)
(6)
These three differential equations of SIR model is known as Kermack-McKendrick [12] SIR
model. At the present time, this model is very useful for the data analysis of COVID-2019 in
India. Again adding equation number (4), (5) and (6), we can get another very useful
expression for COVID-2019 data analysis. This expression is given below:
(7)
After integrating equation number (7), we can get the following relation for calculating the
total population of COVID-2019:
where is known as the constant of integration which is measure the total
size of population for COVID-2019 at initial level and after end the epidemic COVID-2019
in India. This is constant population at all levels of COVID-2019 outbreak. The above
can be also denoted by in the following form:
expression
( )
( )
( )
(8)
For the experimental purpose of data analysis of COVID-2019 outbreak of India, we can take
the following initial values of proposed SIR model, i.e.
( )
( )
( )
Here the population size of India is constant. We can calculate the recovered population of
COVID-2019 outbreak of India which given by the following formula:
( )
( ))
( ( )
(9)
The above three differential equations (4), (5) and (5) of the proposed SIR model can be
converted into two differential equations equation number (9). The solution of these two
differential equations is very difficult and time consuming. But the solution is very necessary
of these two differential equations for data analysis of COOVID-2019 outbreak of India. In
this proposed study, we have used quantitative approach for solving these two differential
equations of SIR model.
Now, here we can say that if is less than zero for all t and if is greater than zero as long
as the initial population (say the number of susceptible cases in India on 7 May 2020) is
greater than the ratio, . In other words, we can say that we will initially increase to some
maximum if initial population
is greater than the ratio
but eventually it must decrease
and approaching to zero because decreasing. In this proposed study, we have introduced
some cases for COVID-2019 outbreak of India, which is given below:
Case-1: If is less than the ratio, then the infection I of COVID-2020 outbreak of India
will be decrease or simply to be zero after some times.
4
medRxiv preprint doi: version posted May 20, 2020. The copyright holder for this preprint
(which was not certified by peer review) is the author/funder, who has granted medRxiv a license to display the preprint in perpetuity.
It is made available under a CC-BY 4.0 International license .
Case-2: If
is greater than the ratio
then the infection I of COVID-2020 outbreak of India
will be epidemic of COVID-2019.
These are the assumptions of SIR model regarding the COVID-2019 outbreak of India.
Therefore from the above two assumptions, we can say that the behavior of COVID-2019
outbreak of India depends on the values of following expression:
(10)
This quantity is known as the threshold number. In this present study we have defined
another quantity called reproductive number which is denoted by
and defined by the
following expression (10). This is the number of secondary infectives of COVID-2019
outbreak produced by one primary infective in the susceptible populations. Here, there are
two cases of COVID-2019 of India regarding reproductive number:
Case-1: If
is less than one then COVID-2019 outbreak will be does out from India..
Case-2: If
is more than one, then the outbreak of COVID-2019 is still in epidemic
form in India.
3.1. Phase Plan and Experimental Results of COVID-2019 Outbreak of India
There is an absolute need to solve the differential equation of the proposed the SIR model for
analysis of COVID-2019 outbreak of India. Let us consider a population of susceptible of
COVID-2019 outbreak and a small number of infected populations. Is the of COVID-2019
infectives populations increase substantially in India? The answer of this question will get
after solving differential equations of (4), (5) and (6). The differential equations (4), (5) and
(6) is system of differential equation and these equations have three unknown. These systems
of differential equations are very difficult to solve. Although, after combining the equation
(4) and (5) then we get the single differential equation with one unknown for the proposed
SIR model. The procedure is as follows:
According to the chain rule calculus:
(
)
(
)
(
)
)
(
Integrating both sides of above equation, we get
∫
∫(
( )
)
(11)
Where, C is the arbitrary constant.
And
(12)
This Karmack-Mchendrick SIR model is equipped with the initial conditions. We take the
initial conditions which are given below:
( )
and I( )
then the equation (11) becomes:
( )
(13)
5
medRxiv preprint doi: version posted May 20, 2020. The copyright holder for this preprint
(which was not certified by peer review) is the author/funder, who has granted medRxiv a license to display the preprint in perpetuity.
It is made available under a CC-BY 4.0 International license .
( )
(14)
Let us consider the population size of susceptible case of COVID-2019 outbreak of India is
K. This is approximately equal to initial population of India. Here, we will introduce a
small number of infectives in the population. Therefore,
and
If ( )
as
then (
and
)
( ) gives the following expression:
( )
(
)
Where
is the susceptible population of India if infectives case will be zero. After
simplification of above expression, we will get the following expression:
(
)
( )
[ ( )
( )
(
(
)
)]
* +
*
+
(15)
Here
that is past of the population of India escapes the COVID-2019 infective.
In this proposed study, it is very difficult to estimate the parameters of r and a because these
are depends on disease being studies and on social and behavioral factors of that country. The
and can be estimated by serological studies before and after of the COVIDpopulation
2019 outbreak and using this data, the basic reproduction number is given by the following
formula:
(16)
This expression can be calculated using expression (15). The maximum number of COVID2019 outbreak infectives at any time in India can be obtained by substantially using the
following calculation:
Putting
and
in equation (11), we get the maximum number of infective case
of COVID-2019 outbreak in India at any time.
( )
Where,
( )
Therefore the maximum number of infectives cases
can calculated with the help of following expression:
( )
of COVID-2019 outbreak of India
( )
(17)
The differential equation of the proposed SIR model can be solved with help of many
numerical methods such as Runge Kutta and Euler methods. Here we have used Euler
method for solving SIR model based differential equation.
In this proposed study, we have used the MATLAB software for solving the differential
equation using the above initial conditions values of
, a and r. The experimental
6
medRxiv preprint doi: version posted May 20, 2020. The copyright holder for this preprint
(which was not certified by peer review) is the author/funder, who has granted medRxiv a license to display the preprint in perpetuity.
It is made available under a CC-BY 4.0 International license .
results of SIR model is shown in table 1. Here, the numerical calculation and data analysis of
COVID-2019 outbreak of India has been done with the help of Euler method.
Euler’s method is purely numerical method for solving the first order differential equations.
The SIR model have also system of first order differential equations. So, the Euler’s method
is more suitable for solving the proposed SIR based system of differential equations. The
description of the Euler’s method is given below:
Let consider the first order differential equation:
(
)
(18)
The solution of differential equation (18) is given by the following expression:
(
)
(19)
is a small step size in the time domain and (
) is the slope of the curve. Here,
Where
we want to calculate the dependent variable called S, I and R to the proposed SIR model.
Therefore the solution of proposed SIR model based differential is converted into Euler
method forms which are given below:
(
)
( )
( ) ( )
(20)
(
)
( ) [ ( ) ( )
( )]
(21)
(
)
( )
( )
(22)
In this proposed study, we have used COVID-2019 data set from India on 7 May 2020. Here,
we have taken the total number of COVID-2019 tested population as
total number of
infectives population as and total number of recovered/removed cases as
at initial level
for analyzing the COVID-2019 outbreak of India on 7 May 2020. These three initial
populations
and
are represented as:
The value of recovery rate/removal rate and infection rate of COVID-2019 outbreak of India
can be calculated with the help by the following expression:
, (Because the incubation time of COVID-2019 outbreak of India is 14 day)
Putting the values of
, r, a,
and
in equation (20), (21) and (22) to get the next
generation values Susceptible population S1, I1 and R1,
(
(
)
)
(
)
7
medRxiv preprint doi: version posted May 20, 2020. The copyright holder for this preprint
(which was not certified by peer review) is the author/funder, who has granted medRxiv a license to display the preprint in perpetuity.
It is made available under a CC-BY 4.0 International license .
Similarly, we can calculate other iteration. The numerical results of Euler’s method of SIR
model is shown table 1.
Table 1: SIR Methods Simulation and Results of Runge Kutta Fourth Order Method
S.No.
1
2
3
4
5
6
7
8
9
10
11
12
13
14
15
16
17
18
19
20
21
22
23
24
25
26
27
28
29
30
31
32
33
34
35
36
37
38
39
40
41
Date
7-May-2020
8-May-2020
9-May-2020
10-May-2020
11-May-2020
12-May-2020
13-May-2020
14-May-2020
15-May-2020
16-May-2020
17-May-2020
18-May-2020
19-May-2020
20-May-2020
21-May-2020
22-May-2020
23-May-2020
24-May-2020
25-May-2020
26-May-2020
27-May-2020
28-May-2020
29-May-2020
30-May-2020
31-May-2020
1-June-2020
2-June-2020
3-June-2020
4-June-2020
5-June-2020
6-June-2020
7-June-2020
8-June-2020
9-June-2020
10-June-2020
11-June-2020
12-June-2020
13-June-2020
14-June-2020
15-June-2020
16-June-2020
Day/Time
0
0.1407
0.2815
0.4222
0.5629
1.2091
1.8552
2.5013
3.1474
3.99
4.8326
5.6752
6.5178
7.5519
8.586
9.6202
10.6543
11.8923
13.1304
14.3684
15.6065
16.5352
17.4639
18.3926
19.3213
20.2499
21.1786
22.1073
23.036
24.1739
25.3118
26.4497
27.5876
29.0546
30.5215
31.9885
33.4554
35.604
37.7526
39.9012
42.0498
S
13.57410
13.53930
13.50290
13.46460
13.42450
13.21490
12.95740
12.64410
12.26760
11.67150
10.94780
10.09940
9.14520
7.87820
6.58980
5.36510
4.27120
3.19080
2.35370
1.72990
1.28090
1.03080
0.83580
0.68320
0.56360
0.46950
0.39480
0.33510
0.28690
0.24010
0.20350
0.17450
0.15130
0.12780
0.10970
0.09550
0.08430
0.07170
0.06240
0.05540
0.05000
8
I
0.56340
0.59240
0.62280
0.65460
0.68790
0.86190
1.07490
1.33280
1.64090
2.12430
2.70320
3.36910
4.09880
5.02850
5.91230
6.67150
7.24990
7.66910
7.82000
7.75340
7.52520
7.28400
7.00500
6.70270
6.38800
6.06890
5.75160
5.44010
5.13750
4.78130
4.44320
4.12410
3.82440
3.46620
3.13850
2.83970
2.56780
2.21410
1.90760
1.64270
1.41410
R
0.18430
0.19010
0.19620
0.20260
0.20930
0.24500
0.28950
0.34490
0.41330
0.52600
0.67090
0.85330
1.07780
1.41510
1.81970
2.28520
2.80070
3.46190
4.14810
4.83860
5.51570
6.00700
6.48100
6.93590
7.37030
7.78340
8.17540
8.54660
8.89740
9.30040
9.67510
10.02320
10.34610
10.72780
11.07360
11.38660
11.66970
12.03600
12.35180
12.62370
12.85780
S+I+R
14.32180
14.32180
14.32190
14.32180
14.32170
14.32180
14.32180
14.32180
14.32180
14.32180
14.32190
14.32180
14.32180
14.32180
14.32180
14.32180
14.32180
14.32180
14.32180
14.32190
14.32180
14.32180
14.32180
14.32180
14.32190
14.32180
14.32180
14.32180
14.32180
14.32180
14.32180
14.32180
14.32180
14.32180
14.32180
14.32180
14.32180
14.32180
14.32180
14.32180
14.32190
medRxiv preprint doi: version posted May 20, 2020. The copyright holder for this preprint
(which was not certified by peer review) is the author/funder, who has granted medRxiv a license to display the preprint in perpetuity.
It is made available under a CC-BY 4.0 International license .
42
43
44
45
46
47
48
49
50
51
52
53
54
55
56
57
58
59
60
61
62
63
64
65
66
67
68
69
70
71
72
73
74
75
76
77
78
79
80
81
82
83
84
85
86
87
88
89
17-June-2020
18-June-2020
19-June-2020
20-June-2020
21-June-2020
22-June-2020
23-June-2020
24-June-2020
25-June-2020
26-June-2020
27-June-2020
28-June-2020
29-June-2020
30-June-2020
1-July-2020
2-July-2020
3-July-2020
4-July-2020
5-July-2020
6-July-2020
7-July-2020
8-July-2020
9-July-2020
10-July-2020
11-July-2020
12-July-2020
13-July-2020
14-July-2020
15-July-2020
16-July-2020
17-July-2020
18-July-2020
19-July-2020
20-July-2020
21-July-2020
22-July-2020
23-July-2020
24-July-2020
25-July-2020
26-July-2020
27-July-2020
28-July-2020
29-July-2020
30-July-2020
31-July-2020
1-August-2020
2-August-2020
3-August-2020
45.092
48.1343
51.1766
54.2188
57.0367
59.8547
62.6726
65.4905
68.2881
71.0857
73.8833
76.6809
79.4708
82.2608
85.0508
87.8408
90.6279
93.415
96.2022
98.9893
101.775
104.561
107.347
110.133
112.918
115.704
118.489
121.275
124.06
126.845
129.63
132.415
135.2
137.985
140.77
143.555
146.34
149.125
151.91
154.695
157.48
160.265
163.05
165.835
169.03
172.225
175.42
178.615
0.04420
0.04000
0.03700
0.03480
0.03310
0.03180
0.03080
0.03000
0.02940
0.02880
0.02840
0.02810
0.02780
0.02760
0.02740
0.02720
0.02710
0.02700
0.02690
0.02690
0.02680
0.02680
0.02670
0.02670
0.02670
0.02670
0.02660
0.02660
0.02660
0.02660
0.02660
0.02660
0.02660
0.02660
0.02660
0.02660
0.02660
0.02660
0.02660
0.02660
0.02660
0.02660
0.02660
0.02660
0.02660
0.02660
0.02660
0.02660
9
1.14270
0.92290
0.74560
0.60240
0.49390
0.40500
0.33210
0.27240
0.22360
0.18350
0.15070
0.12380
0.10160
0.08350
0.06860
0.05630
0.04630
0.03800
0.03120
0.02570
0.02110
0.01730
0.01420
0.01170
0.00960
0.00790
0.00650
0.00530
0.00440
0.00360
0.00300
0.00240
0.00200
0.00160
0.00130
0.00110
0.00090
0.00070
0.00060
0.00050
0.00040
0.00030
0.00030
0.00020
0.00020
0.00010
0.00010
0.00010
13.13500
13.35890
13.53910
13.68470
13.79480
13.88500
13.95890
14.01940
14.06880
14.10940
14.14270
14.17000
14.19240
14.21080
14.22590
14.23820
14.24840
14.25680
14.26360
14.26930
14.27390
14.27770
14.28090
14.28340
14.28550
14.28730
14.28870
14.28990
14.29080
14.29160
14.29230
14.29280
14.29320
14.29360
14.29390
14.29410
14.29430
14.29450
14.29460
14.29470
14.29480
14.29490
14.29500
14.29500
14.29510
14.29510
14.29510
14.29510
14.32190
14.32180
14.32170
14.32190
14.32180
14.32180
14.32180
14.32180
14.32180
14.32170
14.32180
14.32190
14.32180
14.32190
14.32190
14.32170
14.32180
14.32180
14.32170
14.32190
14.32180
14.32180
14.32180
14.32180
14.32180
14.32190
14.32180
14.32180
14.32180
14.32180
14.32190
14.32180
14.32180
14.32180
14.32180
14.32180
14.32180
14.32180
14.32180
14.32180
14.32180
14.32180
14.32190
14.32180
14.32190
14.32180
14.32180
14.32180
medRxiv preprint doi: version posted May 20, 2020. The copyright holder for this preprint
(which was not certified by peer review) is the author/funder, who has granted medRxiv a license to display the preprint in perpetuity.
It is made available under a CC-BY 4.0 International license .
90
91
92
93
94
95
96
97
4-August-2020
5-August-2020
6-August-2020
7-August-2020
8-August-2020
9-August-2020
10-August-2020
11-August-2020
182.323
186.031
189.739
193.448
195.086
196.724
198.362
200.000
0.02660
0.02660
0.02660
0.02660
0.02660
0.02660
0.02660
0.02660
0.00010
0.00010
0.00000
0.00000
0.00000
0.00000
0.00000
0.00000
14.29520
14.29520
14.29520
14.29520
14.29520
14.29520
14.29520
14.29520
14.32190
14.32190
14.32180
14.32180
14.32180
14.32180
14.32180
14.32180
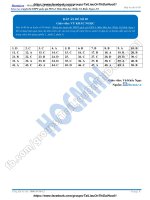
Figure 3 shows Simulation proposed SIR Model for COVID-2019 epidemic state of India
from 7-May 2020. This figure also shows that the date of the maximum number of infection
cases of COVID-2019 in India is 25 May 2020 (see table 1 from bold column). The figure 4
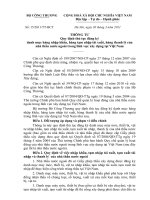
shows the maximum number of infected cases of COVID-2019 outbreak of India. Apart from
this, the figure 5 shows recovered cases of COVID-2019 outbreak of India.
Figure 3: SIR Model Simulation for COVID-2019 epidemic state of India from 7-May 2020
The maximum number of infectives cases (
calculated using equation (17) is as follows:
Then the ratio
) of COVID-2019 outbreak of India can be
can be calculated using equation (15) i.e.
Therefore
Hence
Here, we have multiply by 100000 in
to get maximum number
of infectives cases of COVID-2019 outbreak of India because 100000 is the normalization
factor of this proposed study. Therefore
which is the
real data pointing at 782000 in table 1. From this table, we have seen that maximum number
10
medRxiv preprint doi: version posted May 20, 2020. The copyright holder for this preprint
(which was not certified by peer review) is the author/funder, who has granted medRxiv a license to display the preprint in perpetuity.
It is made available under a CC-BY 4.0 International license .
of infectives cases of CODID-2019 is 782000. This value is near by the
. Therefore, we
have seen that there will be a maximum outbreak of COVID-2019 in India on 25 May 2020,
then it will decrease continuously till the first week of August 2020.
The reproductive number of COVID-2019 outbreak can be also calculated on initial, pick,
end of COVID-2019 outbreak and any time during epidemic of COVID-2019 of India. Here,
there are some reproductive number calculations are given below:
1. Initial level of COVID-2019:
2. Pick level (maximum of COVID-2019):
(
)
3. End level of COVID-2019:
(
)
From above calculation, we have observed that the if reproductive number is greater than one
then the COVID-2019 increasing continuously at pick/maximum level Case-1 and case-2)
and if reproductive number is less than one then the COVID-2019 is died off (case-3).
However, the reproduction number of COVID-2019 has been calculated by epidemiological
scientists all over the world.
Figure 4: Maximum Number of Infective cases of COVI-2019 outbreak of India
11
medRxiv preprint doi: version posted May 20, 2020. The copyright holder for this preprint
(which was not certified by peer review) is the author/funder, who has granted medRxiv a license to display the preprint in perpetuity.
It is made available under a CC-BY 4.0 International license .
Figure 5: Recovered cases of COVI-2019 outbreak of India
In the study presented, we get the following observation:
1. The outbreak of COVID-2019 will be at its peak on 25 May 2020 in India, after
which the outbreak of this epidemic will continue to work slowly.
2. The outbreak of COVID-2019 in India will be till the first or second week of August
2020, after which the epidemic will end.
3. The initial stage of COVID-2019, the reproductive number of this outbreak of India
is 6.
4. Conclusion
Based on the data as of May 9, 2020 in the study presented, the SIR model indicates that
COVID-2019 outbreak will be at its peak in India by 25 May 2020 or by the end of May. On
the basis of this study, we can say that after the end of May 2020, the outbreak of this
epidemic will start working slowly and by the first week of August 2020, the outbreak of this
epidemic will be towards end. On the basis of the data obtained by this model, it would be
wrong to say that the COVID-2019 outbreak in India will go on because people here today
are neither following social distancing nor applying their face masks. Hence this epidemic
threat is very high risk in India. This study also shows that if locking, social distancing and
masks etc. are used properly in India, then the outbreak of COVID-2019 epidemic can be
almost eliminated in the first or second week of August 2020. This proposed study is very
useful for the future prediction of outbreak of COVID-2019. This proposed SIR model will
automatically estimates the number of cases of weekly, bi-weekly, month and even year.
Therefore, we can say that the Indian government and doctors can maintain a check on
hospital facilities, necessary supplies for new patients, medical aid and isolation for next
week or in future.
12
medRxiv preprint doi: version posted May 20, 2020. The copyright holder for this preprint
(which was not certified by peer review) is the author/funder, who has granted medRxiv a license to display the preprint in perpetuity.
It is made available under a CC-BY 4.0 International license .
References
[1.] World Health Organization, 2020. Coronavirus disease 2019 (COVID19): situation
report, 67.
[2.] Tanu Singhal. A review of coronavirus disease-2019 (COVID-19). The Indian
Journal of Pediatrics, pages 1–6, 2020.
[3.] Zunyou Wu and Jennifer M McGoogan. Characteristics of and important lessons
from the coronavirus disease 2019 (COVID-19) outbreak in China: summary of a
report of 72 314 cases from the Chinese center for disease control and prevention.
Jama, 2020.
[4.] Yueling Ma, Yadong Zhao, Jiangtao Liu, Xiaotao He, Bo Wang, Shihua Fu, Jun
Yan, Jingping Niu, and Bin Luo. Effects of temperature variation and humidity on
the mortality of covid-19 in Wuhan. MedRxiv, 2020.
[5.] Miguel B. Araujo and Babak Naimi. Spread of SARS-CoV-2 Coronavirus likely to
be constrained by climate. MedRxiv, 2020.
[6.] Samar Salman and Mohammed Labib Salem. The mystery behind childhood sparing
by COVID-19. International Journal of Cancer and Biomedical Research, 2020.
[7.] Wei Luo, Maimuna Majumder, Dianbo Liu, Canelle Poirier, Kenneth Mandl, Marc
Lipsitch, and Mauricio Santillana. The role of absolute humidity on transmission
rates of the covid-19 outbreak. 2020.
[8.] Junling Ma, Jonathan Dushoff, Benjamin M Bolker, and David JD Earn. Estimating
initial epidemic growth rates. Bulletin of mathematical biology, 76(1):245–260,
2014.
[9.] Rajesh Singh and R Adhikari. Age-structured impact of social distancing on the
COVID-19 epidemic in India. ARXiv preprint ARXiv: 2003.12055, 2020.
[10.] W. O. Kermack, A. G. McKendrick, Contribution to the Mathematical Theory of
Epidemics. Proc Roy. Soc. A115 (1927) p. 700.
[11.] Fred Brauer, Carlos Castillo-Chávez, Mathematical Models in Population Biology
and Epidemiology, New York Springer 2001.
[12.] H. W. Hethcote. The Mathematics of Infectious Diseases, SIAM Rev. 42 (2000), pp.
599-653.
[13.] J. D. Murray, Mathematical Biology, Springer-Verlag (1993).
[14.] R. M. Anderson, R. M. May, Infectious Diseases of Humans, Oxford University
Press (1991), pp. 142-143.
[15.] R. W. West, J. R. Thompson, Models for the Simple Epidemic, Math. Biosciences,
141 (1997), p 29.
[16.] on 7 May 2020.
13