René guinebretière x ray diffraction by polycr(bookzz org)
Bạn đang xem bản rút gọn của tài liệu. Xem và tải ngay bản đầy đủ của tài liệu tại đây (6.09 MB, 384 trang )
X-ray Diffraction by Polycrystalline Materials
This page intentionally left blank
X-ray Diffraction by
Polycrystalline
Materials
René Guinebretière
First published in France in 2002 and 2006 by Hermès Science/Lavoisier entitled “Diffraction
des rayons X sur échantillons polycristallins”
First published in Great Britain and the United States in 2007 by ISTE Ltd
Apart from any fair dealing for the purposes of research or private study, or criticism or
review, as permitted under the Copyright, Designs and Patents Act 1988, this publication may
only be reproduced, stored or transmitted, in any form or by any means, with the prior
permission in writing of the publishers, or in the case of reprographic reproduction in
accordance with the terms and licenses issued by the CLA. Enquiries concerning reproduction
outside these terms should be sent to the publishers at the undermentioned address:
ISTE Ltd
6 Fitzroy Square
London W1T 5DX
UK
ISTE USA
4308 Patrice Road
Newport Beach, CA 92663
USA
www.iste.co.uk
© ISTE Ltd, 2007
© LAVOISIER, 2002, 2006
The rights of René Guinebretière to be identified as the author of this work have been asserted
by him in accordance with the Copyright, Designs and Patents Act 1988.
Library of Congress Cataloging-in-Publication Data
Guinebretière, René.
[Diffraction des rayons X sur échantillons polycristallins. English]
X-ray diffraction by polycrystalline materials/René Guinebretière.
p. cm.
Includes bibliographical references and index.
ISBN-13: 978-1-905209-21-7
1. X-rays--Diffraction. 2. Crystallography. I. Title.
QC482.D5G85 2007
548'.83--dc22
2006037726
British Library Cataloguing-in-Publication Data
A CIP record for this book is available from the British Library
ISBN 13: 978-1-905209-21-7
Printed and bound in Great Britain by Antony Rowe Ltd, Chippenham, Wiltshire.
Table of Contents
Preface . . . . . . . . . . . . . . . . . . . . . . . . . . . . . . . . . . . . . . . . . . .
xi
Acknowledgements . . . . . . . . . . . . . . . . . . . . . . . . . . . . . . . . . . .
xv
An Historical Introduction: The Discovery of X-rays and the First
Studies in X-ray Diffraction . . . . . . . . . . . . . . . . . . . . . . . . . . . . . .
xvii
Part 1. Basic Theoretical Elements, Instrumentation and Classical
Interpretations of the Results . . . . . . . . . . . . . . . . . . . . . . . . . . . . .
1
Chapter 1. Kinematic and Geometric Theories of X-ray Diffraction . . . .
3
1.1. Scattering by an atom . . . . . . . . . . . . . . . . . . . . . . . . .
1.1.1. Scattering by a free electron . . . . . . . . . . . . . . . . . .
1.1.1.1. Coherent scattering: the Thomson formula . . . . . . . .
1.1.1.2. Incoherent scattering: Compton scattering [COM 23] .
1.1.2. Scattering by a bound electron . . . . . . . . . . . . . . . . .
1.1.3. Scattering by a multi-electron atom . . . . . . . . . . . . . .
1.2. Diffraction by an ideal crystal . . . . . . . . . . . . . . . . . . . .
1.2.1. A few elements of crystallography. . . . . . . . . . . . . . .
1.2.1.1. Direct lattice . . . . . . . . . . . . . . . . . . . . . . . . . .
1.2.1.2. Reciprocal lattice . . . . . . . . . . . . . . . . . . . . . . .
1.2.2. Kinematic theory of diffraction. . . . . . . . . . . . . . . . .
1.2.2.1. Diffracted amplitude: structure factor and form factor .
1.2.2.2. Diffracted intensity . . . . . . . . . . . . . . . . . . . . . .
1.2.2.3. Laue conditions [FRI 12] . . . . . . . . . . . . . . . . . .
1.2.3. Geometric theory of diffraction . . . . . . . . . . . . . . . .
1.2.3.1. Laue conditions . . . . . . . . . . . . . . . . . . . . . . . .
1.2.3.2. Bragg’s law [BRA 13b, BRA 15] . . . . . . . . . . . . .
1.2.3.3. The Ewald sphere. . . . . . . . . . . . . . . . . . . . . . .
.
.
.
.
.
.
.
.
.
.
.
.
.
.
.
.
.
.
.
.
.
.
.
.
.
.
.
.
.
.
.
.
.
.
.
.
.
.
.
.
.
.
.
.
.
.
.
.
.
.
.
.
.
.
.
.
.
.
.
.
.
.
.
.
.
.
.
.
.
.
.
.
.
.
.
.
.
.
.
.
.
.
.
.
.
.
.
.
.
.
3
3
3
6
8
11
14
14
14
16
17
17
18
22
23
23
24
26
vi
X-ray Diffraction by Polycrystalline Materials
1.3. Diffraction by an ideally imperfect crystal . . . . . . . . . . . . . . . . .
1.4. Diffraction by a polycrystalline sample . . . . . . . . . . . . . . . . . . .
28
33
Chapter 2. Instrumentation used for X-ray Diffraction . . . . . . . . . . . .
39
2.1. The different elements of a diffractometer . . . . . . . . . . . . . . .
2.1.1. X-ray sources . . . . . . . . . . . . . . . . . . . . . . . . . . . . . .
2.1.1.1. Crookes tubes . . . . . . . . . . . . . . . . . . . . . . . . . . . .
2.1.1.2. Coolidge tubes . . . . . . . . . . . . . . . . . . . . . . . . . . .
2.1.1.3. High intensity tubes . . . . . . . . . . . . . . . . . . . . . . . .
2.1.1.4. Synchrotron radiation . . . . . . . . . . . . . . . . . . . . . . .
2.1.2. Filters and monochromator crystals . . . . . . . . . . . . . . . . .
2.1.2.1. Filters . . . . . . . . . . . . . . . . . . . . . . . . . . . . . . . . .
2.1.2.2. Monochromator crystals . . . . . . . . . . . . . . . . . . . . . .
2.1.2.3. Multi-layered monochromators or mirrors . . . . . . . . . . .
2.1.3. Detectors . . . . . . . . . . . . . . . . . . . . . . . . . . . . . . . . .
2.1.3.1. Photographic film. . . . . . . . . . . . . . . . . . . . . . . . . .
2.1.3.2. Gas detectors . . . . . . . . . . . . . . . . . . . . . . . . . . . .
2.1.3.3. Solid detectors. . . . . . . . . . . . . . . . . . . . . . . . . . . .
2.2. Diffractometers designed for the study of powdered or bulk
polycrystalline samples . . . . . . . . . . . . . . . . . . . . . . . . . . . . .
2.2.1. The Debye-Scherrer and Hull diffractometer . . . . . . . . . . .
2.2.1.1. The traditional Debye-Scherrer and Hull diffractometer . . .
2.2.1.2. The modern Debye-Scherrer and Hill diffractometer: use of
position sensitive detectors . . . . . . . . . . . . . . . . . . . . . . . . .
2.2.2. Focusing diffractometers: Seeman and Bohlin diffractometers .
2.2.2.1. Principle . . . . . . . . . . . . . . . . . . . . . . . . . . . . . . .
2.2.2.2. The different configurations . . . . . . . . . . . . . . . . . . .
2.2.3. Bragg-Brentano diffractometers . . . . . . . . . . . . . . . . . . .
2.2.3.1. Principle . . . . . . . . . . . . . . . . . . . . . . . . . . . . . . .
2.2.3.2. Description of the diffractometer; path of the X-ray beams .
2.2.3.3. Depth and irradiated volume . . . . . . . . . . . . . . . . . . .
2.2.4. Parallel geometry diffractometers . . . . . . . . . . . . . . . . . .
2.2.5. Diffractometers equipped with plane detectors . . . . . . . . . .
2.3. Diffractometers designed for the study of thin films. . . . . . . . . .
2.3.1. Fundamental problem . . . . . . . . . . . . . . . . . . . . . . . . .
2.3.1.1. Introduction . . . . . . . . . . . . . . . . . . . . . . . . . . . . .
2.3.1.2. Penetration depth and diffracted intensity . . . . . . . . . . .
2.3.2. Conventional diffractometers designed for the study of
polycrystalline films . . . . . . . . . . . . . . . . . . . . . . . . . . . . . .
2.3.3. Systems designed for the study of textured layers. . . . . . . . .
.
.
.
.
.
.
.
.
.
.
.
.
.
.
39
39
41
42
47
49
52
52
55
59
62
62
63
68
. .
. .
. .
72
73
74
.
.
.
.
.
.
.
.
.
.
.
.
.
.
.
.
.
.
.
.
.
.
.
.
.
.
.
.
.
.
.
.
.
.
.
.
.
.
.
.
.
.
76
87
87
88
94
94
97
103
104
109
110
110
110
111
. .
. .
116
118
Table of Contents
vii
2.3.4. High resolution diffractometers designed for the study of
epitaxial films . . . . . . . . . . . . . . . . . . . . . . . . . . . . . . . . . . . .
2.3.5. Sample holder . . . . . . . . . . . . . . . . . . . . . . . . . . . . . . . .
2.4. An introduction to surface diffractometry . . . . . . . . . . . . . . . . . .
120
123
125
Chapter 3. Data Processing, Extracting Information . . . . . . . . . . . . . .
127
3.1. Peak profile: instrumental aberrations . . . . . . . . . . . . . . . . . . .
3.1.1. X-ray source: g1(ε) . . . . . . . . . . . . . . . . . . . . . . . . . . . .
3.1.2. Slit: g2(ε) . . . . . . . . . . . . . . . . . . . . . . . . . . . . . . . . . .
3.1.3. Spectral width: g3(ε) . . . . . . . . . . . . . . . . . . . . . . . . . . .
3.1.4. Axial divergence: g4(ε) . . . . . . . . . . . . . . . . . . . . . . . . .
3.1.5. Transparency of the sample: g5(ε) . . . . . . . . . . . . . . . . . . .
3.2. Instrumental resolution function . . . . . . . . . . . . . . . . . . . . . .
3.3. Fitting diffraction patterns . . . . . . . . . . . . . . . . . . . . . . . . . .
3.3.1. Fitting functions. . . . . . . . . . . . . . . . . . . . . . . . . . . . . .
3.3.1.1. Functions chosen a priori . . . . . . . . . . . . . . . . . . . . . .
3.3.1.2. Functions calculated from the physical characteristics of the
diffractometer . . . . . . . . . . . . . . . . . . . . . . . . . . . . . . . . . .
3.3.2. Quality standards . . . . . . . . . . . . . . . . . . . . . . . . . . . . .
3.3.3. Peak by peak fitting . . . . . . . . . . . . . . . . . . . . . . . . . . .
3.3.4. Whole pattern fitting . . . . . . . . . . . . . . . . . . . . . . . . . . .
3.3.4.1. Fitting with cell constraints . . . . . . . . . . . . . . . . . . . . .
3.3.4.2. Structural simulation: the Rietveld method. . . . . . . . . . . .
3.4. The resulting characteristic values . . . . . . . . . . . . . . . . . . . . .
3.4.1. Position . . . . . . . . . . . . . . . . . . . . . . . . . . . . . . . . . . .
3.4.2. Integrated intensity . . . . . . . . . . . . . . . . . . . . . . . . . . . .
3.4.3. Intensity distribution: peak profiles . . . . . . . . . . . . . . . . . .
.
.
.
.
.
.
.
.
.
.
129
130
130
131
131
133
135
138
138
138
.
.
.
.
.
.
.
.
.
.
143
144
145
147
147
147
150
151
152
153
Chapter 4. Interpreting the Results . . . . . . . . . . . . . . . . . . . . . . . . .
155
4.1. Phase identification . . . . . . . . . . . . . . . . . . . . . . . . . . .
4.2. Quantitative phase analysis . . . . . . . . . . . . . . . . . . . . . .
4.2.1. Experimental problems . . . . . . . . . . . . . . . . . . . . . .
4.2.1.1. Number of diffracting grains and preferential orientation
4.2.1.2. Differential absorption . . . . . . . . . . . . . . . . . . . . .
4.2.2. Methods for extracting the integrated intensity . . . . . . . .
4.2.2.1. Measurements based on peak by peak fitting . . . . . . .
4.2.2.2. Measurements based on the whole fitting of the diagram
4.2.3. Quantitative analysis procedures . . . . . . . . . . . . . . . . .
4.2.3.1. The direct method . . . . . . . . . . . . . . . . . . . . . . .
4.2.3.2. External control samples . . . . . . . . . . . . . . . . . . .
4.2.3.3. Internal control samples . . . . . . . . . . . . . . . . . . . .
.
.
.
.
.
.
.
.
.
.
.
.
.
.
.
.
.
.
.
.
.
.
.
.
.
.
.
.
.
.
.
.
.
.
.
.
.
.
.
.
.
.
.
.
.
.
.
.
155
158
158
158
161
162
162
163
165
165
166
166
viii
X-ray Diffraction by Polycrystalline Materials
4.3. Identification of the crystal system and refinement of the
cell parameters. . . . . . . . . . . . . . . . . . . . . . . . . . . . . . .
4.3.1. Identification of the crystal system: indexing . . . . . . .
4.3.2. Refinement of the cell parameters . . . . . . . . . . . . . .
4.4. Introduction to structural analysis. . . . . . . . . . . . . . . . .
4.4.1. General ideas and fundamental concepts . . . . . . . . . .
4.4.1.1. Relation between the integrated intensity and the
electron density . . . . . . . . . . . . . . . . . . . . . . . . . . . .
4.4.1.2. Structural analysis . . . . . . . . . . . . . . . . . . . . .
4.4.1.3. The Patterson function . . . . . . . . . . . . . . . . . . .
4.4.1.4. Two-dimensional representations of the electron
density distribution . . . . . . . . . . . . . . . . . . . . . . . . . .
4.4.2. Determining and refining structures based on diagrams
produced with polycrystalline samples . . . . . . . . . . . . . . .
4.4.2.1. Introduction . . . . . . . . . . . . . . . . . . . . . . . . .
4.4.2.2. Measuring the integrated intensities and establishing
a structural model. . . . . . . . . . . . . . . . . . . . . . . . . . .
4.4.2.3. Structure refinement: the Rietveld method . . . . . . .
.
.
.
.
.
.
.
.
.
.
.
.
.
.
.
.
.
.
.
.
.
.
.
.
.
.
.
.
.
.
167
167
171
172
173
. . . . . .
. . . . . .
. . . . . .
173
175
177
. . . . . .
180
. . . . . .
. . . . . .
183
183
. . . . . .
. . . . . .
184
185
Part 2. Microstructural Analysis . . . . . . . . . . . . . . . . . . . . . . . . . . .
195
Chapter 5. Scattering and Diffraction on Imperfect Crystals . . . . . . . . .
197
5.1. Punctual defects . . . . . . . . . . . . . . . . . . . . . . . . . . . . . . . .
5.1.1. Case of a crystal containing randomly placed vacancies causing
no relaxation . . . . . . . . . . . . . . . . . . . . . . . . . . . . . . . . . . .
5.1.2. Case of a crystal containing associated vacancies . . . . . . . . . .
5.1.3. Effects of atom position relaxations . . . . . . . . . . . . . . . . . .
5.2. Linear defects, dislocations . . . . . . . . . . . . . . . . . . . . . . . . .
5.2.1. Comments on the displacement term . . . . . . . . . . . . . . . . .
5.2.2. Comments on the contrast factor . . . . . . . . . . . . . . . . . . . .
5.2.3. Comments on the factor f(M) . . . . . . . . . . . . . . . . . . . . . .
5.3. Planar defects. . . . . . . . . . . . . . . . . . . . . . . . . . . . . . . . . .
5.4. Volume defects . . . . . . . . . . . . . . . . . . . . . . . . . . . . . . . .
5.4.1. Size of the crystals . . . . . . . . . . . . . . . . . . . . . . . . . . . .
5.4.2. Microstrains . . . . . . . . . . . . . . . . . . . . . . . . . . . . . . . .
5.4.3. Effects of the grain size and of the microstrains on the peak
profiles: Fourier analysis of the diffracted intensity distribution . . . . .
.
197
.
.
.
.
.
.
.
.
.
.
.
198
201
203
205
207
210
212
212
218
218
226
.
231
Chapter 6. Microstructural Study of Randomly Oriented
Polycrystalline Samples . . . . . . . . . . . . . . . . . . . . . . . . . . . . . . . .
235
6.1. Extracting the pure profile . . . . . . . . . . . . . . . . . . . . . . . . . . .
6.1.1. Methods based on deconvolution . . . . . . . . . . . . . . . . . . . .
236
237
Table of Contents
6.1.1.1. Constraint free deconvolution method: Stokes’ method . . . . .
6.1.1.2. Deconvolution by iteration . . . . . . . . . . . . . . . . . . . . . .
6.1.1.3. Stabilization methods . . . . . . . . . . . . . . . . . . . . . . . . .
6.1.1.4. The maximum entropy or likelihood method, and the
Bayesian method . . . . . . . . . . . . . . . . . . . . . . . . . . . . . . . . .
6.1.1.5. Methods based on a priori assumptions on the profile . . . . . .
6.1.2. Convolutive methods. . . . . . . . . . . . . . . . . . . . . . . . . . . .
6.2. Microstructural study using the integral breadth method . . . . . . . . .
6.2.1. The Williamson-Hall method . . . . . . . . . . . . . . . . . . . . . . .
6.2.2. The modified Williamson-Hall method and Voigt function fitting .
6.2.3. Study of size anisotropy . . . . . . . . . . . . . . . . . . . . . . . . . .
6.2.4. Measurement of stacking faults . . . . . . . . . . . . . . . . . . . . .
6.2.5. Measurements of integral breadths by whole pattern fitting . . . . .
6.3. Microstructural study by Fourier series analysis of the peak profiles . .
6.3.1. Direct analysis: the Bertaut-Warren-Averbach method . . . . . . .
6.3.2. Indirect Fourier analysis . . . . . . . . . . . . . . . . . . . . . . . . . .
6.4. Microstructural study based on the modeling of the diffraction
peak profiles . . . . . . . . . . . . . . . . . . . . . . . . . . . . . . . . . . . . . .
ix
238
242
244
244
245
246
247
248
250
252
255
257
262
262
268
270
Chapter 7. Microstructural Study of Thin Films . . . . . . . . . . . . . . . . .
275
7.1. Positioning and orienting the sample . . . . . . . . . . . . . . . . . .
7.2. Study of disoriented or textured polycrystalline films . . . . . . . .
7.2.1. Films comprised of randomly oriented crystals . . . . . . . . .
7.2.2. Studying textured films . . . . . . . . . . . . . . . . . . . . . . .
7.2.2.1. Determining the texture . . . . . . . . . . . . . . . . . . . . .
7.2.2.2. Quantification of the crystallographic orientation:
studying texture . . . . . . . . . . . . . . . . . . . . . . . . . . . . . . .
7.3. Studying epitaxial films . . . . . . . . . . . . . . . . . . . . . . . . .
7.3.1. Studying the crystallographic orientation and determining
epitaxy relations . . . . . . . . . . . . . . . . . . . . . . . . . . . . . . .
7.3.1.1. Measuring the normal orientation: rocking curves . . . . .
7.3.1.2. Measuring the in-plane orientation: φ-scan . . . . . . . . . .
7.3.2. Microstructural studies of epitaxial films . . . . . . . . . . . . .
7.3.2.1. Reciprocal space mapping and methodology. . . . . . . . .
7.3.2.2. Quantitative microstructural study by fitting the intensity
distributions with Voigt functions . . . . . . . . . . . . . . . . . . . .
7.3.2.3. Quantitative microstructural study by modeling of
one-dimensional intensity distributions . . . . . . . . . . . . . . . . .
.
.
.
.
.
276
279
279
285
285
. . .
. . .
289
292
.
.
.
.
.
.
.
.
.
.
292
293
295
300
304
. . .
307
. . .
312
Bibliography . . . . . . . . . . . . . . . . . . . . . . . . . . . . . . . . . . . . . . .
319
Index . . . . . . . . . . . . . . . . . . . . . . . . . . . . . . . . . . . . . . . . . . . .
349
.
.
.
.
.
.
.
.
.
.
.
.
.
.
.
This page intentionally left blank
Preface
In 1912, when M. Laue suggested to W. Friedrich and P. Knipping the
irradiation of a crystal with an X-ray beam in order to see if the interaction between
this beam and the internal atomic arrangement of the crystal could lead to
interferences, it was mainly meant to prove the undulatory character of this X-ray
discovered by W.C. Röntgen 17 years earlier. The experiment was a success, and in
1914 M. Laue received the Nobel Prize for Physics for the discovery of X-ray
diffraction by crystals. In 1916, this phenomenon was used for the first time to study
the structure of polycrystalline samples. Throughout the 20th century, X-ray
diffraction was, on the one hand, studied as a physical phenomenon and explained
in its kinematic approximation or in the more general context of the dynamic theory,
and on the other, implemented to study material that is mainly solid.
Obviously, the theoretical studies were initially conducted on single crystal
diffraction, but the needs for investigation methods from physicists, chemists,
material scientists and more recently from biologists have led to the development of
numerous works on X-ray diffraction with polycrystalline samples. Most of the
actual crystallized solid objects that we encounter every day are in fact
polycrystalline; each crystal is the size of a few microns or even just a few
nanometers. Polycrystalline diffraction sampling, which we will address here, is
actually one of the most widely used techniques to characterize the state of the
“hard” condensed matter, inorganic material, or “soft”, organic material, and
sometimes biological material. Polycrystalline samples can take different forms.
They can be single-phased or made up of the assembling of crystals of different
crystalline phases. The orientation of these crystals can be random or highly
textured, and can even be unique, in the case for example of epitactic layers. The
crystals can be almost perfect or on the contrary can contain a large number of
defects. X-ray diffraction on polycrystalline samples enables us to comprehend and
even to quantify these characteristics. However, the methods of measure must be
adapted. The quality of the quantitative result obtained greatly depends on the care
xii
X-ray Diffraction by Polycrystalline Materials
taken over this measure and in particular on the right choice of equipment and of the
data processing methods used.
This book is designed for graduate students, as well as engineers or active
researchers studying or working in a sector related to material sciences and who are
concerned with mastering the implementation of X-ray diffraction for the study of
polycrystalline materials.
The introduction recounts the history of the emphasis on X-ray diffraction by
crystals since the discovery of X-rays. The book is then divided into two parts. The
first part focuses on the description of the basic theoretical concepts, the
instrumentation and the presentation of traditional methods for data processing and
the interpretation of the results. The second part is devoted to a more specific
domain which is the quantitative study of the microstructure by X-ray diffraction.
The first part of the book is divided into four chapters. Chapter 1 focuses on the
description of the theoretical aspects of X-ray diffraction mainly presented as a
phenomenon of interference of scattered waves. The intensity diffracted by a crystal
is measured in the approximations of the kinematic theory. The result obtained is
then extended to polycrystalline samples. Chapter 2 is entirely dedicated to the
instrumental considerations. Several types of diffractometers are presently available;
they generally come from the imagined concepts from the first half of the 20th
century and are explained in different ways based on the development of the
sources, the detectors and the different optical elements such as for example the
monochromators. This chapter is particularly detailed; it takes the latest studies into
account, such as the current development of large dimension plan detectors. Modern
operation of the diffraction signal is done by a large use of calculation methods
relying on the computer development. In Chapter 3, we will present the different
methods of extracting from the signal the characteristic strength of the diffraction
peaks including the position of these peaks, their integrated intensity and the shape
or the width of the distribution of intensity. The traditional applications of X-ray
diffraction over polycrystalline samples are described in Chapter 4. The study of the
nature of the phases as well as the determination of the rate of each phase present in
the multiphased samples are presented in the first sections of this chapter. The
structural analysis is then addressed in a relatively condensed way as this technique
is explained in several other international books.
The second part of the book focuses on the quantitative study of the
microstructure. Although the studies in this area are very old, this quantitative
analysis method of microstructure by X-ray diffraction has continued to develop in
an important way during the last 20 years. The methods used depend on the form of
the sample. We will distinguish the study of polycrystalline samples as pulverulent
or massive for thin layers and in particular the thin epitactic layers. Chapter 5 is
Preface
xiii
dedicated to the theoretical description of the influence of structural flaws over the
diffusion and diffraction signal. The actual crystals contain a density of varying
punctual, linear, plan or three-dimensional defects. The presence of these defects
modifies the diffraction line form in particular and the distribution of the diffused or
diffracted intensity in general. The influence of these defects is explained in the
kinematic theory. These theoretical considerations are then applied in Chapter 6 to
the study of the microstructure of polycrystalline pulverulent or massive samples.
The different methods based on the analysis of the integral breadth of the lines or of
the Fourier series decomposition of the line profile are described in detail. Finally,
Chapter 7 focuses on the study of thin layers. Following the presentation of methods
of measuring the diffraction signal in random or textured polycrystalline layers, a
large part is dedicated to the study of the microstructure of epitactic layers. These
studies are based on bidimensional and sometimes three-dimensional, reciprocal
space mapping. This consists of measuring the distribution of the diffracted intensity
within the reciprocal lattice node that corresponds to the family of plans studied.
The links between this intensity distribution and the microstructure of epitactic
layers are presented in detail. The methods for measuring and treating data are then
explained
The book contains a large number of figures and results taken from international
literature. The most recent developments in the views discussed are presented. More
than 400 references will enable the interested reader to find out more about the
domains that concern them.
This page intentionally left blank
Acknowledgements
X-ray diffraction is a physical phenomenon as well as an experimental method
for the characterization of materials. This last point is at the heart of this book and
requires illustration with concrete examples from real experiments. The illustrations
found throughout this book are taken from international literature and are named
accordingly. Many of these examples are actually the result of studies conducted in
the last 15 years in Limoges in the Laboratoire de Science des Procédés Céramiques
et de Traitements de Surface. My profound thanks to the students, sometimes
becoming colleagues, who by the achievement of their studies have helped make
this book a reality. I would like to particularly acknowledge O. Masson and A.
Boulle in Limoges for their strong contribution to the development X-ray diffraction
on polycrystalline samples and epitactic layers respectively.
One of the goals of this book is to continually emphasize the link between the
measuring device, the way in which it is used and the interpretation of the measures
achieved. I am deeply convinced that in experimental science only a profound
knowledge of the equipment used and the underlying theories of the methods
implemented can result in an accurate interpretation of the experimental results
obtained. We must then consider the equipment that has helped us conduct the
experimental study as the centerpiece. Because of this conviction, I have put a lot of
emphasis on the part of this book that describes the measuring instruments. I learned
this approach from the experience of A. Dauger who has directed my thesis as well
as during the years following my research studies. He is the one who introduced in
Limoges the development of X-ray diffusion and diffraction instruments, and I
thank him for his continued encouragement in this methodology.
xvi
X-ray Diffraction by Polycrystalline Materials
Ever since the first edition written in French and published in 2002, several
colleagues have commented on the book. These critiques led me to completely redo
the structure of the book, in particular separating the conventional techniques from
the more advanced techniques linked to the study of microstructure. I would once
more like to thank A. Boulle, now a researcher at the CNRS and also M. Anne,
director of the Laboratoire de Cristallographie in Grenoble, whose comments and
encouragement have been very helpful.
An Historical Introduction: The Discovery
of X-rays and the First Studies
in X-ray Diffraction
X-rays and “cathode rays”: a very close pair
On November 8th, 1895, Röntgen discovered by accident a new kind of
radiation. While he was using a Crookes tube, he noticed a glow on a plate, covered
with barium platinocyanide, and rather far away from the tube. Röntgen, who was
working at the time on the cathode rays produced by Crookes tubes, immediately
understood that the glow he was observing could not be caused by this radiation.
Realizing the importance of his discovery, and before making it known to the
scientific community, he tried for seven weeks to determine the nature of this new
kind of radiation, which he named himself X-Strahlen. On December 28th, 1895,
Röntgen presented his observations before the Würzburg Royal Academy of Physics
and Medicine [RON 95]. His discovery was illustrated by the photographic
observation of the bones in his wife’s hand (see Figure 1). Röntgen inferred from
his experiments that the Crookes tube produced beams that propagated in straight
lines and could pass through solid matter [RON 95, RON 96a, RON 96b, RON
96c]. Very quickly, these “Röntgen rays” were used in the medical world to produce
radiographies [SWI 96].
Immediately after this discovery, a large number of studies were launched to
find out the nature of this radiation. Röntgen tried to find analogies between this
kind of radiation and visible light, which lead him to conduct unsuccessful
experiments that consisted of reflecting X-rays on quartz, or lime. He believed he
was observing this reflection on platinum, lead and zinc [RON 95, RON 96b]. He
noticed that X-rays, unlike electronic radiation, are not affected by magnetic fields.
Röntgen even tried, to no avail, to produce interference effects in X-rays by making
xviii
X-ray Diffraction by Polycrystalline Materials
the X-ray beam pass through holes [RON 95]. The analogy between X-rays and
visible light prompted researchers to study how X-rays behave with regard to the
well-known laws of optics. Thus, Thomson [THO 96], Imbert and Bertin-Sans [IMB
96], as well as Battelli and Garbasso [BAT 96], showed in 1896 that specular
reflection was not possible with X-rays, hence confirming the studies of Röntgen.
They also found, in agreement with the works of Sagnac [SAG 97a], that the
deviation of X-rays by refraction is either non-existent or extremely small.
Figure 1. The first radiographic observation
In November 1896, Stokes gave a short presentation before the Cambridge
Philosophical Society, explaining some of the fundamental properties of X-rays
[STO 96]. He claimed that X-rays, like γ-rays, are polarizable. This comment, made
in November, did not take into account several studies, even though they had been
published in February of the same year by Thompson [THO 96a], who established
the absence of polarization in X-rays by having them pass through oriented crystal
plates. The polarizable nature of X-rays was conclusively demonstrated in 1905 by
Barkla [BAR 05, BAR 06a]. Based on the absence of refraction for X-rays, Stokes
described this radiation as vibrations propagating through solid material between the
molecules of this material. Finally, by analyzing the absence of interference effects
for this radiation, he concluded that either the wavelength of this propagation was
too small or the phenomenon was not periodical. The author, who mistakenly
believed that the latter hypothesis was the right one, assumed that each “charged
An Historical Introduction
xix
molecule1” that hit the anode emitted a radiation, the pulsation of which was
independent of the pulsations of the radiations emitted by the other molecules.
Having demonstrated that X-rays are a secondary radiation caused by what was
referred to at the time as “cathode rays”, Röntgen showed that the study of the
nature of X-rays had close ties with the determination of the nature of electronic
radiation. After the discovery by Crookes of the existence of a radiation emitted by
the cathode and attracted by the anode, the question of the nature of these cathode
rays was the subject of intense activity. When X-rays were discovered, the two
theories clashed. Some considered that this cathode rays was caused by a process of
vibration taking place in the rarefied gas inside the tube (the “ether”) [LEN 94, LEN
95], while others thought that this current was the result of the propagation of
charged particles emitted by the cathode [PER 95, THO 97a].
In 1895, Perrin proved experimentally that the cathode rays carried an electric
charge and that this charge was negative [PER 95]. This view was the one supported
by Thomson [THO 97a, THO 97b], who published an article in 1897, considered to
be the major step in the discovery of the electron [THO 97b]. He noticed that these
cathode rays could be diverted by an electrical field. This observation led him to
demonstrate experimentally that this radiation was caused by the motion of charged
particles, for which he estimated the charge to mass ratio. He found that this ratio
e/m is independent of the nature of the gas inside the tube and established the
existence of “charged particles”, which are the basic building blocks of atoms [THO
97b].
This is how Thomson became interested in X-rays while studying electronic
radiation. In January 1896, he presented an analysis that could be described as the
“theoretical discovery of X-rays”. He used the Maxwell equations and included the
contribution from a convection current caused by the motion of charged particles.
He demonstrated analytically that these particles suddenly slowing down led to an
electromagnetic wave that propagated through the medium with an extremely low
wavelength [THO 96b]. The author himself noted that the properties of the radiation
discovered by Röntgen were not sufficiently well known to be able to say that the
electromagnetic waves he had found evidence of were, in fact, Röntgen radiation.
Two years later [THO 98a], Thomson was more assertive and concluded that the
radiation related to the sudden slowing down of charged particles – later referred to
as braking radiation – was a kind of X-ray radiation.
By analogy with the characteristics of electron radiation, many authors imagined
that X-rays also corresponded to the propagation of particles. This debate over the
particle or wave-like nature of electromagnetic radiation only comes to a close with
1 The concept of electron was only definitively accepted the following year.
xx
X-ray Diffraction by Polycrystalline Materials
the advent of quantum physics. This is why, after the studies of Thomson, several
authors compared the respective properties of X-rays and electrons [LEN 97, RIT
98, WAL 98]. Lenard [LEN 97] showed, on the one hand, that irradiating
photographic plates with X-rays caused a much weaker effect than what was
observed when the same plates were irradiated with an electron beam. On the other
hand, he showed that the two kinds of radiation had significantly different electric
properties. Ritter von Geitler [RIT 98] irradiated flat metal screens with X-rays in
order to find evidence of a possible charge carried by these particles. He did not
observe an electrical signal, but nonetheless he did not conclude that the particles
were not charged. In the same issue of the Annalen der Physik und Chemie, Walter
[WAL 98] was more assertive and considered that the particles associated with Xrays have no electric charge. Furthermore, given the high penetrating ability of Xrays, he refuted a theory, acknowledged at the time, according to which X-rays
could consist of the incident electrons that had lost their charge after hitting the
anode [VOS 97].
Thus, before the beginning of the 20th century, it was accepted as fact that Xrays were very different from the electronic radiation that created them. Scientists
also knew that they consist of particles that are not charged, since they are not
diverted in a magnetic field [STR 00]. The theoretical works of Thomson describe
the propagation of X-rays as that of a wave with a very small wavelength.
Furthermore, these X-rays do not seem to be reflected of refracted under conditions
that would generally be used to observe these effects with visible light. While some
authors were trying to discover the nature of X-rays, other authors were studying the
effects of having X-rays travel through gases.
In 1896, Thomson and Rutherford [RUT 97, THO 96c] showed that irradiating a
gas with an X-ray beam created an electrical current inside this gas. They showed
that the intensity of this current depends, on the one hand, on the voltage applied to
the two terminals of the chamber containing a gas, and on the other hand, on the
nature of this gas. Rutherford [RUT 97] also observed that the decrease in the X-ray
beam’s intensity due to the absorption by the gas follows an exponential law which
depends on a coefficient specific to each gas. From these findings, Rutherford
measured the linear absorption coefficient of several gases and found a correlation
between this coefficient and the intensity of the electrical current, produced by the
interaction between this gas and the X-rays. In a commentary on Rutherford’s
article, Thomson [THO 97c] observed that his colleague’s findings were evidence of
a strong analogy between X-rays and visible light, and that they were likely to be
electromagnetic waves or pulses. He also attributed the decrease in the intensity of
the X-ray beam, observed by Rutherford, to the production of ions from the gas
molecules, with each ionization leading to a small decrease in the beam’s intensity.
An Historical Introduction
xxi
Based on these first accomplishments, the ionization of gases was used to study
the nature of the particles created from the interaction between the X-rays and the
gas. By using a cloud chamber designed in 1897 by Wilson [WIL 97], Thomson
[THO 98b] used the ionization of gases by X-rays to measure the electric charge of
the electrons2 created by the X-rays traveling through the gas. By measuring the
electrical current produced by the ionization of various polyatomic gases, the same
author showed that the electrons correspond to a modification of the atoms
themselves, rather than to the simple dissociation of gas molecules [THO 98c]. This
result was confirmed by Rutherford and McClung [RUT 00], who measured, in
1900, the energy required for the ionization of certain gases. This is how they
showed that an electron accounts for a very small part of the mass in an atom.
We mentioned above that, at the dawn of the 20th century, the nature of X-rays
was already well known. Evidence of gas ionization by X-rays quickly led to the
creation of devices designed to quantitatively measure the intensity of X-ray beams.
This enabled researchers at the beginning of the last century to study in detail the
interaction between X-rays and solid matter, leading, naturally, to the observation
and quantitative analysis of scattering, and then diffraction, of X-rays.
Scattering, fluorescence and the early days of X-ray diffraction
Scattering and fluorescence
In 1897, Sagnac [SAG 97a, SAG 97b] observed that, by irradiating a metal
mirror with an X-ray beam, the mirror would produce a radiation of the same nature
as the incident beam, but much less intense. This radiation propagates in every
direction and therefore cannot involve specular reflection. Sagnac noted that the
intensity of this scattered radiation depends on the nature of the material irradiated
with the primary X-ray beam [SAG 97b, SAG 99]. These experiments were
confirmed by Townsend [TOW 99], who quantitatively measured the intensity of
the scattered beams by using an ionization detector. Townsend observed that if the
scattered beams, before reaching the detector, pass through a sheet of aluminum,
then the residual intensity significantly depends on the nature of the scattering
material. Unfortunately, he did not specify the chemical nature of the anticathode he
was using to produce the primary X-rays, thus making it difficult to make the
connection between this observation and a selective absorption effect.
2 In the paper in question, Thomson and other authors use the word “ion”, but are actually
writing about electrons created by the X-ray-induced ionization. In this case, the word ion is
merely the present participle of the Greek verb ienai. Therefore, ion means going, and refers
to particles in motion.
xxii
X-ray Diffraction by Polycrystalline Materials
As we have mentioned already, Thomson showed that when a charged particle
slows down, it causes the emission of electromagnetic radiation [THO 96b, THO
98a]. Based on these considerations, the same author found a simple explanation to
the scattering effect observed by Sagnac. By assuming that the atoms contain
charged particles, irradiating these atoms with an electromagnetic wave (the X-rays)
would disturb the trajectory of these particles and modify their speed. This
explained the subsequent emission of secondary X-rays [THO 98d]. Starting with
this simple demonstration, Thomson calculated the intensity of the beam scattered
during the interaction between an electron and an X-ray beam. This calculation led
him to the now famous Thomson formula, which gives the scattering power of an
electron. Once these preliminary results had been achieved, several authors, between
1900 and 1912, characterized in detail this secondary emission phenomenon, which
would later come to be called scattering.
In 1906, Thomson [THO 06a, THO 06b] showed that the intensity of the
scattered beam increases with the atomic mass of the scattering elements. He
measured the intensity of the scattered beams by using a crude ionization detector,
in which the ionized gas is the air located between the surface of the sample,
consisting of a flat plate or a powder, and a metal grating placed a few millimeters
away from that surface. He managed, nevertheless, to establish a direct link between
the atomic mass of over 30 elements of the periodic table and the intensity scattered
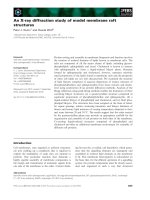
by these elements [THO 06b]. Also, he noticed that the scattered intensity increases
with the atomic number, but this relation is not strictly linear: there are gaps in the
intensity (see Figure 2). Thomson noted that the position and the amplitude of these
intensity gaps directly depend on the nature (hard or soft) of the X-rays used.
These discontinuities in the emitted intensity were studied from a more general
perspective by Barkla and Sadler [BAR 06b, BAR 08a, BAR 08b, BAR 08c, SAD
09]. These two authors presented a combined analysis of secondary emission and
absorption of X-rays by solid matter. The characteristics of the scattered radiation
were investigated by measuring their intensities after absorption by a sheet of
aluminum with a known thickness. Barkla showed by this way that there are sharp
discontinuities in the graphs showing the emitted intensity or the absorption
coefficient plotted according to the atomic number of the irradiated material, located
in the same places [BAR 08c]. The positions of these discontinuities do not depend
on the intensity of the primary beam, but only on its “hardness3” [BAR 08a]. This
author makes a distinction between two effects involving the secondary beams
emitted by the irradiated substances: he observes, as Thomson did, the presence of a
diffuse signal with characteristics similar to the incident beam, and also a more
intense signal with characteristics specific to the nature of the irradiated element.
Barkla adds that this emission of X radiation involves the ejection of electrons from
3 The words energy and wavelength were not yet used at the time.
An Historical Introduction
xxiii
the atoms irradiated by the primary beam. This ejection disturbs the atoms and
results in the emission of an electromagnetic wave specific to the atom in question
[BAR 08b]. The works of Barkla, which were quickly confirmed by the results of
other authors [CHA 11, GLA 10, WHI 11], constituted the first evidence of X-ray
fluorescence, whose developments in elementary analysis are still known today.
Figure 2. Evolution of the scattered intensity according to the atomic masses
of the scattering atoms (Thomson, 1906 [THO 06b])
All of these studies led by Thomson, Barkla and Sadler, involving the secondary
radiation emitted by solids irradiated with X-ray beams, were consistent with the
results of Thomson described above, and tend to show that this secondary emission
is the result of an interaction between the electrons of the atoms and the
electromagnetic wave, associated by Thomson and Barkla with the X-rays. This
wave description was disputed by Bragg [BRA 07, BRA 11], who considered that,
if X-rays are “energy bundles” concentrated in extremely small volumes, as
Thomson claimed, then they should be diverted when they travel through the atoms.
The concept developed by Thomson leads to the assumption that the radiation
scattered by the irradiated atoms is isotropic and, in particular, independent of the
incident beam’s direction of propagation. This is why Bragg focused on
experimentally proving that the intensity distribution of secondary X-rays is not
isotropic [BRA 07, BRA 09]. Barkla refuted Bragg’s arguments in favor of a
particle-based description of X-rays, by showing that it would be very difficult
otherwise to account for the polarizable nature of X-rays [BRA 08a]. He added that
wave theory can account for a certain anisotropy in the distribution of the scattered
intensity, since the intensity would be higher in the incident beam’s direction of
xxiv
X-ray Diffraction by Polycrystalline Materials
propagation than it would in the perpendicular direction. This argument did not
convince Bragg and Glasson, who showed that the intensity of radiation that has
traveled through a thin plate of scattering material is greater than that measured on
the side of the incident beam [BRA 09].
Crowther presented a series of articles on how to experimentally determine the
shape of the intensity distributions for the secondary X-rays emitted by thin plates
irradiated with primary X-rays [CRO 10, CRO 11a, CRO 11b, CRO 12a, CRO 12b].
This way, and in agreement with Bragg, he showed that the intensity of the
secondary radiation is much greater on the side opposite to the surface irradiated by
the incident beam. Crowther notes [CRO 12a], however, that this is not enough to
settle on the nature of X-rays with regard to the wave theory or the particle theory.
This led him to think that a second phenomenon occurs on top of classical
scattering, corresponding, for example, to the emission of X-rays, associated with
the emission of electrons inside the materials irradiated by the primary X-ray beam.
This interpretation was in perfect agreement with the works of Barkla and Sadler
[BAR 08b] who, as we have mentioned before, were the first to observe X-ray
fluorescence. Therefore, in the end, the anisotropic shape of the secondary X
radiation’s intensity distribution was interpreted as the result of a combination of
two different types of emission: scattering and fluorescence [BAR 11].
X-ray diffraction by a slit
While some were studying the nature of secondary X-ray emission, other
authors, Germans mostly, conducted experiments in order to observe X-ray
diffraction by very thin slits. Given the fact that X-rays are similar to visible light,
and due to their high penetrating ability, which means that their wavelengths must
be very small, these authors surmised that they would be able to observe Fresnel
diffraction by placing a slit as thin as possible on the path of an X-ray beam as
punctual as possible. There were two goals to these studies, which were initiated by
Fomm [FOM 96]. They consisted, on the one hand, of demonstrating that X-rays are
waves and, on the other hand, of measuring their wavelength.
Wind and Haga [HAG 99, HAG 03, WIN 99, WIN 01] thus presented their first
observations of Fresnel fringes obtained with X-rays. By measuring the space
between these fringes, they were able to quantitatively estimate the wavelength of
X-rays. The value they found was in the range of one angström. The results of these
studies were disputed by Walter and Pohl [WAL 02, WAL 08, WAL 09]. They
examined the works of their colleagues and conducted new experiments, by using
slits a few micrometers wide placed, roughly one meter away from the photographic
plate. They did not observe any fringes in the photographs they obtained and
concluded that the diffraction effect did not occur. By considering, however, that the