Prob ch5 TÍN HIỆU VÀ HỆ THỐNG
Bạn đang xem bản rút gọn của tài liệu. Xem và tải ngay bản đầy đủ của tài liệu tại đây (100.85 KB, 5 trang )
Ch-5: Sampling
P5.1. A real-valued signal f(t) is known to be uniquely determined
by its samples when the sampling frequency is ωs=104π. For what
values of ω is F(ω) guaranteed to be zero?
P5.2. A continuous-time signal f(t) is obtained at the output of an
ideal low-pass filter with cutoff frequency ωc=1000π. If impulsetrain sampling is performed on f(t), which of the following
sampling period would guarantee the f(t) can be recovered from its
sampled version using an appropriate low-pass filter?
a) T=5.10-4 ; b) T=2.10-3 ; c) T=10-4
Signal & Systems - FEEE, HCMUT – Semester: 02/10-11
Ch-5: Sampling
P5.3. The frequency which, under the sampling theorem, must
exceeded by the sampling frequency is called the Nyquist rate.
Determine the Nyquist rate corresponding to each the following
signals:
sin(4000π t)
a) f(t)=1+cos(2000π t)+sin(4000π t) b) f(t)=
πt
2
sin(4000π t)
c) f(t)=
πt
P5.4. Let f(t) be a signal with Nyquist rate ω0. Also let y(t)=f(t)p(t-1)
+∞
Where p(t)= ∑ δ(t-nT) and T< 2ωπ0
n=-∞
Specify the constraints on the magnitude and phase of the
frequency response of a filter that gives f(t) as its output when y(t)
is the input.
Signal & Systems - FEEE, HCMUT – Semester: 02/10-11
1
Ch-5: Sampling
P5.5. A signal f(t) undergoes a zero-order hold operation with an
effective sampling period T to produce a signal f0(t). Let f1(t)
denote the result of a first-order hold operation on the samples of
f(t); i.e,..
+∞
f1 (t)= ∑ f(nT)h1 (t-nT)
n=-∞
Where h1(t) is the function shown in Fig.P5.5. Specify the
frequency response of a filter that produce f1(t) as its output when
f0(t) is the input
h1 (t)
Fig.P5.5
t
Signal & Systems - FEEE, HCMUT – Semester: 02/10-11
Ch-5: Sampling
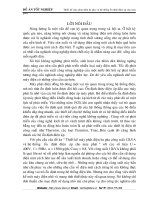
P5.6. Shown in Fig.P5.6 ia a system in which the sampling signal is
impulse train with alternating sign. The Fourier transform of the
input signal is indicated in the figure.
a) For ∆<π/(2ωM), sketch the Fourier transform of fp(t) and y(t)
b) For ∆<π/(2ωM), determine a system that will recover f(t) from
fp(t)
c) For ∆<π/(2ωM), determine a system that will recover f(t) from
y(t)
d) What is the maximum value of ∆ in relation to ωM for which f(t)
can be recovered from either fp(t) or y(t)
Signal & Systems - FEEE, HCMUT – Semester: 02/10-11
2
Ch-5: Sampling
p(t)
f(t)
p(t)
f p (t)
H(ω )
F(ω )
y(t)
H(ω )
Fig.P5.6
P5.7. The sampling theorem, as we have derived it, states that a
signal f(t) must be sampled at a rate greater than its bandwidth (or
equivalently, a rate greater than twice its highest frequency). This
implies that if f(t) has a spectrum as indicated in Fig.P7.7a then f(t)
must be sampled at rate greater than 2ω2. However, since the signal
has most of it energy concentrated in a narrow band, it would seem
Signal & Systems - FEEE, HCMUT – Semester: 02/10-11
Ch-5: Sampling
reasonable to expect that a sampling rate lower than twice the
highest frequency could be used. A signal whose energy is
concentrated in a frequency band is often referred to as a band pass
signal. There are a variety of techniques for sampling such signals,
generally reffered to as bandpass-sampling techniques.
To examine the possibility of sampling a bandpass signal as a rate
less than te total bandwidth, consider the system shown in
Fig.P5.7b. Assuming that ω1>ω2-ω1, find the maximum value of T
and the value of the constants A, ωa, and ωb such that fr(t)=f(t).
F(ω )
p(t)
f(t)
Fig.P5.7a
f p (t)
H(ω )
f r (t)
Fig.P5.7b
Signal & Systems - FEEE, HCMUT – Semester: 02/10-11
3
Ch-5: Sampling
H(ω )
p(t)
Fig.P5.7b
P5.8. In P5.7, we considered on procedure for bandpass sampling
and reconstruction. Another procedure, used when f(t) is real,
consists of multiplying f(t) by a complex-exponential and then
sampling the product. The sampling system is shown in Fig.P.5.8a.
With f(t) real and F(ω) nonzero only for ω1<|ω|<ω2, the frequency
is chosen to be ω0=1/2(ω1+ω2), and the lowpass filter H1(ω) has
cutoff frequency1/2(ω2-ω1).
a) For F(ω) as shown in Figure P.5.8b, sketch Fp(ω)
Signal & Systems - FEEE, HCMUT – Semester: 02/10-11
Ch-5: Sampling
b) Determine the maximum sampling period T such that f(t) is
recoverable from fp(t)
c) Determine a system to recover f(t) from fp(t)
f(t)
f p (t)
(a)
+∞
p(t)= ∑ δ(t-nT)
n=-∞
F(ω )
(b)
Fig.P5.8
Signal & Systems - FEEE, HCMUT – Semester: 02/10-11
4
Ch-5: Sampling
P5.9. A signal f(t)=sinc(200πt) is sampled by a periodic pulse train
pT(t) resented in Fig.P5.9. Find and sketch the spectrum of the
sampled signal. Explain if you will be able to reconstruct f(t) from
these samples. If the sampled signal is passed through an ideal
lowpass filter of bandwidth 100Hz and unit gain, find the filter
ouput. What is the filter output if its bandwidth is B Hz, where
100
Fig.P5.9
Signal & Systems - FEEE, HCMUT – Semester: 02/10-11
Ch-5: Sampling
P5.10. Fig.P5.10 shown the so called flat top sampling of the signal
f(t)=5sinc2(5πt).
a) Show that the signal f(t) can be recovered from flat top samples
if the sampling rate is no less than the Nyquist rate.
b) Explain how you would recovered from flat top samples
−
c) Find the expression for the sampled signal spectrum F(ω ) and
sketch it roughly.
Fig.P5.10
Signal & Systems - FEEE, HCMUT – Semester: 02/10-11
5