Báo cáo khoa học Epidemiology of EMS/AHPNS based on September 2012 cross sectional studies 2013
Bạn đang xem bản rút gọn của tài liệu. Xem và tải ngay bản đầy đủ của tài liệu tại đây (993.06 KB, 29 trang )
Epidemiology of EMS/AHPNS
based on September 2012 cross
sectional studies
Assist. Prof. Visanu Boonyawiwat
Department of Farm resources and
Production medicine
Faculty of Veterinary Medicine
Kasetsart University, Thailand
Topic of the presentation
• Set up the list of candidate risk factors
• Study design and survey
• Data analysis
– Farm level information
– Pond level information
– Water quality and environmental parameter
• Compare the results to the other study
• Renew the causal web
• Conclusion and future study
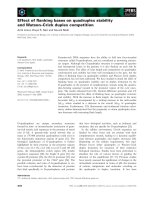
Possible risk factors of AHPNS (EMS)
Case definition (EMS)
• Pond level
- Accumulative mortality: >40% within 5-7 days
- Ages: <35 days DOC
- Gross sign: significant atrophy (shrinkage) of the HP
• Farm level
– At least a pond (any crop) in that farm affected by
EMS (since 1 January 2012 to the date of doing the
questionnaire)
Study design and survey
Survey data
• Questionnaire
• Part 1: General respondent (farmer)
information
• Part 2. General farm information*
• Part 3. General pond information*
• Part 4. Water quality parameters*
• Part 5. Health history and health status
• Part 6. Other information
Sample size required and
Questionnaires complete
province district
Total
farm
Total
pond
Total farm Total pond
Soc Trang
Vinh
Chau 309 618
289 (93.5%) 466 (75.4%)
Soc Trang Tran De 316 632
323 (102%) 387 (61.2%)
Bac Lieu Hoa Binh 332 664
305 (91.9%) 586 (88.3%)
Ca Mau
Dam Doi 297 594
278 (93.6%) 481 (81%)
Grand total
1254 2508
1195 (95.3%) 1920 (76.6%)
Calculate by survey toolbox software program
Farm level data
• Descriptive data analysis
Factors N missing mean SD range
totpond 1195 22 3.35 5.06 1, 134
totarea 1195 24 1.47 3.79 0.1, 120
researea 1195 25 0.19 0.40 0, 7
resVScul 1195 27 0.19 0.48 0, 7.8125
dryperoid 1195 440 26.02 19.23 0, 150
holdlong 1195 96 10.90 10.05 0, 60
fstorlong 1195 135 7.31 3.38 1, 30
nearfmdis 1195 486 0.29 0. 83 0, 10
Factors N missing 0 (absent) 1 (present)
respond 1195 21 512 662
cleanond 1195 22 7 1166
flushsedi 1195 22 537 636
remosedi 1195 22 470 703
drysedi 1195 22 86 1087
plougsedi 1195 22 1098 75
limsedi 1195 22 0 1064
carritreat 1195 0 12 1183
filtcari 1195 27 77 1091
inseccari 1195 45 1073 77
sapocari 1195 45 607 543
chlocari 1195 45 607 543
othercari 1195 49 950 196
probiotic 1195 48 865 282
treawater 1195 81 150 964
treahold 1195 84 221 890
treachlo 1195 85 733 377
treaother 1195 87 978 130
emsfarm 1195 209 212 774 (78.5%)
nearfmaf 1195 155 268 772
Factors N missing category number percent
bottomt 1195 29 1 1126 96.57
2 33 2.83
3 7 0.60
souwater 1195 21 1 5 0.43
2 472 40.20
3 622 52.98
4 5 0.43
5 24 2.04
6 45 3.83
7 1 0.09
manwater 1195 28 1 142 12.17
2 616 52.78
3 348 29.82
4 16 1.37
5 3 0.26
6 1 0.09
7 5 0.43
8 13 1.11
9 13 1.11
10 10 0.86
supdrain
1195
57
1
828
72.76
monotype 1195 133 1 389 36.63
2 536 50.47
3 137 12.90
vanatype 1195 1009 1 170 91.40
2 16 8.6
culspecie 1195 1 1 981 82.16
2 103 8.63
3 110 9.21
feedstore 1195 63 1 54 4.77
2 31 2.74
3 1047 92.49
feedmana 1195 36 1 522 45.04
2 1 0.09
3 10 0.86
4 623 53.75
5 0 0
6 3 0.26
feedtype 1195 42 1 1153 100
2 0 0
Logistic
regression
(Univariate
analysis)
Factors Odds ratio P-value
totarea 1.222 0.004
resVScul 0.749 0.033
brackish 2.048 0.000
seawater 0.441 0.000
closesys 0.511 0.000
semisys 2.034 0.000
supdrain 1.641 0.011
remosedi 1.530 0.006
drysedi 2.339 0.002
chlocari 0.738 0.051
treawater 0.516 0.013
treahold 0.528 0.004
holdlong 0.983 0.026
feedmana 0.793 0.000
nearfmaf 4.537 0.000
Note: Odds
ratio >1 = risk ,
<1 =protective
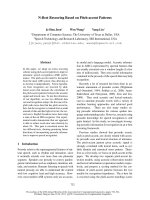
How is optimum reservoir to culture area ratio?
How long we should hold water before using?
How drying pond effect to EMS outbreak?
Pond level data
Factors N missing mean SD range
pondsize 1920 25 0.44 0.35 0.05, 3.5
ponddept 1920 62 1.33 0.21 0.64, 2.5
plage 1920 122 12.93 1.95 2, 20
plstockd 1920 48 28.03 25.12 3, 220
totfeed 1920 208 104.79 107.81 6, 1080
Factors N missing 0 (absent) 1 (present)
fertiuse 1920 51 1232 637
wildani 1920 48 1373 499
crab 1920 54 1587 279
finfish 1920 58 1720 142
wildshrim 1920 57 1724 139
emspond 1920 44 672 1204
obsplank 1920 40 1590 290
chemiwater 1920 58 237 1625
mineral 1920 247 118 1555
disinfect 1920 289 647 984
algicide 1920 341 1188 391
pesticide 1920 359 1521 40
antibiotic 1920 342 1138 440
probiotic 1920 308 462 1150
otwaterman 1920 382 1460 78
watreat 1920 331 1553 36
aerator 1920 109 185 1626
abclima 1920 374 722 824
Factors N missing category number percent
fertitype 1920 72 0 1233 66.70
1 564 30.54
2 37 2.00
3 14 0.76
shspecie 1920 46 1
2
242 12.91
1632 87.09
plprovin 1920 101 From 13 different province using at
frequency of 2 – 1,054 ponds
plhatch 1920 554 From 222 different hatchery using at
frequency of 1 – 173 ponds
otheranic 1920 70 0 1681
1 119
2 38
3 12
waexch 1920 0 0 1828
1 41
2 51
Logistic
regression
(Univariate
analysis)
Factors No. obs Odds ratio P-value
General pond background
pondsize 1867 2.99 0.000
ponddept 1834 0.09 0.000
Shrimp species and postlarvae
shspecie 1847 2.16 0.000
plprovin 1794 1.15 0.000
plhatch 1344 0.997 0.000
plstockd 1847 0.989 0.000
Carrier
wildani 1854 0.91 0.393
Plankton
obsplank 1856 0.814 0.123
Logistic
regression
(Univariate
analysis)
Factors No. obs Odds ratio P-value
chemical treatment water during culture
chemiwater 1837 1.331104 0.045
mineral 1640 1.464043 0.048
algicide 1556 1.292 0.040
probiotic 1588 0.5071901 0.000
Water and feed management
waexch 1876 0.7306535 0.019
totfeed 1697 0.9980876 0.000
aerator 1788 0.4109327 0.000
Environmental (weather)
abclima 1534 2.098487 0.000
How is pond dept. effect to EMS
outbreak?
Factors N missing mean SD range
morntemp 1920 1847 27.51 2.21 20, 32
aftertemp 1920 1844 30.14 1.72 26, 35
mornph 1920 1113 7.68 0.34 6.5, 9
afterph 1920 1207 8.09 0.40 6.5, 9
morndo 1920 1902 4.01 2.65 0, 8
afterdo 1920 1905 4.9 3.10 0, 8
salinity 1920 1466 15.10 7.44 0, 35
ammonia 1920 1918 0.26 0.35 0.1, 0.5
nitrite 1920 1918 0.001 0 0.001
h2s 1920 1918 0.105 0.134 0.01, 0.2
alk 1920 1467 111.38 24.46 12, 400
turbid 1920 1713 30.75 8.49 10, 65
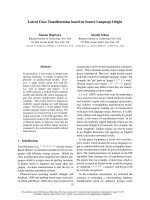
Compare with other study
(refer Presentations by Dr Flavio Corsin and Dr Matthew Briggs)
Factors
FAO
(TCDC)
CMC-AH
2011
DOF/KU
(Thailand)
Use chlorine for
pond preparation
Nearby farm had
EMS
Farm and pondsize
Source of PL
PL stock density
Total feed at 30
DOC or until EMS
EMS
pathogen
PL
Water
contamination
Feed and Feeding
management
Management for
prevention?
Trigger
factors ?
New causal web