Practical elliott wave trading strategies
Bạn đang xem bản rút gọn của tài liệu. Xem và tải ngay bản đầy đủ của tài liệu tại đây (329.62 KB, 47 trang )
Practical Elliott Wave Trading Strategies
A Special Tutorial Series For Subscribers To The Dynamic Trader Reports
Practical Elliott Wave Trading Strategies
Part 1
Robert Miner, Dynamic Traders Group, Inc.
This tutorial begins a series of how to apply Elliott wave analysis for
practical trading strategies. All subscribers have some Elliott wave
background from my Dynamic Trading book. Because that book goes
through the pattern structures in detail, there is no need to repeat that
information in this tutorial series.
It is assumed for this series, that subscribers are familiar with Chapter
3 of Dynamic Trading and how the most frequent pattern subdivide.
Besides teaching you the practical application of Elliott wave trading
strategies, an objective of this series will also be to dispel some Elliott
wave myths and bad practices fostered by Elliott wave academics.
Everything taught in this tutorial series will apply to any actively traded
market included futures, stocks, indexes and mutual funds and any time
frame whether five-minute or monthly.
What You Should Know Before Beginning This Tutorial Series
From your study of Elliott wave in Chapter 3 of Dynamic Trading, you
should be familiar with these concepts.
Impulse Trend – Usually unfolds in five-waves. Five-wave impulse
trends are usually made in the direction of the larger degree trend.
Counter-Trend – Usually unfolds in three-waves. A counter-trend is a
correction to the prior impulse trend.
Waves of Similar Degree – Also called swings of similar degree.
Waves of similar degree represent the subdivisions that make up a
completed structure. In an impulse trend, waves one-five are the waves of
similar degree. The subdivisions of each wave are waves of a smaller
degree.
Subdivisions of a Wave – Any given wave may subdivide into smaller
degree waves to complete the structure of the wave. For instance, Wave-1
of a five-wave impulse trend usually subdivides into five waves of lesser
Copyright 2002, Dynamic Traders Group, Inc. – www.DynamicTraders.com
Practical Elliott Wave Trading Strategies
A Special Tutorial Series For Subscribers To The Dynamic Trader Reports
degree. You should be familiar with how each wave of a trend or countertrend usually subdivides.
Multiple Time Frames - Multiple Time Frames has become a buzzphrase recently. It is nothing more than R.N. Elliott’s approach to
considering multiple degrees of wave structure. When the subdivisions of
a wave are complete, the larger degree wave is compelte.
Trend or Counter-Trend?
What is Elliott Wave Analysis?
Elliott’s Wave Principle is a catalogue of defined chart patterns. These
patterns are helpful to indicate if the market is in a trend or counter-trend.
Knowing the trend or counter-trend position, we also know the main trend
direction. Each pattern has implications regarding the position of the
market and the most likely outcome of the current position.
Most pattern positions will have an outcome that will validate or
invalidate the assumed pattern position. This is extremely important. It
also helps us to determine the maximum distance away from the market to
place the protective stop-loss.
Elliott Wave Pattern Basics – 5’s and 3’s
The basis of Elliott’s Wave Principle is that most trends unfold in five
waves in the direction of the trend and three waves or combinations of
three waves in the direction counter to the main trend. It’s that simple.
Markets usually unfold in three’s and five’s. Five wave patterns are
impulsive or trend structures. Three wave patterns are corrective or
counter-trend structures.
A five-wave impulse trend and three wave or more complex countertrend each has a characteristic structure which we will talk about
continually throughout this tutorial series. One important objective of Elliott
wave analysis is to recognize in the early stages of the wave structure
whether it is more likely to be an impulse or a counter-trend.
Copyright 2002, Dynamic Traders Group, Inc. – www.DynamicTraders.com
Practical Elliott Wave Trading Strategies
A Special Tutorial Series For Subscribers To The Dynamic Trader Reports
The Three Elliott Wave Rules
These three rules are most relevant to daily closing data.
1. Wave-2 should not exceed the beginning of Wave-1. In other
words, Wave-2 should not make greater than a 100%
retracement of Wave-1.
2. Wave-3 should not be the shortest of the three impulse
waves in a five-wave impulse trend (waves 1, 3 and 5).
3. Wave-4 should not make a daily close into the closing range
of the Wave-1.
These rules are extremely helpful to confirm or invalidate a potential
pattern. Even when using intraday data, be aware of the pattern and
guidelines relative to the daily closing data.
Why is pattern analysis an important part of the Dynamic Trading
approach to technical analysis?
1. Pattern analysis helps us to determine if a market is in a trend or
counter-trend.
2. Pattern analysis helps us to determine the position of the market
within a trend or counter-trend.
3. Pattern analysis helps us to project the time and price objectives of the
current trend or counter-trend.
Think Pattern
Below we will go through several pattern examples. The objective is to
learn to think in terms of pattern position and what a market must do to
confirm or invalidate a particular pattern structure. Every potential pattern
position cannot be illustrated, but if you keep the basic pattern concepts
and guidelines in mind, you will be able to identify the potential pattern
position for most market situations.
Here is a quick review of what we are trying to accomplish with pattern
analysis.
Copyright 2002, Dynamic Traders Group, Inc. – www.DynamicTraders.com
Practical Elliott Wave Trading Strategies
A Special Tutorial Series For Subscribers To The Dynamic Trader Reports
The Three Pattern Questions
1. What is the most probable pattern position? Why? The answer to
this question may only be “impulsive” or “corrective.” The answer
may also be, “don’t know.”
2. What market activity will confirm the assumed pattern position?
What is the pattern guideline that is relevant?
3. What market activity will invalidate the assumed pattern position?
What is the pattern guideline that is relevant?
The Three Important Pattern Considerations
1. Be quick to admit when there is no discernable or relevant
pattern! Do not force an Elliott Wave count when there is no
count that meets the guidelines or a clearly defined five or three
wave structure.
2. If there is no discernable wave count, does the pattern appear
to be in an impulse or corrective structure?
3. As new data is made, the market will continually confirm or
invalidate the pattern position assumption. Trade the market,
not the forecast. Be quick to change your assumption of the
pattern position if the market activity invalidates the current
assumption.
Continued on the next page.
Copyright 2002, Dynamic Traders Group, Inc. – www.DynamicTraders.com
Practical Elliott Wave Trading Strategies
A Special Tutorial Series For Subscribers To The Dynamic Trader Reports
What’s Next?
If a five-wave trend is complete as shown below, what is the minimum
pattern we should expect?
Regardless of how this five-wave pattern fits into the larger degree
pattern position, at least a three wave decline should be expected. The
minimum expectation is for a three-wave ABC correction. This may not
unfold but if pattern is to be useful, we must begun with a high-probability
assumption and let the market confirm or invalidate that assumption.
If this five-wave trend completed a larger degree five-wave trend, a
five-wave decline may follow but the minimum expectation would still be a
three-wave.
We always assume a correction will be a three-wave, ABC even
though it may take many shapes.
Copyright 2002, Dynamic Traders Group, Inc. – www.DynamicTraders.com
Practical Elliott Wave Trading Strategies
A Special Tutorial Series For Subscribers To The Dynamic Trader Reports
Trend or Counter-Trend?
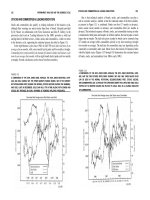
What should we anticipate after the low in mid-March below – a countertrend rally or an impulse trend eventually to a new high?
There is not enough data to give a high-probability answer. The decline
shown above is clearly an impulse trend. The position of that impulse
trend within the larger degree trend will help determine what next to
expect.
If the decline is a W.1, A or 3, we would expect a counter-trend rally
(W.2 or B or 4) followed by the continuation of the bear trend to a new low.
If the decline is a W.C, we would expect a continuation of the bull trend
to a new high.
If the decline is a W.5, we would expect a larger degree counter-trend
rally. The first rally would typically subdivide into five-waves since a W.A is
typically five-waves.
Whether the rally is a trend or a counter-trend, we would anticipate at
least a three-wave rally (ABC or 123). The position within the larger
degree trend will help to determine what to ultimately expect.
Copyright 2002, Dynamic Traders Group, Inc. – www.DynamicTraders.com
Practical Elliott Wave Trading Strategies
A Special Tutorial Series For Subscribers To The Dynamic Trader Reports
Count Backwards
What’s the pattern of this advance? It definitely doesn’t fit a typical five or
three wave pattern. To help determine what a pattern may be, it is helpful
to have a firm idea of what is the pattern position of the last major pivot.
If the low in March is a Wave 1 or A, then the rally should be a
correction. We initially assume any correction is going to be an ABC until
proven otherwise. This data is up through the date of this tutorial.
Nowhere along the way of this correction did it unfold as a typical ABC.
Just today, bonds declined below the prior swing low which signaled
the impulsive part of the rally from the late March low (labeled W.B) should
be a completed pattern structure, probably a Wave-C that subdivided into
five-waves. If that is the case, count backward to see if any wave count
will fit. The one above is an acceptable fit within all of the guidelines of
Elliott wave.
Copyright 2002, Dynamic Traders Group, Inc. – www.DynamicTraders.com
Practical Elliott Wave Trading Strategies
A Special Tutorial Series For Subscribers To The Dynamic Trader Reports
Wave-A is an impulse. Wave-B is three waves and the W.b:B is also
three waves. Wave-C is five-waves. All the subdivisions fit well even
though the Wave-C is out-of-balance (much greater in time and price) than
Wave-A.
Some times the pattern position does not clearly reveal itself until after
it has signaled that it should be complete. Then we need to count
backwards to see if the pieces seem to fit together within the rules and
guidelines. If so, we have a basis to make an informed and highprobability trading decision with well defined and acceptable capital
exposure.
Trend or Counter-Trend?
Is a 1-2-3 count the best potential for the data below? Why or why not?
The rule that was formed by for the stock indexes is Wave-4 should not
make a daily close into the closing range of the Wave-3. For the data
Copyright 2002, Dynamic Traders Group, Inc. – www.DynamicTraders.com
Practical Elliott Wave Trading Strategies
A Special Tutorial Series For Subscribers To The Dynamic Trader Reports
above, the potential Wave-4 has made several daily closes into the Wave1 closing range although the decline below the Wave-1 high is small in
price. It is acceptable for a Wave-4 to close and trade slightly into the
range of Wave-1 for commodities and individual stocks.
A better wave count may at first seem to be the high on the chart is a
completed five-wave trend as shown below. The main drawback here is
the Wave-4 is much shorter in time and price than the Wave-2 – it is outof-balance with Wave-2. While this doesn’t rule out a five-wave count, the
alternate wave count shown below where the high is a Wave-3 that
cleanly subdivided into five-waves is just as good a count.
At this point in time, neither of the two wave counts is overwhelmingly
favored. According to the rules and guidelines, either is acceptable. It will
require more data to determine which may be best. The trader must also
look to other factors such as the time, price or seasonal position to get a
better idea of which wave count may be more probable.
If the five-wave count to the March high shown above is correct, beans
should continue the bull trend after completing a correction to the fivewave trend.
Copyright 2002, Dynamic Traders Group, Inc. – www.DynamicTraders.com
Practical Elliott Wave Trading Strategies
A Special Tutorial Series For Subscribers To The Dynamic Trader Reports
If the alternate count is correct, beans should be in the process of
completing a Wave-4 low which should be followed by a continued
advance to a new high.
Which count becomes the most evident as more data is included will
help to determine the extent of the next bull trend – A Wave-5 or entirely
new five-wave trend.
Lessons Learned
The Three Elliott Wave Rules
These three rules are most relevant to daily closing data. They should be
committed to memory.
1. Wave-2 should not exceed the beginning of Wave-1. In other words,
Wave-2 should not make greater than a 100% retracement of Wave-1.
2. Wave-3 should not be the shortest of the three impulse waves in a fivewave impulse trend (waves 1, 3 and 5).
3. Wave-4 should not make a daily close into the closing range of the
Wave-1.
The Three Pattern Questions
Whenever considering an Elliott wave pattern, you should ask yourself
these three questions and not consider an Elliott wave count unless you
can answer all three.
1. What is the most probable pattern position? Why? The answer to
this question may only be “impulsive” or “corrective.” The answer
may also be, “don’t know.”
2. What market activity will confirm the assumed pattern position?
What is the pattern guideline that is relevant?
3. What market activity will invalidate the assumed pattern position?
What is the pattern guideline that is relevant?
Copyright 2002, Dynamic Traders Group, Inc. – www.DynamicTraders.com
Practical Elliott Wave Trading Strategies
A Special Tutorial Series For Subscribers To The Dynamic Trader Reports
The Three Important Pattern Considerations
If you are using Elliott wave for practical and logical trading strategies
and decisions, these three considerations will always be in mind.
1. Be quick to admit when there is no discernable or relevant pattern!
Do not force an Elliott Wave count when there is no count that
meets the guidelines or a clearly defined five or three wave
structure.
2. If there is no discernable wave count, does the pattern appear to be
in an impulse or corrective structure?
3. As new data is made, the market will continually confirm or
invalidate the pattern position assumption. Trade the market, not
the forecast. Be quick to change your assumption of the pattern
position if the market activity invalidates the current assumption.
More To Come
Each week, a new tutorial will build on what we have learned. Also, in the
regular report, I will expand on the pattern comments to relate to what is
being taught in the tutorials. The pattern descriptions in the report will help
you to learn how pattern is considered to be part of a trading decision as a
market unfolds.
Over the next few weeks, I believe you will have had the most
comprehensive and practical Elliott wave pattern education available from
any source. You will clearly understand how pattern can be an important
factor of your trading decisions. You will also understand and how to apply
Elliott wave pattern to make the high-probability time and price projections
that are a key to trend targets, reversals, continuations and other trading
strategies.
Copyright 2002, Dynamic Traders Group, Inc. – www.DynamicTraders.com
Practical Elliott Wave Trading Strategies
A Special Tutorial Series For Subscribers To The Dynamic Trader Reports
Practical Elliott Wave Trading Strategies
Part 2
Robert Miner, Dynamic Traders Group, Inc.
Part one of this tutorial series taught the most important question related
to Elliott wave analysis – Is It An Impulse Trend Or A Correction? The
assumption for this tutorial series is that all subscribers have a basic Elliott
wave background as taught in chapter three in the Dynamic Trading book.
The next few tutorials will look at the recent and current position of a
number of markets to see what we can learn about the trend position and
potential reversals based on the pattern position.
Each tutorial will dissect just one market and the recent data to see
how the pattern position has unfolded in recent weeks and days. The best
learn experience is always with current examples as we can then see how
the market unfolds related to how we view the current pattern position and
what should be the outcome.
As you will see, the pattern and trend position is not always clearly
defined, but, we can usually use the EW pattern analysis to identify the
specific market activity that will confirm or invalidate the probable pattern
position.
This Week’s Lesson
It’s Either One or the Other
The pattern position is not always clearly defined. Sometimes a market
reaches a juncture where the sub-divisions of the pattern position indicate
it is either a correction or an impulse. When this is the case, Elliott wave
pattern analysis will usually provide the specific market action that will
confirm which of the potential patterns is most probable and how the
market should follow through.
Copyright 2002, Dynamic Traders Group, Inc. – www.DynamicTraders.com
Practical Elliott Wave Trading Strategies
A Special Tutorial Series For Subscribers To The Dynamic Trader Reports
What’s Next?
From the Nov. high, bonds clearly made an impulsive decline into the Dec.
low. From the Dec. low, bonds clearly made a corrective rally into the Feb.
high. From the Feb. high, the decline to the March low was clearly
impulsive. What type of pattern should the rally from the March 21 low be?
It depends.
Impulse-correction-impulse could be an ABC correction or part of a
more complex correction. It could also be waves 1-2-1:3 of a larger degree
bearish impulse trend. It depends on what we would label the Nov. high.
If we considered the Nov. high the end of a multi-year bull trend, March
should not be the end of an ABC correction. If we though the Nov. high
was only temporary, March could be the completion of an ABC correction.
Copyright 2002, Dynamic Traders Group, Inc. – www.DynamicTraders.com
Practical Elliott Wave Trading Strategies
A Special Tutorial Series For Subscribers To The Dynamic Trader Reports
If we have no strong opinion one way or the other about the Nov. high,
how could the pattern of the advance from the March low help us to
identify the larger degree pattern/trend position?
If the rally clearly unfolds in an ABC or other more complex corrective
pattern, the larger degree trend is probably bearish and will eventually
make new lows well below the March low.
If the rally clearly unfolds in an impulse trend, March should be the end
of an ABC corrective decline from the Nov. high or the impulse may be a
Wave-A which is part of a larger degree correction.
Let’s take a look at the 60-minute data from the March low into midApril.
Is the pattern of the data above clearly impulsive or corrective? From
my point of view, it is not clearly one or the other. Let’s put the most
Copyright 2002, Dynamic Traders Group, Inc. – www.DynamicTraders.com
Practical Elliott Wave Trading Strategies
A Special Tutorial Series For Subscribers To The Dynamic Trader Reports
obvious labels on, those that would meet all of the EW rules and
guidelines and see what are the potentials.
Once bonds traded below the 99’31 swing low, we could assume the
April 15 high completed some section of the trend. If we count backwards
from the April 15 high, there is a clear five-wave impulse from the March
28 low. The ABC from the March 19 high to the March 28 low meets all of
the guidelines for an ABC. Waves A and C are clearly impulsive as they
should be. Wave-B is an ABC itself.
What could bonds do to signal if the April 15 high is a Wave 3 or a
Wave C? A Wave-4 should not trade into the range of the W.1. If bonds
traded below 99’16, the potential W.1 high, we would assume April 15 is a
W.C high. If this were to occur, bonds may still trade to a new high but the
continued rally would have to be considered a complex correction, not an
Copyright 2002, Dynamic Traders Group, Inc. – www.DynamicTraders.com
Practical Elliott Wave Trading Strategies
A Special Tutorial Series For Subscribers To The Dynamic Trader Reports
impulse trend. Waves overlap in corrections, not in impulse trends except
in a W.5 diagonal.
So far, we have not even considered if March 15 is a Wave-C or W.1:3
low. We have only considered the pattern possibilities of the data from the
March 15 low. If we were confident the March 15 low was a W.1:3, we
would consider the April 15 high had probably completed an ABC
correction (W.2:3) since bonds took out the probable W.4:C low.
Let’s add more data. The chart below is the 60-minute data through
this morning. I haven’t added any labels. What do you think is the
probable pattern position?
Should we now consider the rally from the March 15 low an impulse
trend or correction based solely on the pattern?
Copyright 2002, Dynamic Traders Group, Inc. – www.DynamicTraders.com
Practical Elliott Wave Trading Strategies
A Special Tutorial Series For Subscribers To The Dynamic Trader Reports
It is clearly an impulse trend. Bonds did not trade into the range of
Wave-1 and the rally from the April 18 low is clearly impulsive which
should be the Wave-5. The Wave-5 appears to have clearly subdivided
into five-waves which is typical of a Wave-5.
A trade below the W.4:5 low at 101’23 signals the W.5:5 high should
be complete.
What would we anticipated once the W.5 high is complete? At a
minimum, a correction that is greater in time and price than any of the
corrections within the five-wave trend.
Another important question would be – how does the five-wave
impulse trend from the March 15 low to the May high fit into the larger
pattern/trend position? We will consider that in the next tutorial.
Copyright 2002, Dynamic Traders Group, Inc. – www.DynamicTraders.com
Practical Elliott Wave Trading Strategies
A Special Tutorial Series For Subscribers To The Dynamic Trader Reports
For now, the most important lesson from a pattern perspective is we
have identified the most probable pattern and its alternative as the market
progressed and have used pattern to identify the signal that will indicate
the end of the trend. From a trading perspective, that is the critical
information.
Lessons Learned
The pattern position is not always clearly defined. Even when it is not, we
can usually identify the market activity that will confirm or invalidate a
potential position. We can also look to the larger or smaller degree to help
identify the probable position. It is important to be sure that each of the
sub-divisions of the pattern meet the basic Elliott Wave rules and
guidelines described in lesson one before we consider assume to have a
confident opinion of the pattern/trend position.
Copyright 2002, Dynamic Traders Group, Inc. – www.DynamicTraders.com
Practical Elliott Wave Trading Strategies
A Special Tutorial Series For Subscribers To The Dynamic Trader Reports
Practical Elliott Wave Trading Strategies
Part 3
Robert Miner, Dynamic Traders Group, Inc.
This Week’s Lesson
What Confirms A Trend Change?
In this tutorial, we will look at the recent pattern of the S&P and bonds in
detail to see what trading opportunities may be at hand and what the
pattern may be revealing about the larger degree trend position.
Since both of these markets may be near significant reversals, we will
see what the market can do to confirm a reversal is complete.
Copyright 2002, Dynamic Traders Group, Inc. – www.DynamicTraders.com
Practical Elliott Wave Trading Strategies
A Special Tutorial Series For Subscribers To The Dynamic Trader Reports
Bonds
From the March 15 low to the May 1 high, there is only one logical way to
view the Elliott wave pattern which is as a five-wave impulse. May 1 may
or may not be the completion of a W.5 high.
What would be the initial signal W.5 is complete? A trade below the
W.4:5 low. This is a reliable and consistent pattern strategy that should be
used to make trading entry and protective stop decisions. A wave-5
typically sub-divides into five-waves. This is not always clearly evident but
when it is, a trade beyond the W.4 extreme is the signal the W.5 should be
complete.
Bonds have made five-distinct sections up since the March 15 low.
None of them overlapped (W.4 did not trade into the range of W.1) which
implies the five-waves are an impulse trend. What is the pattern signal a
W.5 high complete? A trade beyond the W.4:5 extreme. What should we
anticipate following the completion of a W.5? It depends on the how the
Copyright 2002, Dynamic Traders Group, Inc. – www.DynamicTraders.com
Practical Elliott Wave Trading Strategies
A Special Tutorial Series For Subscribers To The Dynamic Trader Reports
five-wave trend fits into the larger degree pattern position. The minimum
expectation is for a correction against the five-wave trend greater in time
and price than any correction within the five-wave trend. If the W.5 high
completed a corrective high of larger degree, a new impulsive trend may
begin instead of just a correction to the five-wave trend.
Which ever the case may be, the job of the trader is to identify the
completion of the five-wave trend and prepare for a trend reversal trade
for either a correction or new impulse trend in the opposite direction.
The smaller degree data may provide an earlier signal a W.5 high is
complete. It depends on how clearly defined is the pattern. Let’s take a
look at the 60-minute date from the April 18, W.4 low to see how it breaks
down.
When we move down to a lower time frame with short-term data, it is
usually only necessary to view the data from the last confirmed pivot. In
this case, from the probable W.4 low on April 18.
Copyright 2002, Dynamic Traders Group, Inc. – www.DynamicTraders.com
Practical Elliott Wave Trading Strategies
A Special Tutorial Series For Subscribers To The Dynamic Trader Reports
A five-wave rally from the April 18 low appears fairly distinct. If May 1 is
the W.5 high, we can assume May 2-3 completed the initial waves 1-2
down. If this is the case, what would be the signal that confirms W.5 is
complete? A trade below the W.1 low. Since the W.1 low is above the
W.4:5 low, a trade below the W.1 low would be an earlier signal the W.5 is
complete than a trade below the W.4 low.
What would be the maximum protective stop against a short position
taken one tick below the W.1 low? One tick above the W.2 high. It is that
simple and logical. We may be able to break down the data into smaller
degrees for even more timely information and potentially a trade strategy
with even less capital exposure.
The next chart is the bond five-minute data from the May 3 high.
Five-wave trends should be in the direction of the larger degree trend,
unless it is the last five-wave subdivision of the larger degree trend such
as the W.5 or W.C. Three wave trends should be corrections against the
Copyright 2002, Dynamic Traders Group, Inc. – www.DynamicTraders.com
Practical Elliott Wave Trading Strategies
A Special Tutorial Series For Subscribers To The Dynamic Trader Reports
larger degree trend which should be followed by the resumption of the
larger degree trend in the opposite direction to the correction.
Very short-term 5 and 3 wave patterns will often help to identify the
direction of the larger degree trend and how the market fits into the
immediate position. These very minor subdivisions will often help identify
trading strategies with less capital exposure.
In the 5-minute chart above, the market appears bearish since the fivewave trends are down and the three wave trends are up. If this is the
case, a trade below the potential W.b:2 low signals the W.2 high is
complete.
Let’s take a look at another current example to see how pattern may
help us determine the position of a market.
S&P
The chart below is the June S&P from the March 19 high to today’s low,
May 7. There are five-distinct sections. The fifth may not be complete.
Copyright 2002, Dynamic Traders Group, Inc. – www.DynamicTraders.com
Practical Elliott Wave Trading Strategies
A Special Tutorial Series For Subscribers To The Dynamic Trader Reports
Is this a five-wave impulse trend? Probably, but by no means clearly
defined. Typically the W.3 is the extended wave or the longest of waves 1,
3 and 5. As shown above, the W.3 is shorter than the W.1. If the April 30
low is a W.3 low, what is the rule concerning W.5?
Since W.3 cannot be the shortest of waves 1, 3 or 5, the price range of
W.5 should be less than the price range of W.3 so W.3 will not be the
shortest.
If the data so far is not a 1-2-3-4 what may it be? It could be a 1-2-1-2
which is a very bearish potential. I always prefer to stick with the simplest
and most obvious potential wave count unless there is compelling
evidence it is something more complicated or the market proves
otherwise.
Let’s see if the intraday data helps the on the 60-minute chart below.
Copyright 2002, Dynamic Traders Group, Inc. – www.DynamicTraders.com
Practical Elliott Wave Trading Strategies
A Special Tutorial Series For Subscribers To The Dynamic Trader Reports
The intraday data fits the wave count fairly well but not perfectly. The
best wave count for the data to date is shown on the chart above. At the
very least, the clearly defined ABC correction made into the May 2 high
and the probable five-wave decline from the May 2 high is the most recent
pattern information to work with. It clearly appears W.5 (of 5) is nearly
complete.
Now let’s break it down further and just look at the short term 15minute data from the last defined pivot, the May 2, W.4 high.
It appears this is an ideal five-wave trend from the May 2 high. If so,
W.5:5 has already traded below the W.3:5 low which indicates the W.5:5
is in a position to be complete. Could this be something other than a fivewave trend? Of course it could. We have to make decisions based on the
best available evidence. Unless the market proves otherwise, the
Copyright 2002, Dynamic Traders Group, Inc. – www.DynamicTraders.com