personal authentication by SINGLE- CHANNEL ecg
Bạn đang xem bản rút gọn của tài liệu. Xem và tải ngay bản đầy đủ của tài liệu tại đây (980.89 KB, 28 trang )
Hanoi University of Science and Technology
Telecommunication and Electronics Department
personal authentication by
SINGLE- CHANNEL ecg
4/28/23
Students:
Class:
Vu th i m in h
BME K58
Instructor:
DR.
Nguyen
viet
dung
1
Purposes
Research about biometric using ECG signal
To authenticate a person lead to identify person in the future
4/28/23
2
4/28/23
3
8
7
Background information
•
Block diagram
•
ECG acquisition
•
Pre-processing
•
Feature extraction
•
Classifcation
•
Results
•
Conclusion
•
6
5
4
3
2
1
outline
1. Background information
Biometric
authentication:
"Are you indeed
Mr or Mrs A?"
Biometric
Biometrics
identifcation
•
False Acceptance Rate (FAR)
"Who are you?"
FAR =
False Reject Rate (FRR)
FRR =
4/28/23
4
1. Background information
Bio- signal
A material carrier of the information about the state of the
analyzed biological systems.
Give more detailed characteristics about the system
ECG
Non- electric bio- signals
4/28/23
Electrical bio-signals
5
1. Background information
ELECTROCARDIOGRAM (ECG)
f: 0.05 Hz- 100 Hz
A: 1- 10 mV ( dynamic range)
5 peaks and valleys: P, Q, R, S, T
4/28/23
6
1. Background information
ELECTROCARDIOGRAM (ECG)
PR: 0.12- 0.25s
QRS: 0.08- 0.12s
QT: 0.35-0.44s
ST: 0.05- 0.15s
4/28/23
7
2. Block diagram
Classifcation
Feature
extraction
Pre- processing
Classify ‘A’ or ‘not A’
Find features
ECG Record
P, Q, R, S, T peaks
Record from Kardia
Filter to remove noises
Statistical data
mobile
Digitize data
4/28/23
8
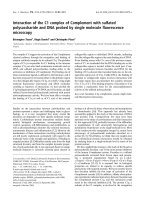
3. ECG Acquisition
Kardia mobile
o To converts electrical impulses from fngertips into ultrasound signals
transmitted to the mobile device’s microphone.
o
Specifcations
4/28/23
ECG Channels
Single Channel
Input Dynamic Range
10 mV
Frequency Response
0.5Hz - 40 Hz
A/D Sampling Rate
300 Hz
Resolution
16 bit
Heart Rate Range
30- 300 bpm
Battery Type
3V Coin Cell
Battery life
12 months typical use
9
3. ECG Acquisition
Kardia mobile
4/28/23
10
3. ECG Acquisition
Web plot digitizer
To digitize the signals into numeric format
Sample rate: 350 Hz
4/28/23
11
3. ECG Acquisition
Web plot digitizer
4/28/23
12
Exp eriment s et up
Object sit on the chair, put two hands on the table, the
device is in front of the object and next to the phone
4 steps:
• Step 1: Press on “Record your EKG” in Kadia app.
• Step 2: Put your fngers on device as Figure 15 and adjust
posture until having continuous signal to start to run.
There are 2 seconds to stabilize device and relax.
•
•
Step 3: After that, keep posture in 1 minute recording.
Step 4: When recording fnishes, fll up your individual
information as instructor in app.
=> Divide into 2 group: the authenticated person and the others.
4/28/23
13
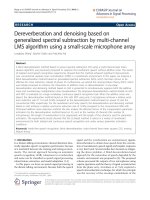
4. Pre-processing
Filter: Band-pass flter.
• High-pass flter: 0.05 and 0.5 Hz (low-frequency cutoff )
• Low-pass flters : 40, 100, and 150 Hz (high-frequency cutoff).
Filter confguration
0.05–40 Hz
0.5–40 Hz
0.05–100 Hz
0.5–100 Hz
0.05–150 Hz
0.5–150 Hz
Cutting segments: from 20s to 50s
Choose
4/28/23
14
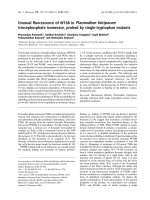
4. Pre- processing
Pre-processing : Chebychev band-pass flter 0.5- 40 Hz.
The power spectrum of original signal
4/28/23
The power spectrum of fltered signal
15
5. Feature extraction
Scaling function of Daubechies Wavelet:
A progression {αk; kϵZ} satisfying the following four conditions for all integer N≥2:
The expression relating the mother wavelet to the scaling function is:
4/28/23
16
5. Feature extraction
Daubechies 4
4/28/23
Daubechies 6
17
5. Feature extraction
Decomposition level 4
•
•
•
•
S: original signal/ time series data
Ai: approximation low frequency content
Di: Detail high frequency content
Level 1 decomposition:
S = A1+ D1
•
Level decomposition 2:
S = A2 + D2 +D1
•
Level decomposition n- level:
S = An + Dn +Dn-1 + Dn-2+…+ D1
4/28/23
18
5. Feature extraction
•
Find R peak in decomposition level 4
From R peaks,
Find peak >=
Find peaks
fnd the other
60% max
inversely on
peaks based
value
original signal
on duration of
them
Let frst
peak be R
peak
Find the other
peaks based on
the minimum and
maximum
4/28/23
Mean values of
P, Q, R, S, T
peaks
19
5. Feature extraction
o
Mean
o
Median absolute deviation (MAD)
o
Standard deviation (SD)
4/28/23
o
Skewness: a measure for the degree of symmetry in the variable distribution.
o
Kurtosis: a measure for the degree of tailedness in the variable distribution
20
6. Classif cation
Classifcation
Unsupervised
Supervised
classifcation
classifcation
Support vector
machine (SVM)
4/28/23
K- Nearest Neighbor
21
7. Results
o
Total data: 150 samples / 60 samples of authenticated
person
120 training data : 60 data of authenticated person, 6
data/ each other ( total 60)
32 testing data: the ratio 16 /16data
4/28/23
o
Feature extraction: 11 features
MeanP, MeanQ, MeanR, MeanS, MeanT
Mean, Median, SD, MAD, Skewness, Kurtosis
22
7. Results
Classification
Train
Validate
(Test/ train ratio)
Accuracy of train and different validate
10/90
20/80
30/70
40/60
100%
90.9%
91.3%
94.3%
93.5%
99.1%
90.9%
91.3%
97.1%
91.3%
KNN
SVM
⇒
⇒
Test/ train ration: 30/ 70
Weighted KNN, Medium Gausisan SVM
4/28/23
23
7. Results
Trained model: Medium Gaussian SVM
4/28/23
Trained model: Weighted KNN
24
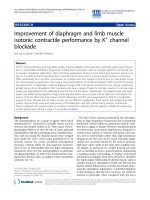
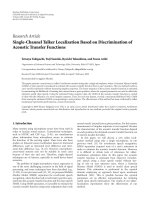
7. Results
Results of test 30 samples with 15 samples of authenticated person
Trial
SVM
KNN
87.50 %
78.13%
0.125
0.125
0.000
0.094
Accuracy (%)
FAR
FRR
4/28/23
25