Measurement of enzymatic browning
Bạn đang xem bản rút gọn của tài liệu. Xem và tải ngay bản đầy đủ của tài liệu tại đây (626.53 KB, 5 trang )
Measurement of Enzymatic Browning at Cut Surfaces and
in Juice of Raw Apple and Pear Fruits
GERALD M. SAPERS and FREDERIC W. DOUGLAS JR.
ABSTRACT
Reflectance procedures were developed to measure the extent of en-
zymatic browning at
cut surfaces
and in the raw juice of apple and
pear fruits. Reflectance L and a measurements, made at transversely
cut
surfaces
of plugs bored from fruit halves, were linear or bilinear
with log time and related to the extent of browning in six apple cul-
tivars. With apple and pear juices, tristimulus values changed linearly
with time in samples undergoing browning. Differences
between in-
itial and final tristimulus
values
were better indices of browning than
the slopes of time
curves.
The suitability of these procedures for eval-
uating the effectiveness of browning inhibitors was demonstrated with
SO2 and ascorbic acid treatments.
INTRODUCTION
BROWNING of raw fruits and vegetables due to mechanical
injury during postharvest handling and processing is an im-
portant cause of quality and value loss in affected commodi-
ties. This reaction results from the polyphenol oxidase (PPO)-
catalyzed oxidation of phenolic compounds to o-quinones which
subsequently polymerize to form dark-colored pigments (Jos-
lyn and Ponting, 195 1; Mayer and Harel, 1979; Vamos-Vi-
gyazo, 1981). Enzymatic browning in unblanched, cut fruits
and vegetables may be controlled by the application of sulfur
dioxide (Joslyn and Braverman, 1954), ascorbic acid (Bauern-
feind and Pinkert, 1970), and various other antioxidants, che-
lating agents,
salts, enzymes and enzyme inhibitors (Vamos-
Vigyazo, 1981). In recent years, however, concern over ad-
verse health effects from sulfite, the most effective browning
inhibitor, has stimulated a search for alternative antibrowning
compounds (Taylor and Bush, 1983; Labell, 1983; Andres,
1985).
To evaluate the effectiveness of experimental treatments in
controlling enzymatic browning and to compare them with
conventional treatments, accurate measurements of the extent
of browning are required. Spectrophotometric procedures, usu-
ally entailing absorbance measurements at 420 nm, have been
used to measure brown pigments in clarified juices (Toribio et
al., 1984) and in vegetable extracts (Hendel et al., 1955).
However, such procedures are slow relative to the rate of en-
zymatic browning in macerated fruits and vegetables and are
not applicable to the evaluation of browning at cut surfaces.
Tristimulus reflectance calorimetry (usually the measure-
ment of Rd or Hunter L values) has been used to follow the
extent of enzymatic browning in juices (Smith and Cline, 1984)
and apple slices (Ponting et al., 1972). Published information
on sample preparation and presentation for calorimetry, the
sensitivity of different tristimulus color scales in responding to
enzymatic browning and the kinetics of such changes is lim-
ited. While reflectance methods are rapid and nondestructive,
preliminary studies have shown them to be limited in accuracy
and precision with heterogeneous samples or samples that were
subject to physical changes during the time of measurement
(Sapers, 1985). The objective of this study was to develop
Authors Sapers and Douglas are with the USDA-ARS, Eastern
Regional Research Center, 600 E. Mermaid Lane, Philadelphia,
PA 1911%.
accurate and precise, nondestructive tristimulus reflectance
procedures, that could be applied to the cut surfaces or juice
of raw fruits, yielding data that could be correlated with visual
and spectrophotometric assessments of browning and used to
determine the effectiveness of treatments to control enzymatic
browning.
MATERIALS & METHODS
Browning at cut surfaces
Apple and pear samples representing common cultivars were
ob-
tained from local
food
stores during the fall and winter of 1985-86
and stored briefly at 4°C until needed. One
hour
prior to use, fruits
were removed from the refrigerator and equilibrated to room temper-
ature (ca 20°C). Each apple or pear was cut in half along the stem
axis, and the halves were positioned in a Petri dish, cut side down,
under an electric cork borer (Sargent-Welch, Skokie, IL) so that uni-
form plugs could be bored perpendicular to the cut surface, on either
side of the point of greatest thickness, with a 22 mm stainless steel
cutting tube. At the start of an experiment, a transverse cut was made
in the plug, at least 1 cm from the skin end (to exclude the effects of
bruising), exposing fresh
surface.
An arrow was
cut
at the opposite
end of the
plug to mark its orientation during reflectance measure-
ments.
Calorimetry was performed with a Gardner XL-23 Tristimulus Col-
orimeter (Pacific Scientific, Silver Spring, MD), operated with large
diameter illumination and with a 19 mm opening aperture plate. The
instrument was standardized against a white tile (Y = 84.60, X =
82.21, 2 = 97.64) before each measurement. The transversely cut
surface of a plug was centered over the aperture, oriented
so that the
arrow cut in the opposite end pointed away from
the
calorimeter op-
erator. Values of the tristimulus coordinates in the L, a, b and Y, X,
Z systems were recorded at I, 10, 30, 60, 90, 120, 150, 180, 240,
300, 360, and 420 min. Between measurements, plugs were held in
covered glass crystallizing dishes to minimize dehydration at the cut
surface. The tristimulus coordinates were plotted against log time, and
the slopes of linear portions of these curves were obtained by linear
regression.
Browning in juice
Juice samples were prepared from individual apples or pears with
an Acme Supreme Model 6001 Juice&or (Acme Juicer Manufactur-
ing Co., Lemoyne, PA), lined with Whatman No. 1 filter paper. A
25 or 50 mL aliquot of thoroughly mixed juice was pipetted into a
cylindrical clear glass optical cell (57.1 mm i.d.) to a depth of about
10 or 20 mm for calorimetry. Care was taken to exclude foam from
the cell. Colorimetry was performed as described above but with the
optical cell placed in a 50 mm diameter support ring in place of the
19 mm aperture plate. Tristimulus values were recorded at 1, 2, 3,
4, 6, 8, 10, 15, 20, 30, 40, 50, 60, 75 and 90 min and were plotted
against time rather than log time.
To permit the direct comparison of reflectance and spectrophoto-
metric data for browning apple juice, 10 mL aliquots of a 100-125
mL juice sample (mixed slowly with a magnetic stirrer) were taken
for spectrophotometry at 15 min intervals, when reflectance measure-
ments also were made. The aliquots were clarified by a modification
of the method of Meydav et al, (1977) entailing rapid mixing with an
equal volume of 95% ethanol and 0.3g Celite Analytical Filter Aid
(Fisher Scientific, Pittsburgh,
PA) followed by filtration through
Whatman No. 50 paper under suction. The absorbance of the filtrates
was determined at 420 nm with a Perkin-Elmer Model 552 UV-visible
spectrophotometer (Perkin-Elmer, Oak Brook, IL)
7258-JOURNAL OF FOOD SCIENCE-Volume 52, No. 5, 1987
Evaluation of browning inhibitors
To determine the suitability of the tristimulus reflectance procedure
for evaluating browning inhibitors applied to
cut
surfaces, Red Deli-
cious and Stayman Winesap apple plugs (2 per half, taken on either
side of the core axis) were
cut
in half, yielding 4 pairs of plug halves
per fruit, each pair having a common
cut
surface. Treatments were
applied to one plug half from each pair, the other half serving as a
control, so that 4 levels of a treatment and corresponding untreated
controls could be compared,
using only 1 apple. Treatments consisted
of 90 set dips in freshly prepared O.Ol%, 0.02%, 0.04% or 0.08%
NaHS03 solutions or in freshly prepared 1% citric acid monohydrate
solutions containing 0.4%, 0.8%, 1.6% or 3.2% ascorbic acid. After
dipping, the plugs were drained, blotted dry with absorbent
tissue and
then held for 7 hr at 20°C during which time tristimulus reflectance
measurements were made at intervals.
The suitability of the reflectance procedure for evaluating browning
inhibitors in juice was tested with Golden Delicious and Granny Smith
apples. The freshly prepared juice from 2 apples was briefly stirred
to assure uniformity and then divided into 5 25mL portions, rapidly
dispensed by burette into optical cells containing 1 mL Hz0 (the
control), 1 mL 0.406% sodium bisulfite (100 ppm SO2 in the juice),
0.75 mL Hz0 + 0.25 mL 0.1% ascorbic acid (AA) (10 ppm), 0.50
mL Hz0 + 0.50 mL 0.1% AA (20 ppm), and I .O mL 0.1% AA (40
ppm). Reflectance L- and a-values for controls and treated juices were
measured at intervals during 1% hr at 20°C. To compensate for sedi-
mentation in the optical cells, the samples were briefly stirred prior
to each reading.
RESULTS & DISCUSSION
Measurement of browning at cut surfaces
Preliminary observations of the cut surfaces of apple and
pear plugs indicated that enzymatic browning occurred grad-
ually over several hours with unblemished tissue. Little or no
variation in the degree of browning could be seen along the
length of the bore hole remaining in the fruit half after removal
of a plug, indicating that the exact location of the transverse
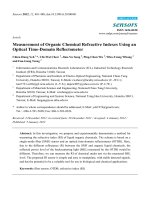
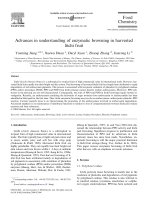
cut probably was not critical. Tristimulus reflectance measure-
ments made at the cut surface of fruit plugs yielded values
which were linear or occasionally bilinear when plotted against
log time and appeared to be related to the extent of browning
(Fig. 1). The logarithmic relationships were unexpected and
may be a consequence of the gradual depletion of PPO sub-
strates in the free juice adhering to disrupted cell layers at the
cut surface. Initial flat regions or deviations from linearity in
the reflectance curves may be indicative of the depletion of
endogenous browning inhibitors such as ascorbic acid prior to
the onset of browning (Ponting and Joslyn, 1948), or of changes
72-
70
I I I111111
I I I I I I I I I I III
O-
_ BARTLETT PEAR
(SLIGHT BROWNING1
I , 01,111 I I I111111
III1
I 5
lo TIME
(min.)
50
100
500
Fig. l-Reflectance L- and a-values at cut surfaces of apple and
pear plugs held at 20°C.
in the albedo of the cut surface due to physical processes such
as the evaporation of free juice.
Since treatments to inhibit enzymatic browning might be
evaluated by comparing one or several plugs taken from op-
posite halves of a single fruit (each plug receiving a different
treatment level), the similarity of reflectance vs time relation-
ships for multiple plugs taken from individual Red Delicious
and Stayman apples was examined (Table 1). Regression slopes
for the linear portion of reflectance vs log time curves as well
as differences between the final and initial L- or a-values (A
values) for the entire curve generally were similar for different
plugs obtained from the same fruit. Since some variation in
slopes or A values was obtained within individual apples (see
Red Delicious I B- 1, for example), the procedure was modified
so that a treated plug could be compared with a control rep-
resenting the same plug. This was done by using half-plugs,
one half receiving the treatment and the same surface on the
other half serving as its control. Variation in cut apple surfaces
could be related to the location of plugs and transverse cuts
relative to the core, with vascular bundles showing up as streaks
or spots, depending on the orientation of the surface. Such
heterogeneity largely could be eliminated by boring plugs on
either side of the core axis at the widest part of the apple.
To determine which of the tristimulus coordinates gave the
most accurate indication of browning at cut surfaces, Hunter L,
a, b and CIE Y, X, Z values were measured for plugs taken
from 4 fruits for each of 6 apple cultivars (Cortland, Granny
Smith, Idared, McIntosh, Red Delicious and Stayman) over a 3
hr period. This study was not extended to pear fruits since the
cultivars examined in preliminary studies (Anjou, Bartlett, Bose,
Red Bartlett and Seckel) browned too slowly to be useful in
evaluating browning inhibitors. Values of Y, X, Z and L for the
browning apple surfaces decreased with time, while values of a
and b increased. In all cases, a linear relationship was seen be-
tween the tristimulus coordinate and the logarithm of time, cor-
relation coefficients for the regression usually exceeding 0.9.
However, changes in X, Z and b appeared to be unrelated to the
extent of browning. Ponting et al. (1972) reported that total re-
flectance values (Rd = Y) correlated better with browning in
apple slices than did a- or b-values (determined with the Rd
coordinate system). Bolin et al. (1964) was able to use the L-
value (L = 10 1’2 to determine the effectiveness of SO2 in
Table l-Reflectance characteristics of cut surfaces of plugs from op-
posite sides of Red Delicious and Siayman apples undergoing browning
at 20°C.
L a
Cultivar Fruit
Side Plug Slope” ALb
Slopea Aab
Red Delicious I A 1 -2.7 -5.2 1.7 3.2
2 -2.9 -5.6 1.8 3.5
6 1
-2.1 -4.2 1.3 2.6
2 - 2.9 - 5.9 1.7 3.4
Mean f S.D.c
-2.6kO.4 -5.2k0.7 1.6r0.2 3.2k0.4
II A 1 -2.1 -4.3 1.4 2.8
2 -1.5 -2.8 1 .o 1 .a
B 1 -2.0 -4.0 1.3 2.8
2 -2.4 -4.7 1.6 3.3
Mean 2 SD. -2.0k0.4 -4.Ot0.8 1.350.2 2.7kO.6
Stayman I A 1 -3.9 -7.7 2.4 4.9
2 -3.2 -6.5 1.9 4.3
B 1 -4.0 -8.1 2.4 5.0
2 -3.6 -7.2 2.2 4.8
Mean -c S.D. -3.7kO.4 -7.420.7 2.250.2 4.8k0.3
II A 1 -2.8 -5.5 1.6 3.2
2 -3.7 -7.4 2.3 4.5
B 1 -3.3 -6.4 2.0 4.0
2 -3.8 -7.8 2.3 4.6
Mean + S.D.
-3.4t0.4 -6.821.0 2.0~0.3 4.1-cO.6
a Linear portion of L or a vs log time curve (at least 5 data points): correlation coef-
ficients for regression > 0.98.
b Difference between 180 min and 1 min values.
c Standard deviation.
Volume 52, No. 5, 1987-JOURNAL OF FOOD SCIENCE-1259
MEASUREMENT OF BROWNING IN RAW FRUITS
inhibiting browning in apple wedges. Since the most character-
istic manifestation of enzymatic browning is sample darkening
(changes in hue being commodity-dependent), a negative corre-
lation between browning and the Y- (or L-) value, which is
defined as the luminosity or lightness function (Clydesdale, 1978),
would be expected.
The absolute values of the reflectance measurements could not
be used to compare different samples undergoing browning be-
cause of apple-to-apple variability in natural pigmentation. There-
fore, the slopes of the reflectance curves (change in L- or a-value
per log cycle time) as well as the differences between final and
initial values of L or a (AL or Aa) were compared, the latter
approach being applicable to curves with bilinear or nonlinear
regions for which a single slope value would be meaningless
(Table 2). The apples compared in this study varied greatly in
degree of browning, both between and within cultivars. Such
variability probably results from differences in PPO activity,
polyphenol content and/or ascorbic acid content (Vamos-Vi-
gyazo, 1981). The extent of apple-to-apple variability within
samples would mitigate against the use of more than one apple
to carry out comparisons of multilevel treatments to control
browning. Among the cultivars compared, Idared and Granny
Smith tended to brown less while Stayman browned more; Red
Delicious, Cortland and McIntosh were intermediate in brown-
ing. Slopes and A values for L and a both appeared to be related
to the extent of browning, changes in L being larger and con-
sequently more sensitive than changes in a. Because of occasional
inconsistencies between L and a, perhaps due to changes in sam-
ple albedo, both AL and Aa values should be used to determine
the extent of browning in apple plugs. Measurements should be
made at times appropriate to the samples and treatments.
Evaluation of browning inhibitors applied to cut surfaces
To demonstrate the applicability of the reflectance procedure
to cut apple surfaces treated with browning inhibitors, un-
treated cut surfaces of Red Delicious and Stayman plug halves,
which undergo severe browning, were compared with surfaces
of the corresponding plug halves that had been dipped in so-
lutions containing different concentrations of sulfite or ascorbic
acid. The extent to which these treatments inhibited browning
was expressed on a percent basis, i.e., the percent difference
between the control and treatment AL or ha values after a
specified storage time t:
% Inhibition =
AL control - AL treatment x IO0
A control
where AL (or Aa) is the difference between the L- (or a-value)
at time t and the value at 1 min. Positive values of the percent
inhibition between 0 and 100 would indicate that the treatment
is effective as a browning inhibitor to the extent calculated.
Values greater than lOO%, if significant, would indicate sam-
ple bleaching by the treatment, while negative values would
indicate that the treatment promoted rather than inhibited
browning. The inhibition data clearly showed that the reflec-
tance procedure could detect the differing degrees of browning
inhibition obtained in plugs treated with different levels of
sulfite or ascorbic acid and then stored for different periods of
time (Table 3). Inhibition data for Red Delicious apples (not
shown) were similar to those obtained with Stayman apples.
Measurement of browning in apple and pear juice
Raw juice might represent
a
more useful system than the
cut surface of plugs for the comparison of multilevel treatments
to inhibit browning since it would be homogeneous and more
easily manipulated. However, preliminary experiments with a
number of apple cultivars (Jonathan, McIntosh, Red Delicious,
Rome, Stayman and Winesap) and pear cultivars (Bartlett, Red
Bartlett and Seckel) indicated that browning in the freshly pre-
Table Z-Measurement of browning at cut surface of apple plugs held at 20°C by tristimulus reflectance calorimetry
Extent of
L - value
browning
a -value
Cultivar
ldared
Apple
(180 minTa
Slope W
ALc
Slope fr)s
AaC
1 v. SI.
-0.7 (-0.85) -1.5 0.8 (0.95)
0.8
4 v. sl.
-2.8 C-0.99) - 3.4 1.4 (0.99)
1.9
2 SI.
-2.8 t-0.99) -3.0 2.8 (0.99)
2.5
Granny
Smith
Cortland
3
Mean ? S.D.d
li
4
2
Mean f S.D.
Red Delicious
2
4
1
3
Mean k SD.
2
3
McIntosh
4
Mean + S.D.
2
3
1
4
Mean k S.D.
Mod.
Mod Sev.
Sev.
Sev.
-3.2 (-0.97)
-6.4 2.2 (0.99)
3.4
-3.2 (-0.99)
-7.0
2.6 (0.99)
3.7
-4.6 (-0.99)
-6.4
1.9 (0.99)
4.1
- 4.5 ( 0.99) - -7.5 2.1 (0.99)
3.9
-3.9kO.8 -6.820.5 2.220.3
3.8 k 0.3
3
Mod Sev.
-2.5 (-0.99)
-5.2
2.2 (0.99)
4.0
1 Sev. - 4.4 ( 0.99) - -8.1 2.8 (0.99)
5.9
2 Sev.
-4.6 f-0.99) -8.0 3.1 (0.99)
5.6
SI
None
v. SI.
SI.
Mod.
Mod.
Mod.
Sev.
Sev.
SI.
Mod.
Sev.
Sev.
-3.4 ( - 0.99) - 3.9 2.0 (0.99)
2.4
-2.4k1.2 -3.Okl.O 1.8kO.8
1.9kO.8
-1.9 f-0.93)
-0.6 1.2 (0.98)
1.1
-1.8 (-0.99)
-2.4
1.1 (0.99)
1.4
- 2.7 ( -0.96) -2.9 1.9 (0.99)
1.6
-3.9 (-0.97) -5.9 2.7 (0.99)
4.0
-2.6el.O
-3.Ok2.2 1.720.7
2.Ok1.3
- 2.0 (- 0.98) -4.3 1.4 (0.98)
2.8
-2.1 (-0.98) -4.9 1.8 (0.99)
3.4
-2.6 t-0.99)
-6.0 1.5 (0.99)
3.6
- 3.2 ( 0.99) -
- 5.9 2.0 (0.99)
3.8
-2.5k0.6 -5.3k0.8 1.7kO.3
3.4eo.4
- 3.7 ( 0.99) -
- 5.1 ( -0.99)
- 4.2 ( 0.97) -
-6.2 (-0.99)
-4.8kl.l
- 5.6
-7.7
-8.8
-9.1
-7.821.6
1 .o (0.99)
1.4
2.1 (0.99)
3.0
1.3 (0.99)
2.8
2.7 (0.99)
4.3
1.8kO.8
2.9k1.2
4 Sev.
- 5.1 i -0.99i -9.6 3.4 io.99j
6.1
Mean k S.D.
-4.2kl.l -7.7kl.8 2.9 + 0.5
5.4* 1 .o
a V. sl. = very slight; SI. = slight; Mod. = moderate; SW. = severe.
b Slope and correlation coefficient for linear portion
of
L or
a vs log time curve fat least 5 data
points).
C Difference between 180 min and 1 min values.
d Standard deviation.
1260-JOURNAL OF FOOD SCIENCE-Volume 52, No. 5, 1987
Table 3-Evaluation of treatments to inhibit browning of cut surfaces of
Stavman aoole oluos bv reflectance tristimulus colorimetrv
121
1
Percent inhibitioW
Browning
inhibitor
Treatment Calculated from AL Calculated from Aa
level (%)
2 hr
4 hr 6 hr
2 hr 4 hr
6 hr
NaHSO,= 0.01
0.02
0.04
0.08
Ascorbic acida,b
0.4
0.8
1.6
3.2
75
69 69 69 54 48
97
94 92 91 84 81
96
96 80 97 89 74
101
99 94
101 95 89
52 24 12 46 15 9
102
91
79
100 87 75
104 102 100 100 97 93
102 102 101 103 100 97
a 90 set dip.
b
All solutions contain 1%
citric acid.
e lAcontrol - Atreatment) x 100 - A control; A values are differences between L or
a values at indicated storage time and values at 1 min.
pared juice occurred too rapidly to permit sample treatment
and evaluation. Juices prepared from Cortland, Golden Deli-
cious,
Granny Smith and Idared apples or from Anjou and
Bose pears browned more gradually.
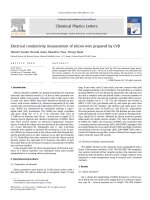
Reflectance measurements, made with these slower brown-
ing cultivars, indicated an inverse relationship between brown-
ing and Z- and L- (or Y) values; a-values increased in the
browning juices (Fig. 2). Plots of the tristimulus coordinates
vs time were linear or bilinear over 1 hr with some nonlinearity
during the first 5 or 10 min, possibly due in part to the de-
velopment of turbidity or dissipation of air bubbles. Reflec-
tance measurements usually were not extended beyond l-2 hr
because of interference due to sedimentation.
The occurrence of initial nonlinearity or bilinearity pre-
cluded the
use
of slopes of tristimulus coordinate vs time curves
as indices of browning. No clear advantage could be seen in
choosing one tristimulus coordinate over another to monitor
juices undergoing browning. Johnson et al. (1976) have noted
that the Z coordinate will respond to browning since brown
pigments absorb at 400 nm, near the maximum for the z-
function of the CIE standard observer. While the Z-value for
pear juice did decrease in browning samples, it also decreased
by a similar amount in some freshly prepared juices that did
not yet develop brown color. Apparently, Z responds to phys-
ical changes such as the development of turbidity or the dis-
sipation of air bubbles as well as to browning.
To establish the validity of the juice system without recourse
to visual observations of browning, which are limited in ac-
curacy and dependent on fruit-to-fruit variability in browning
rates, reflectance L and a data for browning apple juice sam-
ples were compared with spectrophotometric measurements,
i.e., the absorbance of clarified juice at 420 nm (A4& (Table
4). The A420 values increased linearly with time (sometimes
after an initial lag) while the reflectance a-values also increased
and the L-values decreased. The A4z0 and reflectance data
were highly correlated. Slopes and intercepts were consider-
ably more variable for the a vs A4z0 relationship than for the
L vs A4*o relationship, indicating that the a-value was influ-
enced by some characteristic of juice besides the extent of
browning. Consequently, the use of L (or Y) rather than the
a-value to monitor browning in the juice system is recom-
mended. In a recent study of browning in apple juice, Smith
and Cline (1984) obtained a good correlation between the Hunter
L-value and visual rankings of the samples. Correlations be-
tween visual rankings and values of a, b, a/L, a/b and cot-’
a/ b were not significant.
It is apparent from the data in Table 4 that juices from
individual apples of the same cultivar varied greatly in the
extent of browning. Therefore, comparisons of multilevel
treatments to inhibit browning should
be
carried
out
with the
juice from one fruit (or the pooled juice from several fruits),
apportioned among the treatments and control.
IO
8
R
1
I
I
I I I I
I
32
30
28
L
26
24
8
6
4
2
a
0
-2
-4
c
:r^J(
J
I
I
I
I
I
I
0 IO
20
30 40
50 60
TIME (mid
Fig. P-Reflectance Z-, L- and a-values for apple and pear juice
held at 20°C.
Evaluation of browning inhibitors in the juice system
Comparisons of tristimulus reflectance data for untreated
apple juice samples with the same juice containing SO* or
ascorbic acid illustrate the
use
of the juice system to evaluate
browning inhibitors (Table 5). These results were expressed
as percent inhibition
values,
calculated in the same way as for
cut surface browning. However, because more time was re-
quired to prepare and stabilize samples in the juice system, the
initial L- and
a-values
used as the basis for A values were read
at I .5 min for Golden Delicious and at 5 min for Granny Smith
Volume 52, No. 5, 1987-JOURNAL OF FOOD SCIENCE-1261
MEASUREMENT OF BROWNING IN RAW FRUITS. . .
Table 4-Correlation between reflectance and spectrophotometric measurements of browning in apple juice
Extent of browning
L vs Go
at 30 min
Correlation
Cultivar
Trial Visuals XLb xab
A420
Slope Intercept
coeff.
Cortland : Mod -6.8 2.6 0.168 - 37.9 34.8 -0.96
Mod-sev -7.2 1.1 0.252 -26.2 33.2 -0.97
3 Mod-sev -6.9 4.9 0.238 - 36.0 36.4 - 0.97
4 Mod-sev -6.9 3.1 0.287 -21.2 34.1 - 0.99
Slope
18.5
8.2
15.4
14.1
Intercept
0.5
4.0
1.7
1.8
Correlation
CO&.
0.99
0.94
0.95
0.99
C.V.d 2.5 53.6 21.1 26.2 4.0 30.7 72.1
_ __ _ _- _ ________ _ ________ _ _ _ _ _ -_______ _ __ _____
Granny Smith : SI - 3.7 1.9 0.109 -33.2 28.2 -0.98 23.4 - 3.4 0.99
None -1.0 0.2 0.028 - 33.9 24.8 - 0.96 16.1 -1.6 0.97
3 Mod-sev -8.2 7.8 0.197 - 33.8 33.2 - 0.94 18.2 -1.7 0.93
4 SI -0.3 0.3 0.036 - 39.9 26.9 - 0.99 20.0 -2.7 0.99
C.V. 108.5 140.6 85.0 8.9 12.7 15.9 37.8
_ _ ____________________ _________________________ _ _______
ldared 1 Mod -6.3 5.3 0.175 -44.3 37.1 - 0.98 34.8 2.9 0.97
2 Mod-sev -3.6 -1.2 0.184 - 28.9 32.4 - 0.99 3.4 5.2 0.99
3 Mod - 4.3 2.7 0.168 -29.1 29.8 - 0.99 17.7 0.1 0.98
4 Mod -3.4 -0.3 0.151 - 28.0 32.5 - 0.98 2.3 7.5 0.96
C.V.d 30.1 182.4 8.2 24.0 9.2 104.6 189.0
a SI = slight, Mod = moderate, SW = severe.
b Difference between 30 min and 1 min values of L or a.
C Slopes, intercepts and correlation coefficients determined by linear regression based on 5 data points per trial.
d Coefficient of variation (%).
Table &Use of tristimulus calorimetry to evaluate the effectiveness of browning inhibitors in raw apple juice held at 20°C
% lnhibitio+
Calculated from AL Calculated from Aa
Cultivar
Treatmenta
30
min
60 min 90 min
30 min
60 min 90 min
Golden Delicious 10ppmAA 6 5 6 14 10 8
20 AA ppm 23 18 15 19 15 11
40 AA
ppm
36 23 20 35 23 19
100
ppm
SO2
90 100
104 105 105 105
Granny Smith 10 ppm AA 63 38 35 48 26 30
20 AA
ppm
85 57 43 76 57 44
40 AA ppm 96 73 50 76 60 45
100 SOz
ppm
67 92 96 70 90 91
a AA = ascorbic acid.
b (A control A treatment) x 100 - i\ control; 1 values are difference between 30, 60 or 90 min values and initial values (1.5 min for Golden Delicious and 5 min for Granny
Smith).
(which took longer to give stable reflectance values) rather than
at I min, as with the cut surface procedure. No browning was
observed in these samples when the initial tristimulus mea-
surements were made. Under the conditions of this experiment,
both Granny Smith and Golden Delicious juices underwent
severe browning over the course of 30-60 min at 20°C. Color
changes were paralleled by decreasing L-values and increasing
a-values. Browning in juices of both varieties was almost camp
letely inhibited by the addition of 100 ppm SOz, resulting in
little or no change in L or a. Ascorbic acid at concentrations
of IO-40 ppm was less effective in inhibiting browning with
Golden Delicious juice than with Granny Smith juice, the per-
cent inhibition increasing with increasing ascorbic acid con-
centration and decreasing with time.
It is important when using the juice system to employ cul-
tivars that undergo sufficient browning to reveal differences
between treatment levels but not so much that all treatments
are ineffective. Among the cultivars compared in this study,
Granny Smith and Golden Delicious not only meet these cri-
teria
but
are also widely available for most of the year. Ex-
periments designed to evaluate browning inhibitors should
include both an untreated control and a sample treated with
sufficient SO* to completely inhibit browning. Inclusion of the
former will provide a basis for determining the extent to which
an experimental treatment inhibits browning, i.e., the percent
inhibition. Inclusion of the latter will permit the correction of
sample reflectance
values
for changes unrelated to browning,
i.e., the dissipation of air bubbles and development of turbidity
during the first few minutes after juice preparation.
CONCLUSIONS
ENZYMATIC BROWNING at
cut surfaces
of plugs from ap-
ple and pear fruits can be monitored by measuring changes in
reflectance L and a values. This technique may be used with
fruits that are subject to severe browning such as Stayman or
Red Delicious apples
to evaluate
the effectiveness of new
browning inhibitors. Because of fruit-to-fruit variability in the
extent of enzymatic browning, multilevel treatments with
browning inhibitors should be compared using several plugs
from the same fruit, half of each plug serving as a control for
the treatment applied to the other half. Browning in raw apple
juice can be monitored by measuring reflectance L values. If
the juice system is used to evaluate the effectiveness of brown-
ing inhibitors, a fruit that browns slowly such as Granny Smith
apple should be employed.
REFERENCES
Andres, C. 1985. Alternatives for sulfiting agents introduced. Food Proc.
46(4): 68.
Bauernfeind, J. C. and Pinkert, D. M. 1970. Food processing with added
ascorbic acid. Adv. Food Res. 18: 219.
Bolin, H. R:, Nury, F. S., and Finkle, B. J. 1964. An improved process for
preservation of fresh peeled apples. The Bakers Digest 38(3): 46.
Clydesdale, F. M. 1978. Calorimetry -methodology and applications. Crit.
Rev. Food Sci. Nutr. 10: 243.
Hendel, C. E., Silveira, V. G., and Harrington, W. 0. 1955. Rates of non-
enzymatic browning of white potato during dehydration. Food Technol.
9: 433.
Johnson, L. E., Clydesdale, F. M., and Francis, F. J. 1976. Use of expanded
-Continued on page
1285
7262-JOURNAL OF FOOD SCIENCE-Volume 52, No. 5, 1987