- Trang chủ >>
- Khoa Học Tự Nhiên >>
- Vật lý
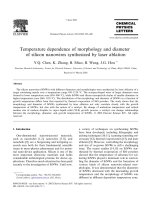
Electrical conductivity measurement of silicon wire prepared by CVD
Bạn đang xem bản rút gọn của tài liệu. Xem và tải ngay bản đầy đủ của tài liệu tại đây (614.28 KB, 5 trang )
Electrical conductivity measurement of silicon wire prepared by CVD
Hiroshi Suzuki, Hiroshi Araki, Masahiro Tosa, Tetsuji Noda
*
National Institute for Materials Science, Materials Reliability Center, 1-2-1 Sengen, Tsukuba, Ibaraki 305-0047, Japan
article info
Article history:
Received 11 October 2008
In final form 27 November 2008
Available online 6 December 2008
abstract
The electrical resistivity of a silicon nanowire formed from Si
2
H
6
by CVD was measured using micro-
probes equipped with SEM. The resistivity of 6.58 Â 10
5
X
cm at room temperature was obtained from
the current–voltage (I–V) curve for the wire with both ends fused to the probes. The non-linear I–V curve
measured only by contacting the wire with the probes could be explained by the resistivity in a series of
silicon and dielectric thin oxide films formed on the silicon nanowires.
Ó 2008 Elsevier B.V. All rights reserved.
1. Introduction
Silicon nanowires (SiNWs) are potential materials for nanoscale
electronic and chemical devices [1–4] due to their quantum con-
finement effects and peculiar structures with a high aspect ratio
in nano size. Most SiNWs have been formed by bottom-up pro-
cesses, such as laser ablation [5], thermal evaporation [6–8], solid
reaction [9], and chemical vapor deposition (CVD) [10,11]. In each
case, SiNWs are synthesized by essentially utilizing a vapor–
liquid–solid (VLS) mechanism [12]. SiNWs are single crystalline
and grow along the h111i or h112i direction with sizes of
3–1000 nm in diameter and 10
l
m – several mm in length [5,7].
Among several physical and chemical properties of SiNWs, there
have been several reports on electrical conductance measure-
ments, in which the single wire was placed on the patterned elec-
tric circuit fabricated by lithography and 2- and 4-terminal
methods were applied to measure the resistances [1,2,4]. In gen-
eral, SiNWs are covered with a thin silicon oxide film formed dur-
ing the growth process or after exposure to air after the formation
[5–11]. Oxide films have been removed so that the silicon crystals
directly contact the electrodes [13]. However, the effect of such
thin oxide film on the electrical resistance measurement of SiNWs
has not been clarified.
In the present work, the direct measurement of electrical resis-
tance of a silicon nanowire was attempted using micro probes
manipulated in a scanning electron microscope.
2. Experimental procedures
2.1. Preparation of materials
Silicon nanowires were grown on {100} silicon wafers with a
thin gold film. The silicon wafer had a rectangular shape (10 mm
long, 4 mm wide, and 0.5 mm thick) and was covered with gold
film of approximately 2 nm in thickness. The gold film as a catalyst
growing SiNWs [3,11] was formed by sputtering. The substrate was
put into a stainless tube and placed inside a vacuum chamber so
that the flow of the reactant gas could be controlled. After evacuat-
ing the chamber up to 1 Â 10
À5
Pa, the substrate was heated at
569 K. A 10% Si
2
H
6
gas diluted with H
2
and argon gas were then
introduced into the chamber. The disilane and argon gases were
run at constant rates of 0.0167 cc/s and 0.33 cc/s, respectively.
The total pressure was set at 0.667 kPa. The disilane gas was chem-
ically decomposed to form SiNWs on the substrate through form-
ing a liquid Au–Si eutectic, followed by silicon nanowire growth
underneath the liquid eutectic droplet [12]. After the deposition
of SiNWs for 1200 s, the structure of SiNWs was examined with
a scanning electron microscope (JEOL JSM-6700F) equipped with
an energy dispersive X-ray spectrometer (EDS) and high-resolution
transmission electron microscope (JEOL JEM-3000F TEM) with a
Gatan GIF Tridiem energy-filter system. Plasmon-loss images were
taken using the Gatan GIF system.
2.2. Electrical resistance measurements
The SiNWs formed on the substrate were manipulated with a
Zyvex S100 system installed in LEO 1550 FE-SEM. The manipula-
tion system consisted of four tungsten probes. One nanowire was
picked up with the probes, and the current–voltage relations were
measured at room temperature using 4-terminal and 2-terminal
methods.
3. Results
3.1. Silicon nanowires
Fig. 1 shows the morphology of SiNWs formed on a silicon wa-
fer at 569 K. The size of the wires ranged from 5 to 100 nm in diam-
eter and 10 – several hundred
l
m in length. The EDS analysis
0009-2614/$ - see front matter Ó 2008 Elsevier B.V. All rights reserved.
doi:10.1016/j.cplett.2008.11.090
* Corresponding author. Fax: +81 29 859 2100.
E-mail address: (T. Noda).
Chemical Physics Letters 468 (2009) 211–215
Contents lists available at ScienceDirect
Chemical Physics Letters
journal homepage: www.elsevier.com/locate/cplett
indicated the presence of oxygen along with a strong Si peak in the
spectra of SiNWs.
The typical microstructure of a SiNW taken by TEM is shown in
Fig. 2. The SiNWs are crystalline and grow parallel to the h110i
direction. A high-resolution lattice image shows that the SiNWs
consist of a crystalline core and an amorphous sheath. The diffrac-
tion pattern indicates that the [1 1 1] zone axis of silicon single
crystal and additional 1/3{422} spots appeared. The 1/3{422}
reflection has been reported elsewhere as well [14]. The appear-
ance of these spots is reported due to the effect of the infinite
structure of the nanowire [14]. The surface amorphous layer is con-
sidered as thin silicon oxide formed by oxidation in a small amount
of residual oxygen in the reaction chamber during the growth of
Fig. 1. Morphology of SiNWs formed for 1200 s at 569 K.
Fig. 2. TEM micrograph and diffraction pattern of a SiNW. The diffraction pattern
was taken for a square region of the lattice image of the nanowire.
Fig. 3. Plasmon-loss images for (a) Si and (b) SiO
2
for the SiNW shown in Fig. 2; (c) and (d) are the intensity profiles of the boxed areas in (a) and (b), respectively.
212 H. Suzuki et al. / Chemical Physics Letters 468 (2009) 211–215
SiNWs [2,5,7,15] and after exposure to air [13] when the samples
were taken out of the chamber.
The chemical state of the SiNWs was examined using plasmon-
loss images. According to the electron energy loss spectra (EELS), a
peak at 16.7 eV corresponding to the first plasmon-loss peak of Si
appears for silicon crystal [16]. The peak for the first plasmon-loss
of SiO
2
is 22.4 eV [16]. Then, the plasmon-loss images were ob-
tained by placing the slit at 16.7 ± 2.5 eV and 22.4 ± 2.5 eV for the
SiNW shown in Fig. 2.
The Si and SiO
2
plasmon-loss images for the nanowire are
shown in Fig. 3a and b, respectively. The corresponding intensity
profiles from the boxed areas perpendicular to the wire axis, as
seen in Fig. 3a and b, were indicated in Fig. 3c and d, respectively.
The full-width at half-maximum (FWHM) value of SiO
2
is 3.5 nm
wider than that of Si. Consequently, the SiNW of around 22 nm
in diameter in Fig. 2 was estimated to consist of the core silicon
crystal of 19 nm covered with silicon oxide of around 1.8 nm in
thickness. Other SiNWs with different diameters were also exam-
ined by TEM. Most SiNWs were found to be covered with oxide
film with a thickness ranging from around 1 nm to several tens nm.
3.2. Electrical resistance measurements
One SiNW with length longer than 100
l
m was pulled out from
bundled SiNWs formed on a silicon wafer by manipulating four
tungsten probes in a vacuum.
Fig. 4 shows how to measure the electrical resistance of a SiNW
by the probes. The SiNWs had enough stiffness to be held by the
probes. The wire was pushed with four probes that were
alternately positioned so that the contact between the wire and
tungsten probes could be sufficiently obtained (see Fig. 4a). A con-
stant electrical current was applied between the outer two probes.
The voltage between the inner two probes was then measured
with a voltmeter. The diameter of the SiNW examined in this
experiment was 850 nm. The distance between the two inner
probes was 2.82
l
m.
Fig. 5 shows the result of a 4-terminal measurement for the
sample shown in Fig. 4. The current increases with the measured
voltage, but no linear relationship in current versus voltage (I–V)
behavior was observed. The slope of the I–V curve gradually in-
creased with the voltage. The linear I–V relation can be assumed
at a certain voltage range. The slope gives an approximate resistiv-
ity of 3.1 Â 10
6
X
cm at 0–10 V, 1.7 Â 10
6
X
cm at 10–15 V, and
6.9 Â 10
5
X
cm at 30–38 V.
The result of Fig. 5 seems to be caused by the effect of surface
oxide surrounding the silicon core. Then, the applied current in-
creased, resulting in the melting of the end of the SiNW contacting
the tungsten probe. In Fig. 4b, the features of the contacts of the
fused SiNW on the two tungsten probes are shown. It is evident
that the end of the SiNW contacting the probe was melted and cov-
ered the probe. According to the binary phase diagram for Si–W
system, W
2
Si phase appears at temperatures lower than the melt-
ing point of silicon [17].This means that the tungsten silicide could
be formed at the interface between the fused silicon wire and the
tungsten tip. The silicon wire therefore firmly adhered to the tung-
sten probe and the contact resistivity between the silicon wire and
the tungsten tip is considered to be negligibly small. The length of
the SiNW between the two probes was 38.6
l
m. The I–V relation
was then measured. The linear relation was obtained as shown in
Fig. 6. The slope gives a resistivity of 6.58 Â 10
5
X
cm for the SiNW
of 850 nm in diameter and 38.6
l
m in length. The present result is
in good agreement with an intrinsic resistivity in the order of
10
5
X
cm for silicon [18]. This value corresponds to p- or n-type
impurity concentration of 10
9
–10
10
/cm
3
[19]. Assuming the num-
ber of silicon atoms in a cubic centimeter as 5 Â 10
22
, the purity
of the present SiNW is to be better than 11 N. Furthermore, the
resistivity value for the 4-terminal method is close to this value
at high voltage. After the measurement of the electrical resistance
by the 2-terminal method shown in Fig. 6, the silicon wire was
fractured by bending. The fractured surface indicated the cleavage
showing the clear single crystalline feature. The silicon wire was
found to be surrounded by a thin oxide film of 5–20 nm in
thickness.
4. Discussion
As seen in Figs. 2 and 3, the SiNW consists of a silicon core and
silicon oxide on the surface. The resistivity measurement by the
4-terminal method (see Fig. 5) indicated a non-linear relation
between the current and the voltage. This means that the surface
silicon oxide might affect the I–V curve. On the other hand, the
I–V measurement after fusing both ends of the SiNW on the tips
of the tungsten probes showed a clear linear relation. The resistiv-
ity obtained from Fig. 6 was 6.58 Â 10
5
X
cm, which corresponds
to the resistivity of silicon crystal with a purity better than 11 N.
In Fig. 5, the resistivity decreases with increasing voltage and came
close to the value of that of Fig. 6. The value of 6.9 Â 10
5
X
cm at
30–38 V was described in the previous section. The surface silicon
oxide is essentially an insulator and has ionic conductive property.
By applying voltage, the ionic current gradually increases with
increasing the electric field, and finally, a dielectric breakdown
phenomenon occurs at high electric fields.
The ionic current, I, through a dielectric material is given as Eq.
(1) [20]:
Fig. 4. SEM micrographs of a SiNW contacted with 4 tungsten probes (a), and the
same SiNW of which both ends were fused to the probes (b). The electrical
measurements were conducted with the 4-terminal method (a) and the 2-terminal
method (b).
H. Suzuki et al. / Chemical Physics Letters 468 (2009) 211–215
213
I ¼ K sinhðk
q
E=2kTÞ; ð1Þ
where k is the ionic jump distance, q, the charge, E, the electric field,
k, the Boltzmann constant, and T, the temperature. K is a constant at
the measured temperature.
Fig. 7 is a schematic drawing of the electrical measurement of
the SiNW covered with the silicon oxide layer. The total resistance,
R, is the sum of those of SiNW and silicon oxide as
R ¼ R
1
þ 2 Â R
2
ðEÞð2Þ
where R
1
is 6.58 Â 10
5
X
cm and is taken from the present
experiment.
R
2
is given as a function of electric field, E, as expected from Eq.
(1).
The total voltage, V
T
, is then
V
T
¼ V
1
þ 2 Â V
2
¼ I Â R ð3Þ
V
1
and V
2
are applied voltages to the silicon wire and the surface
oxide layer, respectively.
Assuming T = 298 K, k = 0.491 nm of the lattice parameter for
the (1 0 0) plane of quartz [21], q = 3.2 Â 10
À19
C for the oxygen
ion, and the average thickness of oxide of 12.5 nm as a result of
the observation of the fractured surface of the SiNW described in
the previous section, the I–V relationship can be obtained by giving
proper K and V
2
values. In the present case, the ratio of V
2
/V
T
, r, was
assumed to be constant independently of V
T
.
Fig. 8 is the result of curve fitting using Eq. (3), where the K va-
lue and r were assumed to be 1.1 Â 10
À11
A and 0.055. A fairly good
coincidence between the experimental and simulation results is
observed. The electric field, E, estimated from the r value, was
changed from 4 kV/mm at VT of 1 V and 44 kV/mm at 15 V. The
reported breakdown electrical field for silicon oxide film is around
40 kV/mm [22]. As described in the previous section, the resistivity
measured by the 4-terminal method started to decrease at around
10–15 V of the applied voltage. The dielectric breakdown was as-
sumed to be completed at 30 V since the resistivity value measured
with the 4-terminal method agrees with that with the 2-terminal
method at around the applied voltage. That means that the break-
down of the surface oxide film was considered to gradually occur
at lower voltage than 30 V.
Fig. 5. I–V curve for the SiNW measured with the 4-terminal method.
Fig. 6. I–V curve for the SiNW measured with the 2-terminal method.
Fig. 7. Schematic illustration of the electrical circuit of SiNW.
Fig. 8. Fitting the estimated I–V curve using Eq. (3) to the experimental data
measured with the 4-terminal method.
214 H. Suzuki et al. / Chemical Physics Letters 468 (2009) 211–215
In the present study, the surface oxide film surrounding the sil-
icon wire was assumed to be SiO
2
only from the result of EELS anal-
ysis. In addition, the removal of the oxide film has not been tried by
such a way heating the wire in vacuum. It will be necessary to fur-
ther examine the precise structure of the surface oxide and its
thickness effect on the electrical resistivity of the SiNW.
5. Conclusion
The electrical resistivity of SiNW formed by thermal decompo-
sition of Si
2
H
6
was measured with both 4-termial and the 2-termi-
nal methods using tungsten microprobes equipped with SEM at
room temperature. In the case of the 2-terminal method, the end
contact points of the SiNW were fused to the tungsten probes.
The following conclusions were derived.
(1) The prepared SiNWs were single crystalline and grow paral-
lel to the h110i direction. The SiNWs were covered with thin
silicon oxide film.
(2) The I–V curve for the SiNW of 850 nm in diameter measured
with the 4-terminal method using micro probes showed a
non-linear relationship that might have been caused by
the effect of surface silicon oxide on the SiNWs.
(3) The 2-terminal measurement, in which both ends of a SiNW
were fused to the probes, indicated a linear I–V curve giving
the resistivity of 6.58 Â 10
5
X
cm. This value corresponds to
that of bulk silicon with purity better than 11 N.
(4) The I–V curve obtained with the 4-terminal method could be
explained by the resistivity in a series of silicon and thin
oxide film.
Acknowledgements
The authors are grateful to Zyvex Corp. for their cooperation in
the measurement of the electrical conductivity and Dr. K. Mitsuishi
for the TEM analyses.
References
[1] Y. Cui, C.M. Lieber, Science 291 (2001) 851.
[2] A. Chung, J. Yu, J.R. Heath, Appl. Phys. Lett. 76 (2000) 2068.
[3] Y. Wu, J. Xiang, C. Yang, W. Lu, C.M. Lieber, Nature 430 (2004) 61.
[4] C.A. Decker, R. Solanki, J.L. Freeouf, J.R. Carruthers, Appl. Phys. Lett. 84 (2004)
1389.
[5] A.M. Morales, C.M. Lieber, Science 279 (1998) 208.
[6] Q. Gu, H. Dang, J. Cao, J. Zhao, S. Fan, Appl. Phys. Lett. 76 (2000) 3020.
[7] Y. Shi, Q. Hu, H. Araki, H. Suzuki, H. Gao, W. Yang, T. Noda, Appl. Phys. A80
(2005) 1733.
[8] Q. Hu, G. Li, H. Suzuki, H. Araki, T. Noda, Jpn. J. Appl. Phys. 41 (2002) L7.
[9] J. Westwater, D.P. Gosain, S. Usui, Jpn. J. Appl. Phys. 36 (1997) 6204.
[10] Z.Q. Liu et al., Chem. Phys. Lett. 341 (2001) 523.
[11] H. Suzuki, H. Araki, M. Tosa, T. Noda, Mat. Trans. 48 (2007) 2202.
[12] R.S. Wagner, W.C. Ellis, Appl. Phys. Lett. 4 (1964) 89.
[13] J. Hu, M. Ouyang, P. Yang, C.M. Lieber, Nature 399 (1999) 48.
[14] D.C. Bell, Y. Wu, C.J. Barrelet, S. Gradecak, J. Xiang, B.P. Timko, C.M. Lieber,
Microsc. Res. Tech. 64 (2004) 373.
[15] Q. Hu, H. Suzuki, H. Gao, H. Araki, W. Yang, T. Noda, Chem. Phys. Lett. 378
(2003) 299.
[16] K. Sasaki, S. Tsukimoto, M. Konno, T. Kamino, H. Saka, J. Microsc. 203 (2001)
203.
[17] S.V.N. Naidu, A.M. Sriramamurthy, P.R. Rao, J. Alloy Phase Diag. 5 (1989) 149.
[18] F.J. Morin, J.P. Maita, Phys. Rev. 96 (1954) 28.
[19] W.R. Runyan, Silicon Semiconductor Technology, McGraw-Hill Book Company,
New York, 1965, p. 106.
[20] M. Kosaki, K. Sugiyama, M. Ieda, J. Appl. Phys. 42 (1971) 3388.
[21] G. Roma, Y. Limoge, S. Baroni, Phys. Rev. Lett. 86 (2001) 4564.
[22] G. Siddall, Vacuum 9 (1960) 274.
H. Suzuki et al. / Chemical Physics Letters 468 (2009) 211–215
215