Methods to access quality and stability of oils and fat containing foods
Bạn đang xem bản rút gọn của tài liệu. Xem và tải ngay bản đầy đủ của tài liệu tại đây (8.02 MB, 219 trang )
Methods to Assess Quality and
Stability of Oils and Fat-
Containing Foods
Editors
Kathleen Warner
USDA, ARS
Peoria, Illinois
N.A. Michael Eskin
University of Manitoba
Winnipeg, Manitoba, Canada
Champaign, Illinois
0935315586-00fm.qxd 12/5/05 1:21 PM Page iii
Copyright © 1995 AOCS Press
AOCS Mission Statement
T
o be a forum for the exchange of ideas, information, and experience among those with a professional
i
nterest in the science and technology of fats, oils, and related substances in ways that promote personal
e
xcellence and provide high standards of quality.
AOCS Books and Special Publications Committee
E
. Perkins, chairperson, University of Illinois, Urbana, Illinois
T. Applewhite, retired, Austin, TX
J. Bauer, Texas A & M University, College Station, Texas
T. Foglia, USDA—ERRC, Philadelphia, Pennsylvania
M. Mossoba, Food and Drug Administration, Washington, D.C.
Y S. Huang, Ross Laboratories, Columbus, Ohio
G. Maerker, Oreland, Pennsylvania
G. Nelson, Western Regional Research Center, San Francisco, California
F. Orthoefer, Riceland Foods Inc., Stuttgart, Arkansas
J. Rattray, University of Guelph, Guelph, Ontario
A. Sinclair, Deakin University, Geelong, Victoria, Australia
T. Smouse, Archer Daniels Midland Co., Decatur, Illinois
G. Szajer, Akzo Chemicals, Dobbs Ferry, New York
L. Witting, State College, Pennsylvania
Copyright © 1995 by AOCS Press. All rights reserved. No part of this
book may be reproduced or transmitted in any form or by any means without
written permission of the publisher.
The paper used in this book is acid-free and falls within the guidelines
established to ensure permanence and durability.
Methods to assess quality and stability of oils and fat-containing
foods/editors, Kathleen Warner, N.A. Michael Eskin.
p. cm.
Includes bibliographical references and index.
ISBN 0-935315-58-6 (alk. paper)
1. Oils and fats, Edible—Quality control. 2. Food adulteration
and inspection. 3. Food industry and trade—Quality control.
I. Warner, Kathleen. II. Eskin, N.A.M. (Neason Akivah Michael)
TX560.03M48 1994
664
Ј.3—dc20 94-48192
CIP
Printed in the United States of America with vegetable oil-based inks.
00 99 98 97 96 95 5 4 3 2 1
0935315586-00fm.qxd 12/5/05 1:21 PM Page iv
Copyright © 1995 AOCS Press
This book is dedicated to
Dr. Sybil James
Reader in Biochemistry (Retired)
University of Birmingham, England
and
Dr. Edwin N. Frankel
Department of Food Science and Technology
University of California, Davis
0935315586-00fm.qxd 12/5/05 1:21 PM Page v
Copyright © 1995 AOCS Press
Preface
This monograph is based on a successful AOCS short course held in Chicago,
Illinois, prior to the 1991 Annual Meeting. Interest is particularly high for short
courses dealing with valid and reliable methods to assess oxidation of fats and oils.
This monograph was written to meet the needs of the growing number of laborato-
ry scientists in quality control, product development, and research for industry, gov-
ernment and academia who are establishing protocols to determine oil quality and
stability. The information presented here should assist in selecting methods that best
represent the true state of quality and stability in oxidized lipids.
The first two chapters provide the reader with a broad perspective from which
to consider the information in the subsequent methodology chapters. Chapter I pres-
ents a historical review of the development of methods to monitor fats and oils form
the 1940s through the 1970s. All readers, but especially novices in lipid oxidation,
will appreciate the origins of this methodology and the advances in methods to
assess oxidation. Chapter 2 reviews factors affecting oil quality and stability, based
on the literature and the author’s own experiences.
In subsequent chapters, scientists who are authorities in measuring lipid oxida-
tion describe the primary methods, as well as the advantages and limitations of
these procedures. Not every method is included, only those that are most represen-
tative of oxidative deterioration in foods. Although chemical analyses are the foun-
dation of many quality control laboratories, sensory analysis is the ultimate analyt-
ical test of oil quality for food-grade products. All aspects of sensory analysis are
included, such as selecting and training panelists, developing sensory panel facili-
ties, preparing testing samples, and designing and choosing testing methods. We
have included those instrumental and chemical tests that relate most closely to actu-
al sensory quality and stability, such as gas chromatographic analysis of volatile
compounds, peroxide value, conjugated dienes, carbonyl value, oxygen uptake, and
anisidine value. The best alternatives to sensory analysis, the three types of gas
chromatographic analysis of volatile compounds are presented, including direct
injection, static headspace and dynamic headspace. We highly recommend using
more than one method and suggest a combination of at least two or three as the pre-
ferred protocol.
Finally, no book on methods would be complete without the information pre-
sented in Chapters 10 and 11 on the critical procedures essential before and after any
analysis, including developing an experimental design, oxidizing samples under
proper conditions, and statistically analyzing the data.
Kathleen Warner
N.A. Michael Eskin
0935315586-00fm.qxd 12/5/05 1:21 PM Page vii
Copyright © 1995 AOCS Press
Contents
Preface
Introduction
Chapter 1 Historical Glimpses of Analytical
and Quality Assessment Methods for Fats and Oils
H.J. Dutton
Chapter 2 Factors Affecting Oil Quality and Stability
T.H. Smouse
Sensory Analyses of Oils and Fat-Containing Foods
Chapter 3 Organization of a Sensory Evaluation Program
L. Malcolmson
Chapter 4 Sensory Evaluation of Oils and Fat-Containing Foods
K. Warner
Chapter 5 Sensory Evaluation of Margarine
M. Vaisey-Genser and B.K. Vane
Gas Chromatographic Volatiles Analyses
Chapter 6 Methods to Measure Volatile Compounds
and the Flavor Significance of Volatile Compounds
R. Przybylski and N.A.M. Eskin
Chapter 7 Historical and Future Development
of Volatile Compound Analyses
J.M. Snyder
Instrumental and Chemical Analyses
Chapter 8 Analyses of Peroxide Values and Headspace Oxygen
T.S. Hahm and D.B. Min
Chapter 9 Conjugated Diene, Anisidine Value,
and Carbonyl Value Analyses
P.J. White
Stability Tests and Statistical Analyses
Chapter 10 Accelerated Stability Methods
P.J. Wan
Chapter 11 Applied Statistics for Oil Chemists
T.C. Nelsen
0935315586-00fm.qxd 12/5/05 1:21 PM Page ix
Copyright © 1995 AOCS Press
Chapter 1
Historical Glimpses of Analytical and Quality
Assessment Methods for Fats and Oils
Herbert J. Dutton
The Hormel Institute, University of Minnesota, Austin, Minnesota 55912, USA.
“Jeder Wissenschaftliche Fortschritt ist ein Fortschritt der Methode.” (1)
This review presents seven glimpses of progress rather than a continuum of history.
The account, admittedly subjective, projects the author’s viewpoint and experience
beginning in an industrial laboratory in 1936 and continues with developments in fat
analysis and sensory evaluation over a period of nearly 60 years.
An Industrial Food Lab Out of the 1930s
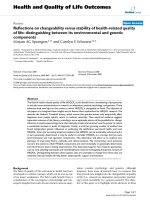
The analytical methodology of the 1930s is perhaps best illustrated by the photo-
graph in Figure 1.1. Above the wood surfaced laboratory desk can be seen the shelf
with 5-gallon glass carboys with standardized solutions of acid, alkali, thiosulfate,
and other chemicals, each connected to a burette for determining acid value (2), free
fatty acid (3), ammonia nitrogen (4), and peroxide value (5). In addition to control-
ling boiler water (hardness, oxygen content, phosphate, and tannin), a pioneering
sewage pretreatment plant was monitored with a variety of tests including biologi-
cal oxygen demand (BOD).
The lower bank of flasks on the left was for digesting foods and feedstuff pro-
tein in sulfuric acid. After neutralization, the upper bank was used for ammonia dis-
tillation, required for the Kjeldahl protein N determination. On the opposite sides of
the laboratory (not shown in Figure 1.1) were the extractors for determining fat con-
tent, the vacuum oven for determining moisture, the “Swift stability test” bath, and
the analytical balance. A set of calibrated weights from the National Bureau of
Standards were used, and tenths of milligrams were calculated by the all-but-
forgotten method of swings. On the floor above this laboratory was housed the
administrative offices of the company. Here, taste testing was conducted on occa-
sion and is discussed later.
It was the author’s dubious distinction to have nearly burned down this wooden
structure. When cleaning the desktop of grease and oil after the day’s work, a petro-
leum ether-wetted cloth was routinely used to remove any spills from the black
bench top. One afternoon, I was alone in the lab and had almost completed the oper-
ation, when at the end of the bench behind the place where Dan H. Nelson on the
right in Figure 1.1 is standing, I saw to my horror a lighted Bunsen burner. Before
I could act, the fumes ignited and yellow smoky flames licked the wood ceiling; the
0935315586-ch01.qxd 12/5/05 2:03 PM Page 1
Copyright © 1995 AOCS Press
fire died down as rapidly as it rose, leaving a settling cloud of carbon particles. I had
extinguished the ether-soaked cloth in the corner sink and was cooling my singed
hands under the faucet when Nelson entered and observed “Kinda dusty in here
today.” I laconically agreed.
Some explanation is needed to understand the peculiar role of science in the
meat-packing industry in the 1930s. Dr. Nelson and I, a student and part lime pair of
hands at the B.A. degree level, were the only two technically trained people in this
organization. Curing hams, for example, was done by “secret” formulas (which, of
course, every company in the industry knew). To Nelson, came the responsibility of
staking his scientific reputation on his recommendations, such as that the less expen-
sive beet sugar could be exchanged for cane sugar in the ham cures. He had to
explain to the administration why meat-storage coolers had mold-inducing water on
the floor. Our allegedly toxic bacon brought in by the city chemist was tested sim-
ply by frying it in an old iron skillet. Both Nelson and the city chemist would then
eat it, knowing that the frying temperature would destroy any biotoxins present.
T
he r
ole of the c
hemist w
as re
g
ar
ded suspiciousl
y by the department foremen.
Confided to me by the Russian-born foreman of curing operations concerning our
analysis of ham-curing pickle, he said “Doc, He no have to find ’em; he know what
he put ’em; he just book ’em up-down; show ’em B____ (the boss).” Translated, this
meant that Nelson doesn’t have to find salt, sugar, nitrate (and nitrite) in the pickle;
2 H.J. Dutton
Figure 1.1. A meat packer’s laboratory in the 1930s.
0935315586-ch01.qxd 12/5/05 2:03 PM Page 2
Copyright © 1995 AOCS Press
he knows what he added; he just writes it in a record hook and shows it to the plant
manager. Despite this distrust, the lab constituted a neutral meeting ground where
warring government inspectors, department foremen, and administrators could com-
municate with fewer inhibitions.
The Taste Testing, as it was called, was conducted in the administration offices.
Hams from various experimental cures were cut for tasting by management person-
nel. In these roundtable discussions, I learned that Nelson could never get the busi-
ness manager to do a “blind” test. His judgment, as well as his sensory responses,
were based on how long the ham had been in cure (i.e., the cost of the cure).
You are probably thinking I have spent an inordinate amount of space on anec-
dotal material, but I have done so to lay a basis in the past from which to view the
present state of analytical methodology and quality assessment. The beginnings of
current methods for analysis were then present. The American Meat Institute was
evaluating the Swift Stability Test for lards—the precursor of the current fat stabil-
ity, Active Oxygen Method (AOM) test (6). We confirmed that the time of induction
for peroxide development was a helpful index of stability in lard products. Because
the peroxide value (PV) in lard rose rapidly once started (autocatalysis), almost any
arbitrary PV could be used, 100, 200, 500 PV for the end point, and arrive at essen-
tially the same time of lard stability. One could also smell the rancidity at the exit
lube as a “quick and dirty” monitor.
At this period of time, we had a refractometer to measure the refractive index
of oil (7). I am not totally sure why we had a refractometer in an oil lab. Color tubes
and standards were available with which to compare tallow color. Colorimetry had
yet to be accepted, and spectrophotometers had yet to be invented.
The solutions for the Hanus or Wijs iodine value (8) were available, but in our
industry we had little need for fatty acid compositional information. Years later, I
rescued two Wijs iodine value flasks with their unique form from the discard pile,
because by then I recognized them as symbolic of that period. It is ironic that today
when an iodine value (IV) is required, it is most probably calculated from gas chro-
matographic data. However, IV was our grandfather’s gas chromatographic-mass
(GC-MS) spectrophotometric analysis, and this brings me to the next series of
glimpses, the 1950s.
Alkali Conjugation—Spectrophotometry
From IV one could speculate whether the fatty acids of an unknown oil were mono-
saturated (oleic acid 89.87 IV), diunsaturated (linoleic acid 181.69 IV), or triunsat-
urated (linolenic acid 273.51 IV) or guess whether the natural mixture was compli-
ca
ted by the presence of saturated acids. This uncertain picture was clarified by the
application of the newly invented absorption spectrophotometer; Beckman’s Model
DU recently celebrated its 50th anniversary.
By measuring spectral absorption at 232 m before and after alkali conjugation,
one could assess how much conjugated diene, linoleic acid, was present. If conju-
gatable trienes were present, a measurement at 268 m
was also made. The
History of Oil Quality Methods 3
0935315586-ch01.qxd 12/5/05 2:03 PM Page 3
Copyright © 1995 AOCS Press
linolenic acid was calculated, and an appropriate correction in the conjugatable
diene made. This was a notable achievement (9) for lipid analysis because now a
rapid independent analysis could be given to a variety of unsaturated fatty acid
occurring in animal and vegetable oils.
At this point, the development was yet incomplete because the monoenoic and
saturated acids still were not accounted for. The ingenuous solution to this dilemma
lay in considering both IV and spectrophotometric data together and calculating
oleic acid. Thus, by the combined iodine value-alkali conjugation-spectrophotomet-
ric methods oleic, linoleic, and linolenic acids were determined. The difference
between the sum of unsaturated acids and 100% was the saturated acid content.
What an achievement in methodology and how important to the growing composi-
tional studies of lipids of that day.
Differential Migration Processes
Enter now a new, diverse, ubiquitous, and multifaceted methodology in lipid analy-
sis, with ancient origins but with popularity and utility that suddenly increased in
the lipid analytical scene. Included under this heading are the now common words
and acronyms of the Chemists’ lexicon: paper chromatography (PC), adsorption
analysis (AA), thin-layer chromatography (TLC), countercurrent distribution
(CCD), counter double counter distribution (CDCD), liquid chromatography (LC),
high performance liquid chromatography (HPLC), gas chromatography (GC), and
capillary gas chromatography (CGC) to name a few.
Paper chromatography, the technique first described by Tswett, was primarily
the separation of pigments as the
chrom or color prefix denotes. Apparatus of the
early 1940s for column chromatography and the determination of carotene in dehy-
drated vegetables is shown in the collage (Figure 1.2a). A paper of mine in 1944,
originally titled “Chromatography of Colorless Compounds” was changed to read
“Adsorption Analysis of Colorless Lipids” to avoid the obvious oxymoron of writ-
ing about colorless color (10). The subtitle “Resolution of Stearic and Oleic Acid”
of the paper described an early chromatographic separation of these two fatty acids.
Equally important, as shown in the collage (Figure 1.2b), it had the basic elements
of HPLC, for example, pressure, solvent, column, and flow through differential
refractometric monitoring (sensitivity 2 X 10
-6
) (11).
Thin-layer chromatography was described in the United States as early as 1950
by Kirschner (12), and his version carried a host of monachers such as “chromato-
strips,” and “chromato-bars” developed in “chromato-cabs.” Thin-layer chromatog-
raphy obtained wide recognition only after a facile procedure and useful equipment
described by Stahl became available to make chromatographic plates (13). In the
hands of Mangold (14) and others at the Hormel Institute, reversed phase, silver ion
(15), and two-dimensional variations, among others, were applied to lipids (Figure
2c). After all these years, TLC remains a procedure of choice in many laboratories
for the separation of lipid classes, geometric and positional isomer resolution, and
systems of isomers isologous in number of double bonds.
4 H.J. Dutton
0935315586-ch01.qxd 12/5/05 2:03 PM Page 4
Copyright © 1995 AOCS Press
History of Oil Quality Methods 5
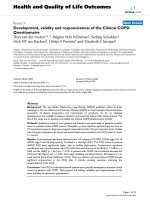
Figure 1.2. Differential migration processes. (a) Apparatus for the analysis of carotene in fresh
and dehydrated vegetables by adsorption column chromatography. (b) Forerunner of HPLC with
pressure, solv
ent, column, and differential refr
actometer to separ
ate fatty acids. (c)
T
he ubiquitous
TLC methodology
. (d) Original metal v
ersion of counter
current distribution (CD). (e) Automatic
200 tube CD. (f) Counter double current distribution (CDCD) with continuous solvent and prod-
uct recovery. (g) An early “Aerograph” gas chromatograph with thermoconductivity detector and
6-volt storage battery power supply.
0935315586-ch01.qxd 12/5/05 2:03 PM Page 5
Copyright © 1995 AOCS Press
Another unit of the collage of differential migration processes is that based on
liquid/liquid extraction. Apparatus invented by Post and Craig (17) first in metal
(Figure 1.2d) and then in glass (Figure 1.2e), countercurrent distribution was first
used with fatty acids by their colleague, Ahrends (18) at the Rockefeller Institute.
When the “glass pipe organ” applied to the separation of triglycerides in a 200 glass
tube model, remarkable separations were obtained, upsetting Hildich’s widely
accepted theories on “even” and “random” distribution of fatty acids within triglyc-
eride molecules (1920).
In another section of the collage (Figure 1.2f) is shown the CDCD where the
two immiscible solvents moved stepwise and countercurrently after the shaking and
settling stages. In a closed system of solvent steam distillation and product recovery
(21), 500 g of pure methyl linolenate were recovered from linseed methyl esters in
the first working week of its operation. At the price of the pure compound, the pur-
chase price of the CDCD equipment was nearly returned in the first week.
Indications were that fatty acids more unsaturated than linolenic presented even
more favorable separation systems. Although generally replaced by the more popu-
lar “preparative” HPLC procedures, I contend that it is still a choice preparation
method. One problem would be that with such a high production rate, supply for
high-purity fatly acids for research purposes would soon exceed demand.
The next significant picture of the collage dealing with differential migration
processes is GC (Figure 1.2g). In the 1950s, one of the missions undertaken by the
informal Ad Hoc Committee on Gas Chromatography was to try to tell the GC
equipment manufacturers that beyond the currently successful applications to petro-
leum-product separation was the potentially large market of application to medical,
biological, and lipid research—if only they would raise the high-temperature limit
on the thermoconductivity detectors with improved electrical insulators. Out of this
group came the famed selective polyester liquid phases, such as Reoplex 400. LHC-
2-R-446, and ethylene glycol succinate, (22), and from S. Lipsky (23) the first 500
ft stainless steel, Apiezon-coated capillary column (200,000 plates) that could sep-
arate methyl stearate and methyl oleate and even methyl oleate, and methyl elaidate.
Sensory Evaluation in the 1940s
Taste testing in the 1930s differed from that in the 1940s vegetable oil industry. In
general, one man, “the expert,” did the tasting of the oil for a whole company. His
influence was enormous, affecting every stage of oil processing from seed storage
through extracting, refining, bleaching, and deodorizing. The experts who visited
our newly initiated research at NRRL
1
on the flavor stability problem of soybean oil
gave valuable guidance on defining reversion flavor. The NRRL program is in their
debt; however, by statistical evaluation later, these experts were found to be as vul-
6 H.J. Dutton
1
NRRL, the acronym for the Northern Regional Research Laboratory, United Slates Department
of Agriculture, Peoria, IL, is so named in embossed words above its stainless steel entrance, and
has been followed by acronyms NRRC and NCAUR.
0935315586-ch01.qxd 12/5/05 2:03 PM Page 6
Copyright © 1995 AOCS Press
nerable as taste panel members to random error. In 1945, a taste panel on oils was
operating at NRRL under the physical conditions shown (Figure 1.3). Earlier, as a
colleague of Mildred Boggs and panel member at the Western Regional Research
Laboratory (WRRL), I had learned the basics of panel operations (24), including an
introduction to A. Student’s “Statistical t test.”
I pause here to note that during the 1940s “statistics” was a new idea to most
chemists. The teaching of physical chemist Professor Farrington Daniels in 1939
was “If your data is so bad you need to use statistical methods, you better go back
to the lab and sharpen up your tools.” Fortunately for him, he was not dealing with
uncontrollable biological variation, but his prejudice was typical of the day. In 1906,
Gosset was working in an Irish brewery that discouraged employee publication of
scientific data and was forced to sign his historic paper about the “T” test under the
pseudonym “A. Student” (25).
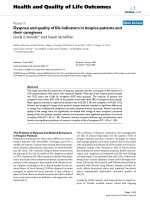
As seen in Figure 1.3, the taste panel at NRRL in the 1940s was conducted in
the back of the auditorium away from laboratory odors using tables with collapsi-
ble partitions, roll-in carts with aluminum heating blocks (60°C), and beakers and
cover glasses cleaned by firing in the glass blower’s oven (26). The point is that reli-
able evaluations can be made even under crude physical conditions if the proper
knowledge is used and care is taken. As evidence, we reproduce a chart of
Milestones of Progress on the Flavor Stability Problem of Soybean Oil (Table 1.1)
History of Oil Quality Methods 7
Figure 1.3. Early taste panel operation (1945).
0935315586-ch01.qxd 12/5/05 2:03 PM Page 7
Copyright © 1995 AOCS Press
(27). Each milestone of achievement on this table was made possible by the senso-
ry evaluation procedures of the NRRL taste panel. The taste panel members shown
in Figure 1.3 are in addition to Helen Moser, panel leader (right), chemist Dolores
Rayleigh, who became Mrs. Karl Zilch, wife of AOCS President in 1950, and chem-
ical engineer Warren Goss, who was to become Major Warren Goss of General
Patton’s staff in World War II.
Warren Goss was commissioned toward the end of the war with the assignment
to follow in the wake of Patton’s advancing tanks to learn the secrets of the German
oilseed industry, particularly with regard to the purported solutions of the of soybean
oil flavor problem. He kept hearing rumors of a recipe for solving the problem, but
it was not until the troops reached Hamburg that he obtained particulars. He learned
of a Dr. Tassusky and his daughter Ilona who had a patented recipe involving multi-
ple washes of crude soybean oil with water or with water glass (sodium silicate) and
adding 0.01% of citric acid to the deodorizer (28,29). When the formula was tried at
NRRL, the taste panel said it was effective and highly significant. The process
worked, not because of the washings, but because of citric acid addition (30). As
detailed among the achievement milestones (27), we found it worked because the
citric acid complexed the prooxidant metals (iron and copper) in soybean oil in the
ppm and ppb range and slowed the rate of oxidation by these prooxidant metals.
Suffice to say that the success of research in 1947 on “The Number One Problem of
the Soybean Industry” was made possible by the results from the statistically con-
trolled analytical taste panel. Further, I am not aware of a single observation or con-
clusion based on this taste panel data that has ever been recanted.
While “the proof of the pudding is in the eating,” for example, sensory evalua-
tion, chemical analyses were also sought and used as objective indices of oil quali-
ty and stability. Among the myths, rumors, and opinions circulating concerning soy-
bean oil in the 1940s were that it reverted in flavor after being refined and deodor-
ized; that it was extremely light sensitive, reverting if one carried the freshly
8 H.J. Dutton
TABLE 1.1
Milestones in Improving Flavor Stability of Soybean Oil
Date NRRC Research Industry Response
1945 Standardized taste test Worldwide acceptance
1945 Trace metals Brass valves, Sheet steel
1948 Metal deactivators “Nary a lb. without citric acid”
1948 Flavor is oxidation Inert gas blanketing
1951 Precursor —linolenic
—breed it out —Homozygous (it can’t be done)
—extract it out —Practiced but now obsolete
—hydrogenate it out —”Specially processed soybean oil”
1966 Recognition of room odor problem
1966 Copper catalysts
1974 Commercial production of cooking oils
—Lesieur-Cotelle, France
—Safeway, Texas
—Unilever, Holland
0935315586-ch01.qxd 12/5/05 2:03 PM Page 8
Copyright © 1995 AOCS Press
deodorized oil past the light of a north window, and that the reversion was not an
oxidative phenomenon. As we now know, soybean oil does not revert to its original
crude oil flavor; the effect of light is real but was greatly exaggerated; the off-flavor
development is indeed an oxidative reaction. In the 1940s, like today, peroxide
development was the most common measure of oxidation, but under the procedure
then in use, titrating with 0.1 N thiosulfate, one drop represented a PV of 6 and was
dismissed as a blank reading. When we “sharpened up our tools” increasing sensi-
tivity, we found that the flavor score was inversely correlated with PV and the prior
fallacy could be explained that by the time soybean oil had reached PV 3, it had
already passed through the acceptable ranges of flavor (31), With the support of the
more sensitive peroxide method, the old Schaal Oven Test of simply storing the oil
in the dark at 60°C for several days and tasting, became a more valuable predictor
of stability. All samples presented for taste panel evaluation were routinely analyzed
for PV before and after storage at 60°C.
A host of analytical procedures and equipment now stem from the relation of
oxygen absorption and flavor (Chapter 2). The spectrophotometrically determined
diene conjugation of linoleic and linolenic acids, the volume of oxygen absorbed by
the oil, color of Kreis thiobarbituric acid color reactions, and other tests assess some
phase of oxidation and correlate with off-flavor development.
Perhaps the most widely used predictor of stability is that generated from the
Swift Stability Test mentioned previously. Its application to vegetable oils rather
than lards immediately met a seemingly unsurmountable problem—vegetable oils
and lards oxidize differently in this test. Lards hold for hours with no apparent per-
oxide development, then at a break point in time, indicative of the lard’s stability,
they develop high peroxides of 100–300 in an hour’s time. Unfortunately, the PV
versus time curves for vegetable oils, including soybean oil, rise gradually, but
hyperbolically, from the beginning and at a constantly increasing rate and display no
break with time. However, the rates of oxidation for these vegetable oils did corre-
late with stability under the conditions of bubbling air at 100°C.
The solution to the amount of labor required to measure the PV for a single oil
on an hourly basis was to set a uniform time at which to make comparisons. The
pragmatic answer to the analyst’s working day of 8 h plus 1 h for lunch was the
“peroxide value at 8 hours.” Under this regimen, as the first act in the morning, the
analyst removed samples, already in their aeration tubes from the freezer, placed
them in the 100°C bath; and connected air bubbler tubes. During the day, the next
set of samples were placed in new tubes and stored in the freezer, leaving the last
hour of the working day for sample titration. It was upon these practical considera-
tions the 8 h PV AOM evolved (31).
Computer-Ease
Each lipid scientist working in the 1960s and 1970s will recall how he/she was
drawn or pushed or sneaked into the back door of the computer lab. In the hope that
History of Oil Quality Methods 9
0935315586-ch01.qxd 12/5/05 2:03 PM Page 9
Copyright © 1995 AOCS Press
the history of an individual, namely myself, will reflect the experience of many oth-
ers, I recount my story here. Our first computer was of the analog type, purchased in
1962 as a kit and of necessity disguised from administrators as a “Reaction Rate
Simulator.” It was used to model the kinetics of hydrogenation (31). With the demon-
stration of its utility, the computer shown in Figure 1.4 was acquired and exploited.
10 H.J. Dutton
Figure 1.4. Analog computer used for resolving o
v
erlapping Gaussian curv
es and simulating
kinetics of hydrogenation (32).
0935315586-ch01.qxd 12/5/05 2:03 PM Page 10
Copyright © 1995 AOCS Press
My introduction to the digital computer began in 1965 with my registering for
a first offering of a freshman engineering course in Fortran Programming at Bradley
University. A short Lime into this study, I saw great opportunities for research and
began bootlegging early morning computer time at the University. My first project
was to try to describe the countercurrent distribution process mathematically, a
mathematical simulation as it came to be known. Suffice to say, I miraculously and
fortunately had an operational program just two days before the end of the semes-
ter (33); most important was the confidence I now had that I and the NRRL could
make effective use of this new computer tool. Back at the laboratory, I made the dis-
covery that of the over 500 employees at NRRL; only I had computer experience
and could program in Fortran. I will not relate the teaching of Fortran to the NRRL
staff, single-handedly writing feasibility studies, and proposal refusals year after
year. Finally, we acquired an IBM 3101 batch type computer. The memory of this
advanced design had the astronomical size of 3.5 K!
By 1980, an efficient computer staff at NRRL of only three people, Chemists
Roy Butterfield and programmer Darhal Wolf, were operating a centralized system
in which the then expensive core, printers, and disk drives were shared by all users.
Each chemist had a control unit in his lab which made the shared computer appear
as his very own. At that time, we had over 60 gas chromatographs, 6 mass spec-
trometers, 2 spectrophotometers, a soybean-mini refinery; and terminals in the
stockroom and business office on line to an IBM 1800 (or upgrade) with conduits
going to 4 levels of the building and 3 wings. This installation at NRRL succeeded
where other contemporary ventures failed because, I think, of a basic philosophy
that computer usage was not just for the mathematical elite, but of the chemist, by
the chemist, and for the chemist. Secondly, we planned from the beginning to auto-
mate the whole laboratory as opposed to computerizing individual instruments.
The interesting epilogue to this story, however, is that because of technical
developments, such as visual monitors, keyboard input, the lower cost of memory,
disc storage, and printers, this computer installation would probably follow a dif-
ferent course of development if initiated today. The conflicts of the “itty bitty bina-
ries” vs. the “Big Blue Monster,” and of personal computers vs. mainframes seem
to have been solved today by their marriage.
Hyphenation
This is a buzz word to describe a process already long underway, that of a tandem
arrangement of previously separated methodologies to give symbiotic advantages.
Complete sessions of analytical symposia were and are (34) devoted to hyphenation.
Thus, a high-temperature ionization chamber was placed tandem to a gas chro-
matograph so that the specific activity of fatty acid esters could be measured as
compounds being eluted. It was called “Chromatography-Radioactivity” (35). Then
followed g
as chromatography-infrared (GC-IR) (34), countercurrent distribution-
monitoring refractometer (36), gas chromatography-mass spectroscopy (GC-MS).
History of Oil Quality Methods 11
0935315586-ch01.qxd 12/5/05 2:03 PM Page 11
Copyright © 1995 AOCS Press
Two separate papers have credited NRRL with being the first to connect GC to MS
(37,38). The now ubiquitous GC-MS arrangement illustrates the complementary
advantage of hyphenation, for example, while the GC is quantitatively telling us
how many compounds and how much, the mass spectrometer is qualitatively telling
us the identity of the peaks.
With the advent of HPLC a series of similar hyphenations, for example,
-radioactivity, -infrared, -mass spectrometry, -fluorescence, were being made. Early
on, the hyphenation with computers was mentioned. Now if a computer is needed
to control equipment, record and store data, calculate and present graphics, it is done
without fanfare or acknowledgment.
Integration of Methodologies
Modern research knows none of the conventional disciplinary lines that are used for
teaching purposes. For example, the solution of a nutritional problem may call on
advanced techniques in chemistry, biochemistry, physics and mathematics indis-
criminately for its successful implementation. A recent (39) and an older (27) paper
are selected for this final snapshot to illustrate the integration of most of the method-
ologies listed previously; their significance has been demonstrated by italicizing
them in the following text.
To study the metabolic role of positional isomers of fatty acids created by the
hydrogenation process, rats were used as models. Three groups were fed isocaloric
rations including a corn oil diet (CO), an essential fatty acid deficient diet (EFAD),
and a partially hydrogenated soybean oil (PHSO) diet containing a variety of iso-
meric fatty acids (39). At 10 weeks, when deficiency symptoms were apparent in
the EFAD group, liver phospholipids were isolated by
TLC; converted to methyl
esters; and the monoenoates, dienoates, trienoates, and tetraenoates separated by
AgNO
3
TLC. The C
18
dienes and C
20
dienes form a single band on AgNO
3
-TLC but
were readily separated on a reversed phase
HPLC column with a tandem refractive
index detector
.
The organic chemical reaction of reductive ozonolysis was used to locate the
positions of double bonds in these dienoic fatty acids. Reduction of the ozonides
with tr
iphen
yl phosphene yields aldeh
yde ester (AE), dialdehyde (AA), and alde-
h
yde (A) fr
agments coming from the ester end, the middle, and the alkyl end of the
dienoic fatty acids, respectively. The identification and quantitation of these alde-
hyde fragments of varying chain length was carried out with a
CGC-computer sys-
tem. Malonyl dialdehyde equivalent was determined independently by an injector
port
alkaline-conjugation reaction followed by CGC resolution of conjugated from
nonconjugated diene isomers.
T
he f
a
tty acid isomer composition of the individual ra
t li
ver phospholipid sam-
ples was calculated from the aldehyde analyses by a
computer solution of a matrix
with as many as twelve linear simultaneous equations. The observed mole percent
of each individual aldehyde was accounted for in each equation as the sum of mole
12 H.J. Dutton
0935315586-ch01.qxd 12/5/05 2:03 PM Page 12
Copyright © 1995 AOCS Press
percentages of those individual fatty acid isomers contributing to that aldehyde. A
computer program based on the Gram-Schmid Orthogonalization procedure provid-
ed a best solution after least squares minimization of error and yielded the fatty acid
isomer composition of the individual rat liver phospholipid samples (39). Unusual
isomeric polyunsaturated isomers were found in the rat liver phospholipids as
shown in the computer drawn graphics of Figure 1.5.
Integration of
sensory evaluation with the physical analytical methodology has
also been illustrated in a paper previously cited (27). “A Nose in the Computer
Loop,” Figure 1.6, relates the aromogram of a human observer to a gas chro-
matogram. While the chromatogram of volatiles tells us how many compounds and
how much of each compound is present, the tandem
mass spectrometer tells us what
they are, and the nose,
sensory evaluation, tells us how significant.
Quo Vadis
A recorder of history can with great difficulty restrain him/herself from predicting
the future—and the further one sees the greater one’s error. But certain trends seem
apparent. The lines between the pedagogic disciplines will continue to erode, and
greatest progress will continue to be made at the interfaces between the previously
divided areas. Thus, psychology and physiology must play an increasing role in
History of Oil Quality Methods 13
Figure 1.5. Isomeric 18:2 fatty acids in liver phospholipids identified and measured by compu-
ter solution of simultaneous equations using data from quantified ozonolysis of each of five sam-
ples from each dietary group expressed as percent of total 18:2 (39).
0935315586-ch01.qxd 12/5/05 2:03 PM Page 13
Copyright © 1995 AOCS Press
relating the physics and chemistry of sensory response. More “Nose in the
Computer Loop” (Figure 1.6) experiments will evolve. Although research on an
electronic nose will expand, human response will always be required at some point
in time. Sensory panels must continue even though the electronic nose may well
relieve the panel in certain specific routine evaluations.
The effect that shifting double bonds up and down fatty acid chains or chang-
ing cis to trans configurations during hydrogenation on oil-odor response to aging
requires as much research as the role geometric and positional isomers have on
metabolism. The future needs a methodology where the geometric configuration
and position of double bonds on the carbon chain can be determined by using the
mixtures of polyunsaturated fatty acids that occur in partially hydrogenated liquid
oils, margarines, shortenings, and tissues of consuming animals. Regardless of the
specific course lipid research will take in the future, we may be assured that “Every
advance in scientific knowledge is first an advance in technique” (1).
REFERENCES
1. Zechmeister, L., and Cholnkey, L.V. 1938. Die Chromatographische Adsorption
Methode
, 2nd edition, Julius Springer, Vienna.
2.
Of
ficial Methods and Recommended Practices of the American Oil Chemists’ Society
,
Fourth Edition, American Oil Chemists’ Society, Champaign, IL, 1989. Method No.
Cd-3a-63(87) Acid Value.
3.
Official Methods and Recommended Practices of the American Oil Chemists’ Society,
Fourth Edition, American Oil Chemists’Society, Champaign, IL, 1989. Method No. Ca-
5b-71 Free Fatty Acids.
14 H.J. Dutton
Figure 1.6. A nose in the GC-MS computer loop (27).
0935315586-ch01.qxd 12/5/05 2:03 PM Page 14
Copyright © 1995 AOCS Press
4
.
O
fficial Methods and Recommended Practices of the American Oil Chemists’ Society
,
Fourth Edition, American Oil Chemists’Society. Champaign, IL, 1989. Method No. Ba-
4b-57(87) Protein.
5.
Official Methods and Recommended Practices of the American Oil Chemists’ Society,
Fourth Edition, American Oil Chemists’ Society, Champaign, IL, 1989. Method No.
Cd-8-53(86) Peroxide Value.
6.
Official Methods and Recommended Practices of the American Oil Chemists’ Society,
Fourth Edition, American Oil Chemists’ Society, Champaign, IL. 1989. Method No.
Cd-12-57(81) Fat Stability.
7.
Official Methods and Recommended Practices of the American Oil Chemists’ Society,
Fourth Edition, American Oil Chemists’Society, Champaign, IL, 1989. Method No. Cc-
7-25(73) Refractive Index.
8.
Official Methods and Recommended Practices of the American Oil Chemists’ Society,
Fourth Edition, American Oil Chemists’Society, Champaign, IL, 1989. Method No. Ca-
l-25(88) Iodine Value.
9.
Official Methods and Recommended Practices of the American Oil Chemists’ Society,
Fourth Edition, American Oil Chemists’ Society, Champaign, IL, 1989. Method No.
Cd-7-58(73) Polyunsaturated Acids.
10. Dutton. H.J. 1944.
J. Phys. Chem. 48, 179.
11. Rao, D. and Roseveare, W.E. 1936.
Ind. Eng. Chem. Anal. 8:72.
12. Kirschner, J.G. and Keller, G.J. 1950.
J. Am. Chem. Soc. 72:1867.
13. Stahl, E. (Ed.)
Thin-Layer Chromatography, Springer-Verlag, Germany, 1965.
14. Mangold, H.K. 1961.
J. Am. Oil Chem. Soc. 38:708.
15. Mangold, H.K. in
Thin-layer Chromatography, edited by E. Stahl, Springer-Verlag,
Germany, 1965. pp. 137–186.
16. Morris, L.J. 1966.
J. Lipid Res. 7:717.
17. Craig, L.C. and Post, O. 1949.
Anal. Chem. 21:500.
18. Ahrends, E.H. Jr. and Craig, L.C. 1952. J.
Biol. Chem. 195:299.
19. Hilditch, J.P.
The Chemical Constitution of Natural Fats, 3rd edition, John Wiley and
Sons, New York, 1956.
20. Dutton, H.J. 1972.
Chem. Ind. 17:665.
21. Butterfield, R.O., Dutton, H.J., and Scholfield, C.R. 1966.
Anal. Chem. 38:86.
22. Staff “Key C
18
Unsaturated Fatty Acids Separated”, in C & En., Feb. 3, 1958, p. 522.
23. Lipsky, S.R., Lovelock, J.E., and Landarone, R.A. 1959.
J. Am. Chem. Soc. 81:1010.
24. Boggs, M., Dutton. H.J., Edwards, B.G. and Fevold, H.L. 1946.
Ind. Eng. Chem.
38:1082.
25.
W
alpole
,
R.E. and Myers, R.H. 1989.
Pr
oba
bility and Sta
tistics f
or Engineers and
Scientists
, 4th edition, Macmillan Publishing Company, New York, 1989.
26. Moser, H.A., Jaeger, C.M Cowan, J.C., and Dutton, H.J. 1947.
J. Am. Oil Chem. Soc.
24:291.
27.
Dutton, H.J
.
A
CS Symposium Series,
No. 75,
Lipids as a Sour
ce of Fla
vor
,
American
Chemical Society, Washington D.C., 1978, pp. 81–93.
28. Goss, W.H. 1946.
Report on Germany—Fats & Oils and Oilseeds. Summary on inves-
tigations. Publication No. 1270. Publication Board, U.S. Department of Commerce,
W
ashington,
D
.C.
29. Tausky, I. U.S. Patent No. 2,413,009, 1946.
30. Dutton, H.J., Moser, H.A., and Cowan, J.C. 1947.
J. Am. Oil Chem. Soc. 24:261.
History of Oil Quality Methods 15
0935315586-ch01.qxd 12/5/05 2:03 PM Page 15
Copyright © 1995 AOCS Press
3
1. Dutton, H.J., Schwab, A.W., Moser, H.A., and Cowan, J.C. 1948.
J
. Am. Oil Chem. Soc.
25:385.
3
2. Butterfield, R.O., Bitner, E.D., Scholfield, C.R., and Dutton, H.J. 1964.
J
. Am. Oil
Chem. Soc.
25:385.
33. Dutton, H.J., Butterfield, R.O., and Rothstein, A. 1966.
Anal. Chem. 38:1773.
34. Paper presented at the 1992 AOCS Annual Meeting, Toronto, Canada, May 10–14,
1992. Session EE,
INFORM 3:499.
35. Dutton, H.J., and Mounts, T.L. 1964.
J. Catal. 3:363.
36. Butterfield, R.O., and Dutton, H.J. 1964.
Anal. Chem. 36:903.
37. Falkner, F.C. 1977.
Biomed. Mass Spect. 4:66.
38. Self. R. 1979.
Biomed. Mass Spect. 6:361.
39. Holman, R.T., Pusch, F., Svingen, B., and Dutton, H.J. 1992.
Proc. Natl Acad. Sci. USA
88:4830.
16 H.J. Dutton
0935315586-ch01.qxd 12/5/05 2:03 PM Page 16
Copyright © 1995 AOCS Press
Chapter 2
Factors Affecting Oil Quality and Stability
Thomas H. Smouse
Oil and Lecithin Process Research, Archer Daniels Midland Company, Decatur, IL USA.
Quality and Stability Importance
Oil quality is the present state of oil acceptability, while its stability is its resistance
to future changes. These characteristics can be physical, such as color, viscosity, or
crystal structure, as well as chemical, such as hydrolysis, oxidation, flavor, or poly-
merization. In the last 20 years, with interest in the nutritional value of fats and oils
on the rise and their recognized importance with atherosclerosis, cancer, arterial
plaque, and other health aspects, more concern has been directed to the quality and
stability of fats and oils. For the human body, as well as other animals, fats and oils
are the major caloric source of energy for sustaining life.
This chapter will review the various factors that are known to affect the quality
of fats and oils as they are being processed, as well as, known factors that can affect
their postproduction stability. In addition to additives, such as antioxidants,
antifoam agents, emulsifiers, and crystal inhibitors that can play a direct role in
quality and stability, various processes are covered that can play an indirect role,
especially in the stability of the product after it leaves the production facility.
Fats and oils have been a major caloric source of the human race since its begin-
ning. As prosperity increases and countries develop, the consumption of fats and oils
increase. Today, their quality and stability have never been better but, as in most ares
that can affect life and good health, I am sure improvements will be made so that in
the future even better products will appear on the market.
Introduction
Oil stability as defined by Webster is the resistance of oil to chemical change or to
physical disintegration. Quality is a peculiar or essential character and a general
term applicable to any trait or characteristic, whether individual or generic. In indus-
try, quality is normally what a consumer expects or accepts.
Therefore, the subject of “Factors Affecting Oil Quality and Stability” can mean
many things to various people. The characteristics listed in Table 2.1 are generally
included to evaluate the stability of an oil. Some of these characteristics overlap
with each other, while others are completely independent. For example, the flavor
and oxidative stability of a fat are independent variables which often are confused
Copyright © 1995 AOCS Press
18 T. H. Smouse
and considered to be the same characteristic. However, an oil can show excellent
oxidative stability and mediocre flavor stability. A good example of this would be
the comparison of cottonseed and soybean oils (SBO). Both can be processed to
have an excellent flavor with a flavor grade of at least 8.0 on a 10-point scale. When
oxidation rates of these two oils are compared either by gas-liquid chromatography
(GLC), Active Oxygen Method (AOM), Oxygen Stability Index (OSI), or differen-
tial scanning calorimetry (DSC), generally the SBO will show slightly better oxida-
tive stability. However, if the flavor stability of each is compared by either a Schaal
Oven at 63°C for several days or room temperature storage in the presence of nor-
mal light (75–100 fl-c/ft
2
or 705–940 lux), the cottonseed oil will show better fla-
vor stability.
The color of a refined, bleached, and deodorized (RBD) oil is normally very
light yellow. However, during processing, various components can affect the color
stability of the finished materials and can be a major quality characteristic in votat-
ed shortenings, cream filler fats, margarine base stocks, frying fats, and even liquid
salad oils. Some of the components known to affect color stability are pigments,
tocopherol, metals, phospholipids, and other trace materials which must be remove
during processing.
Hydrolytic stability is normally not a problem in vegetable fats. In triglycerides
with shorter chain fatty acids than palmitic and stearic, such as coconut oil, palm
kernel oil, and dairy fats, hydrolysis of the fatty acid from the triglyceride will pro-
duce strong off-flavors such as cheesy, goaty, and soapy flavors. Such flavors will
normally not be desirable in many finished food products. During frying, fatty acids
are formed by hydrolysis and oxidation causing problems with flavor, smoke point,
and thermal conductivity. In addition to heat, water and oxygen can cause fatty acids
to form, a food system be free of lipase to prevent enzymatic hydrolysis.
Resistance to the formation of foams is a desirable characteristic of frying fats.
As frying time is increased, polar and polymer compounds are formed, and the fat
will eventually foam. If proper management of the frying fat is not practiced, even-
tually the fat will foam out of the fryer causing burns and be a potential source of
oil fires. Therefore, a frying fat should have excellent foam stability. However, in the
case of a baking shor
tening, emulsifiers are added to the shortening to increase its
foaming action, so cak
e volume can be regulated. In these types of applications,
foam is desirable. Unquestionably, a frying fat and an emulsified cake shortening
should never be mixed, since both have been processed for optimal performance in
their respective applications.
TABLE 2.1
Types of Oil Stability
Oxidative Foam Light
Flavor Emulsion Enzymatic
Color Crystal
Hydrolytic Heat
Copyright © 1995 AOCS Press
Oil Quality and Stability 19
Emulsion stability is an important characteristic in such foods as peanut butter,
salad dressings, mayonnaise, and margarine, where a change in the emulsion can
affect the texture or the mouth-feel of the product. Similar observations can be made
with crystal stability. A gritty-sandy texture can result in icings made from filler fats
and shortenings, in which the crystals have not been stabilized by tempering.
Heat stability is normally an important characteristic of frying fats as the fat
polymerizes during frying, poor thermal conduction occurs, interfering with frying
life. As polymers are formed, foaming from the release of water in the fried food
occurs causing problems with proper deep fat frying operation.
Consumers like to see products that they purchase. For this reason, most prod-
ucts are packaged in a container that allows visual inspection. However, this in turn
allows visible light to reach the product that can cause off-flavors to develop from
oils with poor light stability. For example, SBO or low-erucic rapeseed oil (canola)
in the presence of light will develop what has been termed reversion flavor. This is
a green, grassy, weedy, hay-like flavor in its early stages of development which later
changes to melon, fishy, and painty flavors. Although it is believed that the com-
pounds responsible for these flavors are oxidation products of oil, many times these
flavors are observed when the oxidation is undetectable or barely measurable by
methods commonly used to detect oxidation. On the other hand, oils such as cot-
tonseed, safflower, peanut, or corn will oxidize in the presence of oxygen but not
develop reversion flavor in the presence of light. Therefore, if a food product such
as a potato chip or corn chip is exposed to short-wavelength light, it is desirable to
use a frying fat with excellent light stability.
Although at present there are many ways to affect the stability of a fat or oil, in
the future new findings may lead to methods that are at present unknown. The fac-
tors or components listed in Table 2.2 affect stability and will be discussed in later
sections of this chapter. Although an edible RBD oil is mostly composed of triglyc-
erides, the other components given in Table 2.3 are sometimes present and must be
removed during refining to yield an acceptable, stable product that finds many uses
in the consumer market. Although many unit processes were designed to remove
one type of material, when one follows the process closely, other components can
be affected that can have an effect upon oil quality and stability.
TABLE 2.2
Factors or Components Affecting Oil Stability
Phospholipids Oil storage
Soaps Deodorization time and temperature
Enzymes Deodorization cool-down rates
Metals Fatty acid composition
Antioxidants Pigments
Seed storage Light
Copyright © 1995 AOCS Press
20 T. H. Smouse
Oilseeds
To produce a good quality SBO, it is important to start with sound beans. The nutri-
tionally desirable unsaturated acids in SBO are sensitive to oxidation and polymer-
ization, which will produce undesirable flavors as well as off-colors. Any type of
damage to the soybean can result in an oil with poor quality characteristics.
Lipoxygenases, phospholipases, and lipases that are normally present in soybeans
are in an inactive state in the sound bean. However, frost damage, wet beans, or
cracked and ruptured beans will activate these enzymes, resulting in the production
of undesirable materials. Apparent bean characteristics that are known to affect oil
quality are the following.
1. Frost or immature beans—An early frost or harvesting green beans will yield
high levels of chlorophyll in the oil. Such oil requires more extensive bleach-
ing, resulting in poor oxidative stability.
2. Ground damage or moldy beans—Wet beans will have higher amounts of
enzyme damage, resulting in oil with a musty odor and higher levels of nonhy-
dratable phospholipids.
3. Split beans—Ruptured beans will have active enzyme systems, resulting in oil
that has higher free fatty acids, more nonhydratable phospholipids, and more
oxidation by-products.
Processing
In order to produce edible oils, all oilseeds undergo similar unit processes. However,
not all oilseeds are treated exactly alike. For example, cottonseeds must be delinted,
while soybeans are dehulled. Some seeds, such as olives, are pressed. Others, such
as corn, are expelled and extracted, while soybeans are almost exclusively extract-
ed. Nevertheless, it is important to use good quality, sound seeds if a good quality
oil is to be made. If the seed has been damaged by heat, wet weather, floods, poor
storage, or other damaging conditions, then the crude oil obtained from these dis-
tressed seeds will need more processing, and the finished refined, bleached and
deodorized (RBD) oil normally will not have the excellent stability characteristics
shown in Table 2.1.
TABLE 2.3
Components of an Edible Oil
Triglyceride Pigments
Diglyceride Oxidized materials
Monoglyceride Waxes
Fatty acids Moisture
Phospholipids Metals
Gums Proteins
Sterols Glycolipids
Copyright © 1995 AOCS Press