stress intensity factors due to residual stresses in t-plate welds
Bạn đang xem bản rút gọn của tài liệu. Xem và tải ngay bản đầy đủ của tài liệu tại đây (207.56 KB, 8 trang )
February 20, 2004 18:7
STRESS INTENSITY FACTORS DUE TO RESIDUAL STRESSES IN T-PLATE WELDS
Noel P. O’Dowd, Kamran M. Nikbin
Department of Mechanical Engineering
Imperial College London
South Kensington Campus, London SW7 2AZ
United Kingdom
Email:
Hyeong Y. Lee
Korea Atomic Energy Research Institute
Dukjindong 150 Yuseong
305-606, Korea
Robert C. Wimpory
JRC-European Commission Institute for Energy
Westerduinweg 3
1755 LE, Petten
The Netherlands
Farid R. Biglari
Department of Mechanical Engineering
Amirkabir University of Technology
Hafez Avenue, Tehran
Iran
ABSTRACT
Residual stress distributions in ferritic steel weldments have
been obtained using the neutron diffraction method. It is shown
that the transverse residual stress distribution for different plate
sizes and yield strength are of similar shape and magnitude when
normalised appropriately and peak stresses are on the order of
the material yield strength. The resultant linear elastic stress in-
tensity factors for these stress distributions have been obtained
using the finite element method. It has been shown that the use of
the recommended residual stress distributions in UK structural
integrity procedures leads to a conservative assessment. The
stress intensity factors for the welded T-plate have been shown
to be very similar to those obtained using a smooth edge cracked
plate subjected to the same local stress field
NOMENCLATURE
a crack length
d distance between lattice planes
d
0
distance between unstressed lattice planes
E Young’s modulus
J J−integral
K Linear elastic stress intensity factor
K
I
Mode I stress intensity factor
K
II
Mode II stress intensity factor
Q weld heat input
r
0
estimate of size of weld plastic zone
W plate width
ε strain
λ neutron wavelength
θ diffraction angle
θ
0
diffraction angle for unstressed lattice planes
σ stress
σ
y
yield strength
ν Poisson’s ratio
INTRODUCTION
In this work, residual stress distributions in welded T-plates
are presented. The stress distributions have been measuring us-
ing the neutron diffraction method, which determines the stress
field directly from the measured elastic strains. A high strength
steel (designated SE 702, equivalent to the A517 Grade Q steel)
and a medium strength steel (BS EN 10025 Grade S355) have
been examined. The former has a yield strength of 700 MPa
and the latter has yield strength of 360 MPa. It has been found
that the transverse residual stress distribution for different plate
sizes and yield strength are of similar shape and magnitude when
normalised appropriately and peak stresses are on the order of
the material yield strength. The measured stresses are compared
with the distributions provided in UK safety assessment proce-
dures and the conservatism in the existing stress distributions is
1 Copyright
c
by ASME
assessed. The linear elastic stress intensity factors arising from
the residual stress distributions have also been determined using
the finite element method and the results compared with those
obtained from the stress distributions in the assessment proce-
dures. It is found that the K values obtained using the recom-
mended stress distributions are significantly conservative. The
conservatism is reduced somewhat if a residual stress distribu-
tion recently proposed for welded T-plates is used. The K values
for the T-plate have been compared with those obtained if the
weld attachment is ignored and the T-plate treated as a smooth
edge cracked plate. It is found that except for shallow cracks
(a/W ≤ 0.1) the difference between the two K values is negligi-
ble.
Weld Geometry
This paper focuses on the weld geometry shown in Fig. 1.
The weld was manufactured by Cresusot-Loire Industrie, France
(CLI) from an SE 702 steel (SE 702 is the CLI equivalent to the
A517 Grade Q steel.) The welding consumable used was Oer-
likon Fluxofil 42, which has a quoted yield stress and ultimate
tensile strength of greater than 690 MPa and 760-900 MPa re-
spectively. The weld is a full penetration MIG weld with a total
of 22 weld passes and a weld heat input of 3.6 kJ/mm was used.
An alternating depositioning sequence was used and the plates
were preheated to 100
◦
C to minimise distortion during the weld-
ing process. No post weld heat treatment was carried out on the
weld. The measured distributions in this weld will also be com-
pared with recent measurements on a medium strength T-plate
weld, [1] which has a similar geometry but different weld heat
input.
Neutron diffraction measurements were carried out to mea-
sure the stresses along a line at the weld toe through the plate
(line A–A in Fig. 1) on the centre line of the sample. The
three normal stress components (designated normal, transverse
and longitudinal, as indicated in Fig. 1) have been measured.
The measurements have been carried out at the NFL facility of
the University of Uppsala, Studsvik, Sweden. The total length of
the welded plate is 910 mm (see Fig. 1) but in order to carry out
the measurements a 13.5 mm slice of the weld was cut from the
plate.
The Neutron Diffraction Method
Diffraction methods for measuring residual stress can be
used to determine non-destructively the stress state inside a
sample, by measuring changes in lattice spacing from the ‘un-
stressed’ state. Neutrons have a penetration depth of several cm
in most metals allowing the stress state deep inside a sample to
be determined [2].
When illuminated by radiation of wavelength, λ, similar to
the lattice spacing, crystalline materials diffract the radiation as
~35
910
500
50
248
W = 50
~10
~8
A
A
×
××
×
Normal (y)
Longitudinal (
z
)
Transverse (
x
)
Figure 1. GEOMETRY OF SE702 T-PLATE WELD. ALL DIMENSIONS
IN MM (NOT TO SCALE).
distinctive Bragg peaks. If the angle, θ, at which a peak occurs
is measured, Bragg’s law can be used to determine the lattice
spacing, d,
2d sinθ = λ. (1)
If the un-stressed lattice spacing and diffraction angle, are d
0
and
θ
0
respectively, then the elastic strain, ε can be determined by the
differentiated form of Eq. 1, i.e.
ε =
d −d
0
d
= −(θ−θ
0
)cotθ. (2)
The stress, σ, may then be obtained from the linear elastic prop-
erties of the material and the measured elastic strain, ε, in the
relevant directions.
For this work the neutron diffraction measurements were ob-
tained on the instrument, REST, at the reactor source at Studsvik,
Sweden. The instrument uses a monochromator which produces
a single wavelength neutron beam from the polychromatic beam
emerging from the reactor. In order to obtain three mutually per-
pendicular stress components (transverse, longitudinal and nor-
mal stress) measurements were carried out with the specimen
orientated as in Fig. 1 (for the longitudinal and transverse elastic
strain) and rotated through 90
◦
in the plane of Fig. 1 (for the nor-
mal elastic strain). Reference measurements were made in the
parent material at an extremity of the sample to obtain the refer-
ence diffraction angle, θ
0
for the unstressed material. The strain
2 Copyright
c
by ASME
at a point is then measured relative to this ‘strain-free’ angle us-
ing Eq. 2. The three stress components are obtained from the
three normal strain components using Hooke’s law.
For a given neutron flux and diffractometer design the time
taken for a residual stress measurement is controlled by the dis-
tance travelled by the neutrons to enter and exit the steel (the
neutron path length) and the properties of the material being mea-
sured. In order to reduce the neutron path length, relatively thin
slices of the welds have been measured (13.5 mm). It has been
shown in [1] by comparison with hole drilling measurements on
a full thickness T-plate that, although such slicing reduces the out
of plane (longitudinal stress), it does not have a significant effect
on the in-plane (normal and transverse) stresses. A 2×2×2 mm
3
sampling volume was used and measurements were made at 28
locations across the specimen width. The 211 Bragg reflection
was chosen using a wavelength of 1.7
˚
A. This yielded a reflection
at approximately 2θ = 93.5
◦
C. The total measurement time was
approximately 72 hours (24 hours for each direction).
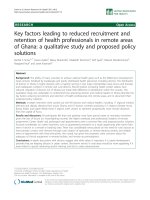
Results of Neutron Diffraction Measurements
Figure 2(a) shows the residual stress distributions obtained
for the T-plate. The experimental error bars indicated in the fig-
ure are due to the uncertainty in locating the diffraction angle
and is typically ±0.01 degrees. This converts to an uncertainty
in stress of approx. ±30 MPa. All other uncertainties are as-
sumed to be negligible. It is seen in Fig. 2(a) that the longi-
tudinal stresses remain high, even though a thin slice of weld
has been measured, indicating that the longitudinal stresses have
not completely relaxed. The magnitude of the peak transverse
stress is about 450 MPa (approximately 60% of the material yield
strength) and occurs at a distance, y, about 5 mm from the weld
toe. Close to the weld toe, all three stresses fall considerably—
the transverse stress at y = 1 mm is approx. 40 MPa (approx. 6%
of the yield strength). It is expected that the normal stress will
reduce to zero at the weld toe, due to the traction free conditions
there, but the relatively low longitudinal and transverse stress at
the toe is somewhat surprising.
Figure 2(b) shows transverse residual stress measurements
on a medium strength T-plate similar to the geometry examined
here but with three plate widths, W. The material used in this
case was a BS EN 10025 Grade S355 steel with average yield
strength 358 MPa. These stresses have previously been reported
in [1]. The measurement for the smallest (25 mm) weld is an
average of a number of neutron diffraction measurements at a
number of European facilities including Studsvik. In order to
make direct comparison between the distributions the distances
have been normalised by plate width, W. As discussed in [1],
it is seen that when distances are normalised by W, the stress
distributions are similar to one another. Note that in addition to
being of different plate thickness, these welds also have different
design (the smallest is a fillet weld,the largest a partially pene-
-200
-100
0
100
200
300
0 0 .2 0.4 0 .6 0.8 1
25mm(Average)
50mm
100m
ResidualStress(MPa)
NormalisedPosition(y/w)
Normalisedposition, y/W
-300
-200
-100
0
100
200
300
400
500
0 10.0 20. 0 30. 0 40. 0 50.0
Transverse
Longitudunal
Normal
ResidualStress(MPa)
NormalisedPosition(yw)
position, y (mm)
(a)
(b)
Figure 2. RESIDUAL STRESS DISTRIBUTIONS FOR T-PLATE WELDS
(a) HIGH STRENGTH STEEL PLATE, SE702 (b) MEDIUM STRENGTH
STEEL PLATE, Grade S355, OF VARIOUS SIZE, W.
trating weld).
In Fig. 3 a direct comparison between the measurements
for the two 50 mm welds (from [1] and from the current work) is
shown. It may be seen that when stresses are normalised by yield
strength the peak stresses are similar, though for the high strength
plate, the normalised stresses are significantly lower at the weld
toe. Further measurements will be carried out on this plate near
the weld toe using neutron and x-ray (synchrotron) diffraction to
investigate the stresses near the weld toe in more detail.
3 Copyright
c
by ASME
-0.4
-0.2
0.0
0.2
0.4
0.6
0.8
1.0
1.2
0.0 0.2 0.4 0.6 0.8 1.0
Normalised Position
y/W
Normalised residual stress,
σ
/
σ
y
BS7910
R6
Proposed upper bound
Grade S355
SE 702
Figure 3. MEASURED RESIDUAL STRESSES IN TWO 50 MM T-
PLATES. ALSO INCLUDED ARE APPROXIMATE STRESS DISTRIBU-
TIONS FOR WELDED T-PLATE
Approximation of transverse residual stress in T-plate
geometries
In [1] an upper bound (conservative) estimate for the trans-
verse stress in a T-plate weld was proposed as an alternative to
existing distributions in the failure assessment procedures, R6 [3]
and BS 7910 [4]. This distribution was obtained by taking a
Bayesian average of all the T-plate data for the medium strength
plate and fitting a bi-linear curve to the mean line. The curve
was then shifted upwards by 0.25σ
y
to provide the upper bound
shown by the dash line in Fig. 3. This curve is a bi-linear rela-
tionship starting from σ = σ
y
at the weld toe, y/W = 0, decreas-
ing to −0.05σ
y
at y/w = 0.275 and increasing to 0.5σ
y
at the
edge of the plate y/W = 1.0. Note that such a distribution will
not satisfy force and moment balance across the plate width.
In Fig. 3 a comparison of this distribution with the data for
the two 50 mm welded T-plates is provided. Also included in the
figure are the R6 [3] and BS7910 [4] transverse residual stress
distributions for welded T-plates. For a ferritic steel, the R6 dis-
tribution is given by a bi-linear distribution, with σ = σ
y
at y = 0
decreasing linearly to σ = 0 at y = r
0
=
122Q/σ
y
, where Q
is the weld heat input in kJ/mm. (The distance r
0
is an estimate
of the weld plastic zone in a ferritic steel weld [5]). For the two
welds shown in Fig. 3 the value of r
0
is 25 mm for the SE702
weld and 28 mm for the Grade 355 steel. Since these two val-
ues are very close a single R6 curve is plotted with r
0
= 26 mm.
Note that the validity range for the R6 distributions is for a yield
strength range of 375 MPa < σ
y
< 420 MPa so the weld in the
high strength steel falls outside this range. BS7910 provides two
transverse stress distributions for welded T-plates—a distribution
which has essentially the same form as the R6 distribution and a
polynomial distribution, which can be used if the weld heat input
is unknown. This latter distribution is given as
σ = σ
y
0.97+2.3267(y/W) −24.125(y/W)
2
+
42.485(y/W)
3
−21.087(y/W)
4
, (3)
and is plotted in Fig. 3 labelled BS7910.
It may be seen that the R6 and BS7910 distributions provide
conservative estimates of the residual strss and the proposed dis-
tribution provides a closer representation of the measured data
for the two weld geometries.
=
−
(ii)
(i)
(iii)
K
(i)
K
(ii)
= 0
K
(iiii)
=
−
Figure 4. SUPERPOSITION METHOD TO DETERMINE STRESS IN-
TENSITY FACTORS
Calculation of stress intensity factors for welded T-
plate
In service, cracks may form at the weld toe due to the stress
concentration there. Such cracks tend to be along the line A-A
in Fig. 1, i.e. normal to the transverse stress. A fracture as-
sessment for such a crack will generally require the linear elastic
stress intensity factor, K, due to the weld residual stress and any
additional primary (mechanical) loading. Previous work [6] has
determined the stress intensity factors in the medium strength T-
plate using the weight function for a T-plate geometry proposed
in [7]. However, the range of applicability of the weight func-
tion in [7] is restricted to somewhat limited weld geometries and
the T-plate of Fig. 1 falls outside this range. Therefore, in this
work the K value for cracks of different sizes at the weld toe due
to the weld residual stress have been determined using the finite
element method. Also determined for comparison are the stress
intensity factors for the stress distributions provided in R6 and
BS7910 and from the upper bound solution in [1].
4 Copyright
c
by ASME
In this work, the stress intensity factors for the cracked T-
plate have been calculated using superposition (see Fig. 4). As
illustrated in Fig. 4, to determine the value of K only the stress
distribution over the crack face is required, i.e. K
(i)
= −K
(iii)
.
For the current problem, the crack face loading is simply the
measured (or approximated) residual stress at the weld toe. The
approach taken here is analogous to the weight function method,
except for the fact that the K value from the crack face loading
is obtained directly using a finite element analysis, rather than
by using a weight function. Note that the use of superposition
assumes linear deformation and if the residual stress induces sig-
nificant amounts of plastic deformation, the true crack tip driving
force may be underestimated (or overestimated) by this method.
In [8] a modified J integral was developed to allow the stress
intensity factor due to a residual stress field to be determined di-
rectly. It was shown in [8] that, provided the plastic zone is small,
the K-value obtained using linear superposition is almost identi-
cal to that obtained from the J integral. This result provides con-
fidence in the application of the current approach. Note also that
in the R6 and BS7910 assessment procedures the linear elastic K
value is required for the analysis and the effect of plasticity on
the stress intensity factor due to the residual stress is accounted
for through an additional parameter (apart from an option 3/level
3 analysis where a full numerical analysis is required).
W
a
Figure 5. FINITE ELEMENT MESH USED IN STRESS INTENSITY
FACTOR CALCULATION
Finite Element Procedures
A typical finite element mesh, which contains 13,000 plane
strain four noded elements is illustrated in Fig. 5. The smallest
element size is 0.03 mm (6×10
−4
W). Because of the very dense
mesh near the weld toe the element boundaries are not visible in
this region of the figure. All calculations were carried out using
the commercial finite element software package, ABAQUS [9].
The fracture mechanics parameters J and K are calculated
from path independent integrals using the built in facilities of
ABAQUS. In [9], J is calculated using a standard domain integral
implementation and K is obtained using an interaction integral
approach (relevant only for a linear deformation). The advantage
of the latter approach is that for mixed mode problems, both the
mode I and mode II intensity factors, K
I
and K
II
respectively, are
calculated. For a mode I linear elastic problem K = K
I
can be
evaluated from J using the relationship (for plane strain),
K =
JE
1−ν
2
, (4)
where E and ν are the Young’s modulus and Poisson ratio re-
spectively.
Although focused meshes are preferred when K and J values
are required, [9], a very fine regular mesh is used in this work,
as it allows the variation of K with crack length to be examined
without changing the mesh design for each analysis. For one of
the crack geometries (a/W = 0.3) the value of K obtained using
the regular mesh of Fig. 5 was found to differ by less than 3%
from that obtained using a focused mesh.
Results of Finite Element Analysis
Results are first presented for a uniform crack face stress dis-
tribution as this provides insight into the general problem. Fol-
lowing this, the stress intensity factors for the measured and ap-
proximate stress distributions are presented.
Uniform stress distribution
Figure 6 shows the normalised K value obtained for a uni-
form stress along the crack plane (i.e. σ = σ
y
across the plate
width) for 0.1 < a/W < 0.7, where a is crack length (see Fig. 5).
The values plotted are the mode I stress intensity factors deter-
mined from the ABAQUS interaction integral. Typically, the K
values differ by no more than 2% over 25 domains and if the first
domain (nearest the crack tip) is ignored, the difference is less
than 1%. Similarly, if the first J domain is ignored, the J values
differ by no more than 1% over 24 domains.
Also included in Fig. 5 is the handbook solution for a single
edge notch specimen under tension loading (taken from [10]).
As well as providing confidence in the analysis, the very close
agreements between the two solutions indicates that the effect
of the weld and attachment on the stress intensity factor is neg-
ligible. The difference between the handbook solution and the
finite element solution for the T-plate ranges from approx. 7%
at a/W = 0.1 to approx. 2% at a/W = 0.7 and in all cases the
handbook solution overestimates the K value (it is conservative).
Note that this does not imply that for a general mechanical anal-
ysis, the T-plate can be replaced by an edge cracked plate. For
5 Copyright
c
by ASME
example, for remote tension loading, the weld toe will induce
a local stress concentration (approx. equal to 3.0 for this weld
geometry) which must be included when calculating the stress
intensity factor using the method of superposition. However, if
the stress distribution at the weld toe is known, as is the case here,
then (for a sufficiently deep crack) the stress intensity factor can
be calculated ignoring the weld and attachment. This issue will
be discussed further in the next section.
The K values plotted in Fig. 6 are the mode I values obtained
from an interaction integral. As the cracked T-plate is not sym-
metric (see Fig. 5), a small K
II
component is generated even for
a uniform tensile stress on the crack faces. The magnitude of K
II
ranges from 8% of K
I
at a/W = 0.1 to 0.1% at a/W = 0.7. (Note
that if the overall K value
|K| =
K
2
I
+ K
2
II
for the T-plate
is compared with the handbook solution for a single edge notch
tension geometry, the agreement is even closer than that seen in
Fig. 6).
0.0
1.0
2.0
3.0
4.0
5.0
6.0
0.1 0.2 0.3 0.4 0.5 0.6 0.7
normalised crack length (a/W )
normalised SIF,
K
/(
σ
y
√
W
)
T-plate
Smooth plate
(from [10])
Figure 6. NORMALISED MODE I K-VALUES FOR T-PLATE WITH A
UNIFORM STRESS DISTRIBUTION
Measured and representative residual stress distribu-
tions
As in the previous section, the stress intensity factor has
been obtained for seven values of crack size in the range, 0.1 <
a/W < 0.7. Figure 7 shows the results for the two measured
stress distributions in Fig. 3. The normalised results are indepen-
dent of the plate size and the material yield strength (assuming
linear elastic behaviour). It may be seen that despite the strong
similarity of the stress fields in the two welds in Fig. 3, the re-
duced magnitude of the stress near the weld toe in the SE702
plate leads to a significantly lower magnitude of normalised K
for all values of a/W. (The differences are smaller when the ab-
solute value of the stress intensity factors are plotted rather than
in normalised form since the yield strength of SE702 is almost
twice that of Grade S355).
0.0
0.1
0.2
0.3
0.4
0.5
0.6
0.1 0.2 0.3 0.4 0.5 0.6 0.7
normalised crack length (
a/W
)
normalised SIF,
K/
(
σ
y
√
W
)
S355
SE702
Figure 7. STRESS INTENSITY FACTORS FOR TWO MEASURED
STRESS DISTRIBUTIONS IN A WELDED T-PLATE
The stress intensity factors in Fig. 7 are next compared
to those obtained using a number of representative stress dis-
tributions. Four stress distributions have been examined—the
BS 7910 polynomial distribution, the bi-linear R6 distribution,
the proposed upper bound distribution and an approximate mean
stress distribution for the medium strength steel from [1]. The
latter distribution corresponds to the upper-bound stress distri-
bution reduced by 0.25σ
y
, i.e. the K value for this case will be
given by the upper bound K distribution minus 0.25 times the
distribution in Fig. 4.
The results of these analyses are presented in Fig. 8. It
may be seen that the R6 and BS7910 distributions provide sim-
ilar stress intensity factors. This is not surprising since over the
region of interest, 0 < y/W < 0.7 these distributions are very
similar (see Fig. 4). It may also be seen that the R6 and BS7910
distributions significantly overestimate the K value in the T-plate
(the data shown are for the medium strength T-plate, the conser-
vatism is even greater for the high strength plate). Similar con-
clusions were reached in [6] based on a weight function analysis
of the S355 T-plate. It is seen from Fig. 8 that for a/W = 0.1
the R6 distribution overestimates the K value in the 50 mm T-
plate by over 50%. The upper bound distribution is also quite
conservative, though less so than the BS7910 and R6 distribu-
tions (overestimates the K value in the 50 mm T-plate by approx
6 Copyright
c
by ASME
25%). The mean curve (dash line) is seen to be slightly non-
conservative (underpredicts the K value) for a/W < 0.6.
0.0
0.5
1.0
1.5
2.0
2.5
3.0
3.5
4.0
4.5
5.0
0.1 0.2 0.3 0.4 0.5 0.6 0.7
normalised crack size (a/W )
normalised SIF,
K
/(
σ
y
√
W
)
R6
BS7910
data
upper bound
mean curve
Figure 8. COMPARISON BETWEEN STRESS INTENSITY FACTORS
OBTAINED FROM MEASURED RESIDUAL STRESS DISTRIBUTION
AND FROM FOUR REPRESENTATIVE STRESS DISTRIBUTIONS
The above results were obtained from an FE analysis of the
T-plate geometry of Fig. 1. As discussed earlier, very small dif-
ferences were seen between the results obtained from the T-plate
geometry and the handbook solution for a smooth edge cracked
plate. Figure 9 shows the difference between the solution ob-
tained from an FE analysis of the T-plate geometry and the result
obtained using a mesh without the weld and attachment for the
R6 stress distribution. Similar trends have been seen for the other
distributions. Here the difference between the two results is cal-
culated as,
% diff =
K
smooth plate
−K
T-plate
K
T-plate
×100 (5)
It is seen from Fig. 9 that for all values of crack depth the esti-
mate from the smooth plate differs from the T-plate solutions by
less than 6% and overestimates the K value in the T-plate (i.e. it
is conservative) for all the cases examined. Thus, if the K value
is required for a T-plate of the type examined here, it can be es-
timated to a good approximation using a relatively simple edge
cracked finite element mesh.
0.0
1.0
2.0
3.0
4.0
5.0
6.0
0.1 0.2 0.3 0.4 0.5 0.6 0.7
a/W
% difference
Figure 9. PERCENTAGE DIFFERENCE BETWEEN K VALUES OB-
TAINED USING THE T-PLATE AND THAT OBTAINED USING A
SMOOTH EDGE CRACKED PLATE FOR THE R6 STRESS DISTRIBU-
TION.
Discussion
It is been shown that the residual stress distributions pro-
vided in existing structural assessment procedures can be very
conservative, leading to an overestimate of the stress intensity
factor of at least 50%. For the medium strength steel, which has
a high toughness (K
JIC
≈ 240 MPa
√
m from [6]) this is perhaps
not of great significance since the K value due to residual stress
is considerably less than the material toughness (for a/W = 0.1,
the K value for a 50 mm plate with σ
y
= 360 MPa from Fig.
8 is approx. 30 MPa
√
m). However, the fracture toughness of
the SE702 material is considerably lower—K
IC
data from [11]
indicate that the toughness lies between 100 and 150 MPa
√
m.
Thus the K value due to the weld residual stress is a significant
fraction of the fracture toughness of the material. This issue is
addressed in Fig. 10 where the K values obtained from the R6
and BS7910 distributions are compared to those obtained from
the measured distribution. It is seen that the K value from the
R6 and BS7910 distributions, even for the most shallow crack,
is close to the measured fracture toughness of the material and
would thus lead to a very non-conservative assessment. Frac-
ture testing of the SE702 steel is ongoing, both to confirm the
toughness values quoted in [11] and to examine failure loads in
T-plates containing residual stress.
Conclusions
Residual stresses in welded ferritic steel T-plates, deter-
mined using neutron diffraction, have been obtained. It is seen
that when stresses are normalised by yield strength and distances
7 Copyright
c
by ASME
0.0
50.0
100.0
150.0
200.0
250.0
300.0
5.0 10.0 15.0 20.0
crack size (mm)
K
(MPa
√
m )
BS7910
R6
S355 data
upper bound
Figure 10. COMPARISON OF ACTUAL K VALUES FOR THE SE702
T-PLATE WITH THE REPRESENTATIVE DISTRIBUTIONS
by plate width, the magnitudes of the residual stresses from dif-
ferent welded plates are similar. Stress intensity factors corre-
sponding to these residual stress field due to a crack of varying
size at the weld toe have been calculated. Values obtained us-
ing a smooth plate are within 6% of those obtained using the full
T-plate geometry. Existing representative residual stress distribu-
tions provided in safety assessment procedures are conservative
and overestimate the stress intensity factor by at least 50%. An
alternative stress distribution, proposed in [1] reduces this con-
servatism to approx. 30% for shallow cracks. It is seen that for
a high strength, relatively low toughness steel, these differences
can be significant in terms of a structural integrity assessment of
a welded T-plate.
ACKNOWLEDGMENT
The authors would like to acknowledge Dr. R. L. Peng and
Bertil Trostell at Studsvik for assistance with the neutron diffrac-
tion measurements. Financial support for this work has been pro-
vided by British Energy and in kind support by Arcelor, France.
REFERENCES
[1] Wimpory, R., May, P., ODowd, N., Webster, G., Smith, D.,
and Kingston, E., 2003. “Measurement of residual stresses
in t-plate weldments”. Journal of Strain Analysis, 38 (4),
pp. 349–365.
[2] ISO/TTA 3, 2001. Polycrystalline materials—
Determination of residual stresses by neutron diffraction.
ISO, Geneva, Switzerland.
[3] British Energy Generation Ltd, 2001. Assessment of the In-
tegrity of Structures containing Defects, R6 Rev. 4. British
Energy Generation Ltd, UK.
[4] British Standards Institution, 2000. Guide on methods for
assessing the acceptability of flaws in metallic structures,
BS 7910:1999 (Rev. March 2000),. British Standards Insti-
tution, London, UK.
[5] Leggatt, R., 1997. “Welding residual stresses”. In Proc. of
the Fifth Int. Conf. On Residual Stress (ICRS-5), pp. 12–
25.
[6] May, P., 2002. The Effect of Welding Residual Stresses on
the Fracture Resistance of Ductile Steels. PhD Thesis, Uni-
versity of London, London, UK.
[7] Niu, X., and Glinka, G., 2003. “Weld profile effect on stress
intensity factors in weldments”. International Journal of
Fracture, 38 (4), pp. 349–365.
[8] Lei, Y., O’Dowd, N., and Webster, G., 2000. “Fracture
mechanics analysis of a crack in a residual stress field”. Int.
J. Fracture, 106, pp. 195–216.
[9] Hibbitt, Karlsson & Sorensen, I., 2001. ABAQUS version
6.2.
[10] Webster, G., and Ainsworth, R., 1994. High Temperature
Component Life Assessment. Chapman and Hall, London,
UK.
[11] Talie-Faz, B., Dover, W. D., and Brennan, F. P., 2000. Static
strength of cracked high strength steel tubular joints. HSE
Offshore Technology Report 2000-078, University College
London.
8 Copyright
c
by ASME