Study on psba trnh dna barcoding characteristics in some species of polyscias genus (khóa luận tốt nghiệp)
Bạn đang xem bản rút gọn của tài liệu. Xem và tải ngay bản đầy đủ của tài liệu tại đây (699.06 KB, 50 trang )
VIETNAM NATIONAL UNIVERSITY OF AGRICULTURE
FACULTY OF BIOTECHNOLOGY
-------oOo-------
GRADUATION THESIS
“STUDY ON psbA-trnH DNA BARCODING
CHARACTERISTICS IN SOME SPECIES OF
POLYSCIAS GENUS”
Student
Nguyen Le Tra My
Department
Biotechnology
Supervisor
Huynh Thi Thu Hue, PhD.
Institue of Genome Research, VAST
Tran Thi Hong Hanh, MSc.
Vietnam National University of Agriculture
HANOI, 2021
COMMITMENT
I hereby declare that the work contained in this thesis has not been previously
submitted to meet requirements for an award at this or any other education institution.
To the best of my knowledge and belief, the thesis contains no material previously
published or written by another person except where due reference is made.
Signature:
Date:
i
ACKNOWLEDGEMENTS
This thesis, as any other, would be impossible to complete without kind support
from various people. First and foremost, I wish to express my greatest thanks to my
university, Vietnam National University of Agriculture (VNUA), and particularly
Biotechnology department. To overcome the those challenging years, I cannot forget
the advice and encouragements from all teachers in Microbiology department,
especially Ms. Tran Thi Hong Hanh. Without them, I wouldn't be able to get the
opportunity to begin my thesis.
Besides, I cannot help but mention the Institute of Genome Research (IGR),
Vietnam Academy of Science and Technology, where I carry out this research. The
sincerely thanks and regards goes to my principal supervisor, Ms. Huynh Thi Thu Hue,
for her relentless mentoring and encouragement. Her knowledge, as well as hugely
passion in science have enlighted me into the world of science, bring me valuable
guidances which enabled me to be the best version of myself. It is really my pleasure
to finish my work under her supervision.
Moreover, I would humbly extend my thanks to my friends and colleagues in
VNUA, as well as others in IGR laboratory which I cannot mention all of you. All the
never-ending arguments, enthusiasm cooperation, interesting questions and advice
taught me new lessons.
Last but not the least, I also acknowledge with a deep sense of gratitude for my
beloved family, for doubtless assistance both physically and mentally, so that I have
remained unwavering in my own path throughout the years.
Any omission in this brief acknowledgement does not mean lack of gratitude.
Once again, it is impossible to finish the work without your support, directly or
indirectly.
Hanoi, March 31, 2021
Student
Nguyen Le Tra My
ii
TABLE OF CONTENTS
COMMITMENT .................................................................................................... i
ACKNOWLEDGEMENTS .................................................................................. ii
LIST OF TABLES ................................................................................................ v
LIST OF FIGURES .............................................................................................. vi
LIST OF ABBREVIATIONS ............................................................................. vii
ABSTRACT ......................................................................................................... ix
CHAPTER 1: INTRODUCTION ......................................................................... 1
1.1.
DNA barcoding ......................................................................................... 1
1.2.
Polyscias genus ......................................................................................... 1
1.3.
Objectives .................................................................................................. 1
1.4.
Requirements............................................................................................. 1
CHAPTER 2: LITERATURE REVIEW .............................................................. 2
2.1.
DNA barcode ............................................................................................ 2
2.1.1. Basic features .............................................................................................. 2
2.1.2. Nuclear genome sequences ......................................................................... 3
2.1.3. Mitochondrial genome sequences ............................................................... 4
2.1.4. Chloroplast genome sequences ................................................................... 4
2.2.
Related studies to DNA barcode ............................................................... 4
2.2.1. Application DNA barcoding in plant ........................................................ 4
2.2.2. psbA-trnH region – Chloroplast DNA barcode ........................................ 6
2.2.
Related studies to Polyscias genus ........................................................... 9
2.3.1. Phytochemical ........................................................................................... 9
2.3.2. Biological activity ................................................................................... 10
2.3.3. DNA barcode in Polyscias genus ........................................................... 14
CHAPTER 3: MATERIALS AND METHODS ................................................ 14
3.1.
Time and location.................................................................................... 15
3.1.1. Time ....................................................................................................... 15
3.1.2. Location................................................................................................... 15
iii
3.2.
Materials .................................................................................................. 15
3.3.
Methods ................................................................................................... 15
3.3.1. DNA extraction ....................................................................................... 15
3.3.2. PCR amplification ................................................................................... 16
3.3.3. Purification .............................................................................................. 18
3.3.4. DNA sequencing ..................................................................................... 19
CHAPTER 4: RESULTS AND DISCUSSION .................................................. 19
4.1. DNA extraction ............................................................................................ 20
4.2. PCR amplification of psbA-trnH fragment .................................................. 21
4.3. DNA sequencing .......................................................................................... 23
4.4. Genetic distance and phylogenetic tree ........................................................ 30
4.1.1. Genetic distance ........................................................................................ 30
4.1.2. Phylogenetic tree ....................................................................................... 31
CHAPTER 5: CONCLUSION AND SUGGESTION ........................................ 32
5.1.
Conclusion............................................................................................... 33
5.2.
Suggestion ............................................................................................... 33
REFERENCES .................................................................................................... 34
Vietnamese references......................................................................................... 34
English references ............................................................................................... 35
iv
LIST OF TABLES
Table 2.1: Most relevant reports in pharmacological activities of Polyscias species ... 13
Table 3.1: Information about studied samples .............................................................. 17
Table 3.2: The psbA-trnH primer .................................................................................. 18
Table 3.3: Components of PCR reaction ....................................................................... 19
Table 4.1: OD values of five Polyscias samples .......................................................... 23
Table 4.2: Reference sequences list............................................................................... 26
Table 4.3: The polymorphism sites of gene psbA-trnH of 11 Polyscias species ......... 30
Table 4.4: Percentage identities among species ........................................................... 32
Table 4.5: Genetic distances (Pairwise method) ........................................................... 33
v
LIST OF FIGURES
Figure 2.1: The matrix of genetic information and taxonomic diversity, with DNA
barcoding and genomics .................................................................................................. 3
Figure 2.2: Procedure of DNA barcoding ....................................................................... 4
Figure 2.3: General structure organization of the chloroplast psbA-trnH intergenic
spacer ............................................................................................................................... 8
Figure 2.4: Polyscias balfouriana ............................................................................... 12
Figure 2.5 a: Dinh lang la tron: P. balfouriana (LT) .................................................... 15
Figure 2.5 b: Dinh lang la to: P. filicifolia (LTO) ......................................................... 15
Figure 2.5 c: Dinh lang la nho: P. fruticosa (LN) ......................................................... 15
Figure 2.5 d: Dinh lang la dia: P. scutellaria (LD) ....................................................... 15
Figure 2.5 e: Dinh lang la rang: P. serrate Balf (LR) .................................................. 15
Figure 4.1: Total DNA of five leaf samples of Polyscias genus . ................................. 23
Figure 4.2: Results of purification of five leaf samples of Polyscias genus ................. 25
Figure 4.3: Graphic view alignment of psbA-trnH from Polyscias ............................. 26
Figure 4.4: Maximum Likelihood tree of Polyscias based on psbA-trnH sequences ... 34
vi
LIST OF ABBREVIATIONS
Abbreviation
Meaning
BS
Bootstrap value
BLAST
Basic Local Alignment Search Tool
Bp
Base pair
COI
Cytochrome C oxidase
CpDNA
Chloroplast DNA
CTAB
Cetyl trimethyl ammonium bromide
DNA
Deoxyribonucleic acid
EDTA
Ethylenediamine tetracetic acid
IC50
The concentration that reduces growth by 50%
ITS
Internal transcribed spacer
ITS1
Internal transcribed spacer 1
ITS2
Internal transcribed spacer 2
Kb
Kilo base
M
Mol concentration
MCL
Maximum Composite Likelihood
matK
maturase K
min
minute
ml
milliliter
mtDNA
Mitochondrial DNA
NCBI
National Center for Biotechnology Information
nuDNA
Nuclear DNA
OD
Optical Density
PCR
Polymerase Chain Reaction
pH
Power of hydrogen/potential of hydrogen
psbA-trnH
tRNA Phenylanalinephotosystem II protein D1-tRNA Leucine
PVP
Polyvinylpyrrolidone
rbcL
ribulose 1,5-bisphosphate carboxylase large subunit
rDNA
Ribosomal DNA
vii
RNA
Ribonucleic acid
rpoB
beta subunit of RNA polymerase
rpoC1
RNA polymerase subunit C1
rpm
Round per minute
TAE
Tris – Acetate – EDTA
Tm
Melting temperature of an oligonucleotide
trnL-trnF
tRNA Leucine - tRNA Phenylanaline
µg/ml
Microgram/milliliter
µl
microlitre
viii
ABSTRACT
Polyscias is a flowering genus that belongs to the Araliaceae family, which is
commonly used for medical purposes and widely distributed over the world for its
economic value due to rich contents of phytochemical. DNA barcode is a robust
method to identify species and evaluate phylogenetic relationships. In this study, the
psbA-trnH region was used to investigate the relationship of five species of Polyscias
genus. The sequencing results showed that the psbA-trnH sequence has about 500
nucleotides as expected length. Raw data has been analyzed and these sequences were
compared to six reference sequences from NCBI. The phylogenetic tree of Polyscias
genus based psbA-trnH sequences with Tetraplasandra hawaiensis as out-group
species was conducted by bioinformatic tools. The combination between the genetic
distance method and Maximum-likelihood proposed high confidence results. All five
studied samples: P. balfouriana (LT), P. serrata Balf (LR), P. fruticosa (LN),
P. scutellaria (LD), P. filicifolia (LTO) were grouped into same clade, which had
close relationship with P. sp. Wen 10765 and P. austranliana with reliable bootstrap
supported (BS: 72). The psbA-trnH region has been proposed as suitable for DNA
barcoding studies. Thus, it would be considered widely used in further classification
studies.
ix
CHAPTER 1: INTRODUCTION
1.1. DNA barcoding
DNA barcoding is a modern biological tool for accurate, rapid, and automatable
species identification and phylogenetic reconstruction using only standardized piece of
DNA sequence. Regions are selected to be barcode is required to universally present in
target lineages and have adequate sequence variation to discriminate among species
(Hebert et al., 2003).
The short DNA sequence from a standard region of the genome is known as a
marker which is different for various species. For example, the most commonly used
marker for animal is Cytochrome C Oxidase 1 (COI), found in mtDNA. Another
suitable marker for fungi is the Internal Transcribed Spacer (ITS) rDNA. Chloroplast
DNA barcodes as matK, psbA-trnH, rbcL are used in plants (Kaur, 2015).
1.2. Polyscias genus
Polyscias is a genus of the Araliaceae family. This genus is widely distributed
over the world for economic value and commonly used for medical purposes due to its
rich contents of phytochemical. Some Polyscias species are not only functional but
also ornamental. Polyscias is named as two Greek words: “poly” means many and
“skia” means shade, which indicates the thick foliage characteristic of this genus
(Ashmawy et al., 2018). According to the investigation of Vietnamese Ginseng Center
in Southern provinces, Polyscias has 6 species: Polyscias fruticosa (L) Harm,
Polyscias balfouriana Bailey, Polyscias filicifoli (Merr et Fourn w) Bailey, Polyscias
guilfeylei var lacinita Bailey, Polyscias guilfeylei (Cogn et Marche) Bail, Polyscias
scutellarie (N.L.Burn) Fosberg (Nguyen Thuong Dong et al., 2007).
In this thesis, we carried out the research project: “Study on psbA-trnH DNA
barcoding characteristics in some species of Polyscias genus”.
1.3. Objectives
Studying on psbA-trnH DNA barcode to investigate the diversity of five
species of Polyscias.
1.4. Requirements
1. Amplification psbA-trnH fragment by PCR
2. Sequencing psbA-trnH fragment by Sanger Sequencing
3. Analysis and evaluating the diversity based on psbA-trnH sequence
1
CHAPTER 2: LITERATURE REVIEW
2.1.
DNA barcode
2.1.1. Basic features
DNA barcode is a fast and reliable method to classify species based on nucleotide
diversity of short DNA segments. Universality, specificity on variation, and easiness
on employment are remarkable features of a DNA barcode. This means that the region
considered as a barcode should be used for a wide range taxa, contains a sufficient
number of variations between different species but also ensures conservative
characteristics within species, thus variability in interspecies will be insignificant.
Therefore, an ideal marker should be routinely retrievable with a single pair of primers
and can be sequenced in two-dimensional which has fewer requirements for the
manual editing of sequence traces. Additionally, the gene sequences used for
barcoding must be short enough to facilitate PCR amplification. Generally, DNA
barcoding is based on the use of a short, standardized region that allows for costeffective species identification (Vijayan and Tsou, 2010).
There are four main factors in selecting a plant DNA barcode namely: universal
PCR amplification, range of taxonomic diversity, power of species differentiation,
bioinformatics analysis and application (Kress et al., 2008).
DNA barcoding is considered a modern and accurate method for identifying
organisms, using DNA regions in the nucleus, mitochondria, and chloroplasts (Nguyen
Van Viet et al., 2019).
Figure 2.1: The matrix of genetic information and taxonomic diversity, with DNA
barcoding and genomics (Kress et al., 2008)
2
Figure 2.2: Procedure of DNA barcoding (Abdul Bari Chowdhury, 2020)
2.1.2. Nuclear genome sequences
Barcoding based on the nuclear DNA segment is expected to provide more
information on species identity because of its biparentally inherited characteristic.
Until now, Internal Transcribed Spacer (ITS) regions of the ribosomal DNA (rDNA) is
the only nuDNA that has been tested for suitability as a barcode in plants (Vijayan and
Tsou, 2010). This region consists of one conserved 5.8S sequence and two variable
partitions namely ITS1, ITS2. Due to the convenience of PCR amplification, the ITS
regions are widely used for performing taxonomy analysis of the fungi, monocot, and
dicot. However, a quite complex evolution pattern is found in the ITS that relates to
the nuclear genome and causes difficulties for analysis (Huynh et al., 2018).
3
2.1.3. Mitochondrial genome sequences
Analysis in mitochondrial DNA (mtDNA) has had a greater impact on
phylogenetic studies in animals which have more studies than plant mtDNAs (Palmer
et al., 2000). The mitochondrial genome in plants is likely to be unstable for barcoding
due to its frequent intermolecular and intramolecular recombinations, which constantly
change gene orders (Palmer, 1992; Palmer et al., 2000). However, nucleotide
substitution rates of plant mtDNA are lower than chloroplast DNA, plant nuDNA, and
animal mtDNA about 3-4 times, 12 times, and 40–100 times, respectively (Cho et al.,
2004). There are a few mitochondrial markers showing promise for phylogenetic
purposes. The mitochondrial DNA cytochrome C oxidase subunit I (COI) gene is
commonly used for species identification of birds (Yoo et al., 2013), insects
(Hajibabaei et al., 2006), and fishes (Ward et al., 2005).
2.1.4. Chloroplast genome sequences
Barcode regions found in Chloroplast DNA have been used very frequently in plant
systematics and phylogenetic studies. The chloroplast genome has a highly conserved
structure, for example, it is relatively free of large deletions, insertions, single
nucleotide polymorphism (SNPs), transpositions, and inversions. This characteristic
makes it useful for studies about phylogenetic. Chloroplast DNA is relatively abundant
compared to nuclear DNA. In general, 50 chloroplast per cell multiplied with 50
cpDNA copy per chloroplast, while nuclear DNA is 2n. Therefore, DNA extraction
and analysis from cpDNA are more facilitate. Many noncoding cpDNA regions are
also useful targets of study such as the intergenic spacer of atpB-rbcL, matK, ndhF,
ycf6-psbM, psbM-trnD, rps16, rpL16 intron, trnL-F and psbA-trnH spacer by using
universal primers. For phylogenetic researches, cpDNA has been more utilized, than
the nuclear genome and mitochondrial genomes of animals for barcoding (Ali et al.,
2014).
2.2.
Related studies to DNA barcode
2.2.1. Application DNA barcoding in plant
DNA barcode is convenient and cost-effective for the plant taxonomist. The most
significant benefit of using DNA barcoding is the wide range of applicable plant
4
samples. This approach can be applied for DNA samples obtained from different parts
of the plant as leaf, root, and flower in various kinds of preservation conditions. The
taxon identification could be processed without a detailed description of morphology
by DNA barcode analysis. Besides, DNA barcode data could support the finding of
new species from a collection or confirmation of preserved plant materials (Huynh et
al., 2018).
In 2016, Stalin Nithaniyal and Madasamy Parani tested the effectiveness of three
chloroplast DNA barcodes (rbcL, matK, and psbA-trnH) and a nuclear DNA barcode
(ITS2) for the identification of Terminalia species. The inter-specific divergence was
highest in psbA-trnH, followed by ITS2, matK, and rbcL markers. The success rate of
species identification was 100% with psbA-trnH, 80% with matK and ITS2, and 10%
with rbcL. Therefore, they concluded that psbA-trnH was the best marker for species
identification in Terminalia L (Stalin Nithaniyal and Madasamy Parani, 2016).
In 2017, Huynh et al. used three difference markers: ITS1, matK, and trnL-trnF
DNA sequences to evaluate the systematic position of Ehretia asperula Zoll. &
Moritzi. Although there was limited research about Ehretia asperula’s phylogenetic
relationships, it is more easy and reliable to identify the taxonomic position of a
species by molecular markers. Their results showed that ITS1 was a potential DNA
barcode for identification since ITS1 was analyzed in most researches about
Ehreatiaceae in general and Ehretia species in specific. trnL-trnF, matK could not
differentiate between E. acuminata and E. thyrsiflora. Therefore, trnL-trnF and matK
are effective when using for higher taxon level or in combination with other markers
(Huynh et al., 2017)
In 2018, Huynh et al. identified a close relationship between five Huyen-sam
samples (Scrophularia L.) with the S. ningpoensis based on the combined sequence
data of ribosomal nuclear ITS, rbcL gene, and trnL-trnF intergenic spacer. The
utilization of ITS combined with the lower rates of evolution in plant plastids of trnLtrnF and effective results in separating of rbcL proposed as the standard method for
their study (Huynh et al., 2018).
In 2017, Yong Kang and his partners analyzed DNA barcoding and phylogenetic
relationships of tree species in tropical cloud forests. They examined the universality
5
of four DNA barcodes (rbcL, matK, psbA-trnH, and ITS), and evaluated their abilities
of species identification and phylogenetic construction in three tropical cloud forests.
Results of both PCR amplification and DNA sequencing indicated that psbA-trnH and
rbcL had higher success rates than matK and ITS. Therefore, rbcL and psbA- trnH
were universal for tree species in the tropical cloud forests. The efficiencies of species
identification of the four fragments were higher than 41.00% demonstrating that these
fragments had potential in species identification. When the random combination of
rbcL, matK, and psbA-trnH were conducted, it showed optimal evolutionary tree with
high supporting values in tropical cloud forests (Kang et al., 2017)
Barbi Gogoi and Brijmohan Singh Bhau evaluated abilities to discriminate in
Nepenthes genus of three barcoding loci: ITS, matK, and rbcL and its combinations.
Their results proposed that single-locus ITS and multiple-locus ITS+matK had high
rate of discriminating power in Nepenthes genus (Gogoi and Bhau, 2018).
DNA barcoding method has wide applications in many other fields such as
preserving natural resources, protecting endangered species, controlling agriculture
pests, identifying disease vectors, monitoring water quality, biomonitoring, and
ecological assessment.
2.2.2. psbA-trnH region – Chloroplast DNA barcode
2.2.2.1. Characteristics of psbA-trnH regions
The psbA-trnH region locates at intergenic (non-coding) region in chloroplast. This
region has recently become a popular tool for plant population genetics and specieslevel phylogenetics and has been proposed as suitable for DNA barcoding studies. The
psbA-trnH fragment includes three conserved regions and two variable regions. C1 is
the first conserved region located directly behind the stop codon of the psbA gene
(TAA) at 5’ region. It has a length of 41-63 bp. Next to the C1 region, there is a
variable region V1, which varies both in length and in nucleotide composition. It
consists of purine bases in some species and pyrimidines in others. By analyzing its
secondary structure, a portion of the V1 is found involved in the formation of a helix
by repeating inversion. Bases that form the polymorphic region do not participate in
the complementary interaction, and they form a hairpin loop. Therefore, variations in
6
the primary structure of the spacer have no or little effect on the stability of its
secondary structure. We found that the length of the hairpin stem is 19 to 41 bp.
Following the V1 region is the conserved site C2. C2 is a fragment of the inverted
repeat complementary to a fragment of the conserved region C1. Variable region V2 is
known as the highest variable length with 17-327 bp, and insertion and deletion
observed in psbA-trnH spacer are localized mainly in this region. With 4 or 5
nucleotides, the conserved C3 region is located directly adjacent to the trnH gene at 3’
region (Figure 2.3) (Degtjareva et al., 2012).
The psbA-trnH sequence has a high content of AT-bases about 69-77%, which is a
typical feature for noncoding regions of the chloroplast genome in general and this
spacer in particular. Since there are 75-bp conserved regions at the two ends of this
sequence, universal primers are easy to be designed to perform PCR amplification.
The psbA-trnH sequence has been successfully amplified in many plant species.
Therefore, it showed a powerful marker for discrimination. In 2005, Kress et al.
reported 92% of species had the length of the amplified psbA-trnH fragments from
340 to 660 bp, and retained a unique interval sequence, making this sequence live up
to the criteria as a barcode (Degtjareva et al., 2012).
Figure 2.3: General structure organization of the chloroplast psbA-trnH
intergenic spacer (Degtjareva et al., 2012)
2.2.2.2. Studies in the world
In 2009, Yao et al. identified Dendrobium species by using psbA-trnH marker. By
analyzing this region, scientists showed the interspecies percentages of nucleotide
differences in the psbA-trnH spacers of all 17 Dendrobium species, the percentages of
nucleotide differences between Dendrobium species and Bulbophyllum odoratissimum,
and the intraspecies percentages of nucleotide differences among the Dendrobium
species. The average percentage difference of Dendrobium psbA-trnH spacers was
7
1.2%, which was similar to the results of Lahaye R et al. (2008). Each Dendrobium
species was found to have a unique sequence in the psbA-trnH spacer, this will be
useful for identifying different Dendrobium species (Yao et al., 2009)
In 2010, Ma et al. used the chloroplast psbA-trnH intergenic region to identify
medicinal pteridophytes. Firstly, five DNA sequence markers (psbA-trnH, rbcL, rpoB,
rpoC1, and matK) were analyzed to determine whether DNA barcoding would be
effective for identification pteridophyte species, however, no universal primers could
be identified for the loci of rbcL, rpoB, rpoC1, or matK. Therefore, they proposed that
the only consensus primers available for wider pteridophyte taxa are those for psbAtrnH. In their study, the sequence of the psbA-trnH region can be determined with
both high efficiencies of PCR amplification and high success rate of sequencing.
Species discriminative power analysis showed that the TaxonGap and the Basic Local
Alignment Search Tool 1 (BLAST1) method could identify 90.2% of species
successfully. Thus, Ma concluded that psbA-trnH was a promising DNA barcode for
species identification in medicinal pteridophytes (Ma et al., 2010).
In 2016, DNA barcodes (ITS, ITS2, psbA-trnH, rbcL, matK, rpoB, and rpoC1)
were examined their ability to identify closely related species of the Artemisia genus in
Xinjiang, China by Geyu Liu et al. The results indicated that all the primers were
effective for PCR amplification and DNA sequencing. However, they proposed that
the rates of correct identification were significantly high for ITS, followed by ITS2,
psbA-trnH and, finally, rpoB, matK, rbcL, and rpoC1 performed poorly in this
evaluation. Therefore, they proposed the ITS, ITS2, and psbA-trnH regions as
powerful markers of species discrimination in the Artemisia genus. (Geyu Liu et al.,
2016).
In 2017, psbA–trnH region was studied to identify species of Physalis by Feng et
al. PCR amplification and sequencing of the psbA–trnH region was highly successful.
Results of both BLAST1 and nearest-distance methods indicated that the psbA–trnH
regions can be used to identify all species in their study. Besides, a distinct boundary
between species was demonstrated by phylogenetic analysis using psbA–trnH gene.
The results of relationship between species of Physalis and closely related species
were confirmed with previous studies. Therefore, they concluded that the psbA–trnH
region was an ideal DNA marker for species identification, as well as contributed to
the phylogenetic analysis of Physalis and its closely related species (Feng et al., 2017).
8
2.2.2.3. Studies in Vietnam
In 2016, the potential DNA barcodes including 18S, ITS, matK, psbA-trnH, and
rbcL were evaluated for their ability to distinguish between species across samples in
the genus Panax L by Le Thanh Huong and her partners. Multiple alignment results
showed that the 18S region had the highest level of average similarity, followed by
rbcL, matK, psbA-trnH, and ITS regions with lower levels of average similarities. The
phylogenetic trees showed the relationships among species with strongly supported.
Results of both comparison and phylogenetic tree proposed that the ITS region had a
highly reliable result, followed by the psbA-trnH sequence, allows distinguish Sam
Ngoc Linh from other ginseng species in the world. This result was also accordant
with previous studies of Wen and Zimmer,1996; Zuo et al., 2011; Vu Huyen Trang et
al., 2013. Thus, they concluded that of five investigated DNA regions, ITS, and psbAtrnH were the most promising barcodes for identifying species within the Panax L
genus (Le Thanh Huong et al., 2016)
Nguyen Van Viet et al. (2019) applied DNA barcoding method for the
identification of Gymnema sylvestre (Retz.) R.Br which is one of the medicinal plants.
Three DNA barcodes (psbA-trnH, trnL, and ITS1) proposed in this study belong to
chloroplast DNA and nucleus DNA. These barcodes were highly identifiable between
species and low variation within species (Chen et al., 2010; Pang et al., 2012). Their
results showed that the species-specific discriminatory ability of the psbA-trnH is the
highest, followed by ITS1 and trnL. Finally, the combination of psbA-trnH and ITS1
barcodes was proposed as a valuable DNA marker for Gymnema sylvestre (Retz.) R.Br
identification (Nguyen Van Viet et al., 2019)
In 2020, Ha Van Huan and his partner analyzed DNA barcodes (ITS, rbcL, psbAtrnH and ITS2) to identify Cupressus tonkinensis species. Four DNA barcodes were
amplified from the total DNA of Cupressus tonkinensis Silba by PCR reaction. After
sequencing, these sequences were compared with references in NCBI and found Cupressus
funebris which has the highest similarity with Cupressus tonkinensis Silba.
Therefore,
DNA barcode was a useful method to identify species (Ha Van Huan et al., 2020)
2.2.
Related studies to Polyscias genus
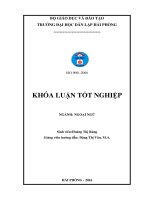
2.3.1. Phytochemical
Polyscias is one of the understudied genera of the Araliaceae family despite its rich
phytochemical contents. There are nine identified phytochemicals: saponins, sterols,
9
propanoic acid derivatives, lignans, cyanogen derivatives, phenolic compounds,
cerebrosides, polyacetylenes, and essential oils. Saponins are considered as the major
components of the Polyscias isolation. Species from the Araliaceae family and
particularly Polyscias genus are shown to be a significant source of triterpenes and
triterpene glycosides which are physiologically active and possess a broad range of
medico-biological action. An oleanolic acid aglycone core with glucuronic acid at the
C-28 position, together with many sugar units attached is usually found in Polyscias
saponins. Saponins have been discovered to possess interesting biological effects such
as cytotoxic activity as well as antibacterial, antifungal, and wound healing activities
(Ashmawy et al., 2019).
Figure 2.4: Polyscias balfouriana
2.3.2. Biological activity
Polyscias bear potential medicinal value including therapeutic activities as antiinflammatory, antitoxin, antibacterial, or diuretics (Vo et al., 1998). In regions of Asia,
the leaves of Polyscias species have been traditionally used as a tonic, antibacterial,
anti-inflammatory for digestive issues while the roots have functioned as a febrifuge,
anti-dysentery, diuretic for neuralgia and rheumatic pains. In traditional medicine,
obesity, mental illness, fever, malaria, and venereal infections were treated by P. fulva
(Sugimoto et al., 2017) while P. fruticosa has been reported to be used as tonic and
10
anti-inflammatory (Nguyen and Nguyen, 2007). Polyscias species revealed the
following functions: vulnerary and emetic properties for P. fruticosa; stimulant and
antiviral for P. cumingiana; stomachic, astringent, disinfectant properties as well as
ulcer treatment by P. scutellaria leaves. P. fulva were used as a tonic, aphrodiasic,
inflammation (Njateng et al., 2015; Njateng et al., 2017). Tran Thi Hong Hanh et al.
(2016) suggested the use of P. fruticosa and its major saponin for the prevention and
treatment of diabetes.
The biological activity of Polyscias species showed weak cytotoxicity,
molluscicidal and schistosomicidal activities as well as immuno-stimulant activity. In
addition, biological studies also demonstrated that Polyscias possesses antibacterial,
antifungal, immuno-stimulant, wound healing, anti-inflammatory and anti-oxidant
activities (Table 2.1).
Table 2.1: The most relevant reported pharmacological activities of Polyscias
species
Plant species
Extract/compound
P. dichroostachya
Leaves triterpenoidal
saponins
Polyactylenes from
leaves
P. fruticosa
Root extract
P. scutellaria
Leaf saponin extract
P. amplifolia
Oleanane saponins
polyfoliolides A and B
P. murrayi
New propanoic acid
derivatives (31-36)
P. guilfoylei
Leaf methanolic extract
Main pharmacological
activities
Molluscicidal activity
against the schistosomiasistransmitting snails
Biomphalaria glabrata
Antimicrobial activity
against gram positive cocci,
dermatophytes and candida
Immunostimulant
Increase memory function
and Increase life span in
mice
Increase wound healing and
Increase collagenation in
wounds
Weak cytotoxic activity
IC 50 6.7−10 μg/Ml
Tyrosine kinase inhibitor
(inhibit interleukin-2
inducible T-cell kinase)
References
Histamine release inhibition
Ashmawy et al., 2019
Gopalsamy et al, 1990
Lutomski et al., 1992
Bensita et al., 1999
Divakar et al., 2001
Chaturlvendula et al.,
2003
Buchanan et al., 2005
(Source: Ashmawy et al., 2019)
11
Table 2.1: The most relevant reported pharmacological activities of Polyscias
species (continued)
Plant species
Extract/compound
Main
References
pharmacological
activities
Biomass extract from
Antibacterial activity
bioreactor and callus
against staphylococcus
Furmanowa et al., 2002
aureus
P. filcifolia
Leaves and roots
Anti-inflammatory and
Divakar et al., 2010
saponin fraction
anti-oxidant activities
Biomass extract from
Antibacterial activity
Pereva et al., 2010
Cytotoxic activity
Macrewska et al., 2011
Immunostimulant
Divakar et al., 2005
cultivated cells
Dry shoots and leaves
saponin fraction and
cell biomass
Triterpenes from
Leaves and roots
Anti-asthmatic,
Leaf extract
antihistaminic, and
Asumeng et al., 2016
mast cell stabilization
Anti-osteoclastogenic
Leaf extract
activity (In vitro and
Tran et al., 2019
On vivo)
P. fulva
Saponin from leaves
Hypoglycemic activity
Luyen et al., 2018
Antibacterial activity
Leaf methanolic extract
against gram negative
Tankeo et al., 2015
bacteria
Antifungal activity
Stem bark extract
Njateng et al., 2015
Antidermatophytic
activity
Njateng et al., 2017
Antibacteria activity
(Source: Ashmawy et al., 2019)
12
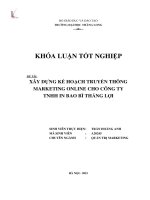
Figure 2.5 a: Dinh lang la tron:
Figure 2.5 b: Dinh lang la to:
P. balfouriana (LT)
Figure 2.5 c: Dinh lang la
nho : P. fruticosa (LN)
P. filicifolia (LTO)
Figure 2.5 d: Dinh
Fig 2.5 e: Dinh lang
lang la dia:
la rang:
P. scutellaria (LD)
13
P. serrate Balf (LR)
2.3.3. DNA barcode in Polyscias genus
In recent years, DNA barcoding method has been widely application to study
systematic and phylogenetic relationships among plant species. Although there are
many DNA barcode applications in Araliaceae family, Polyscias genus has a limited
research.
By combining data from both nuclear (ITS) and chloroplast (trnL-trnF) markers,
Plunkett and his partners confirmed phylogenetic relationships among Polyscias and
close relatives from the Western Indian Ocean Basin (Plunkett et al., 2004).
In 2012, the five DNA regions: matK, rbcL, psbA-trnH, ycf5 in the chloroplast
genome and ITS2 of nuclear ribosomal DNA were used to indentify species in the
Araliaceae family by Zhihua Liu. In five markers of their study, ITS2 and psbA-trnH
displayed the highest efficiency of PCR amplification. Zhihua Liu et al proposed
psbA-trnH with correct discrimination of 100% and 79.39% at genus and species,
respectively. ITS2 showed superiority in species discrimination with accurate
identification of 85.23% and 97.29% at the species and genus level, in that order.
Consequently, as one of the most popular phylogenetic markers, their study indicated
that ITS2 was a powerful barcode for Araliaceae authentication (Zhihua Liu et al.,
2012).
There are many species, which are very similar in morphology characteristics so it
is difficult to classify species and identify species base on morphology. Nowadays,
DNA barcode is useful method for identification. In 2019, Do Van Mai used rbcL
gene to determine the scientific name of Dinh lang la tron. The results obtained the
genomic sequence of this plant was similar to the sequences of P. balfouriana (Andre)
L.H.Bailey published on GenBank, up to 99%. Thus, using method of DNA barcoding
and analyzing morphological characteristics, the scientific name of “Dinh lang la tron”
has identified as P. balfouriana (Andre) L.H.Bailey, belongs to the Araliaceae family.
The scientific name of Dinh la tro as Polyscias guilfoylei (Cogn.&Marche) Bail was
identified in the same way using rbcL gene (Do Van Mai et al., 2020).
14
CHAPTER 3: MATERIALS AND METHODS
3.1.
Time and location
3.1.1. Time
The thesis has done from October 2020 to February 2021.
3.1.2. Location
All the experiments were performed at Institute of Genome research, Vietnam
Academy of Science and Technology
3.2.
Materials
Five leaf specimens of Polyscias genus were collected at Department of
Agronomy, Vietnam National University of Agriculture:
Table 3.1: Information about studied samples
No.
Code
1
LT
Polyscias balfouriana
Dinh lang la tron
2
LTO
Polyscias filicifolia
Dinh lang la to
3
LN
Polyscias fruticosa
Dinh lang la nho
4
LD
Polyscias scutellaria
Dinh lang la dia
5
LR
Polyscias serrata Balf
Dinh lang la rang
3.3.
Scientific Name
Vietnamese name
Methods
3.3.1. DNA extraction
Chemicals
Chemicals used for DNA total extraction: Buffer (100 mM Tris pH 8.0, 20 mM
EDTA pH 8.0, 1.4M NaCl, 1% PVP, 2% CTAB), 0.2% β-mercaptoethanol,
Chloroform: Isoamylalcohol (24:1), sodium acetate 0.3M, ethanol (100%), ethanol
(70%), Rnase.
Protocol
Before perform DNA extraction, buffer was prepared, and each 0.1g of five leaf
samples: LT, LTO, LN, LD, LR placed in sterile pestle and mortar was stored at -80℃
refrigerator overnight.
15