precipitation modeling and quantitative analysis
Bạn đang xem bản rút gọn của tài liệu. Xem và tải ngay bản đầy đủ của tài liệu tại đây (8.59 MB, 257 trang )
Precipitation Modeling and Quantitative Analysis
Springer Atmospheric Sciences
For further volumes:
/>Xiaofan Li • Shouting Gao
Precipitation Modeling
and Quantitative Analysis
Xiaofan Li
NOAA/NESDIS/Center for Satellite
Applications and Research
5200 Auth Road, Camp Springs,
MD 20746
USA
Shouting Gao
Laboratory of Cloud-Precipitation
Physics and Severe Storms
Institute of Atmospheric Physics
Chinese Academy of Sciences
Chaoyang District, Beijing 100029
China
ISBN 978-94-007-2380-1 e-ISBN 978-94-007-2381-8
DOI 10.1007/978-94-007-2381-8
Springer Dordrecht Heidelberg London New York
Library of Congress Control Number: 2011941660
© Springer Science+Business Media B.V. 2012
No part of this work may be reproduced, stored in a retrieval system, or transmitted in any form or by any
means, electronic, mechanical, photocopying, microfi lming, recording or otherwise, without written
permission from the Publisher, with the exception of any material supplied specifi cally for the purpose
of being entered and executed on a computer system, for exclusive use by the purchaser of the work.
Printed on acid-free paper
Springer is part of Springer Science+Business Media (www.springer.com)
To my wife Qin for her encouragement
and support
Xiaofan Li
To my wife Rongyu for her patience
and support
Shouting Gao
vii
Foreword
Precipitation is interlinked with atmospheric dynamics and thermodynamics through
the latent heat released during phase changes of water, and the heat absorbed during
the evaporation of precipitation. The nonlinear relationships involved with precipi-
tation processes coupled to atmospheric dynamics are major sources of uncertainty
for all prediction models. Floods caused by torrential rainfall, along with weather
hazards, cause enormous economic loss and affect livelihood around the world.
Understanding precipitation processes and how these interact with dynamics is a
vital step towards improving the skill of prediction models. This will help day-to-
day planning by individuals, longer-term decision making by institutions and gov-
ernments, and foster an improved relationship between science and society.
Improving our knowledge of precipitation processes requires the formulation of
quantitative relationships between microphysics, clouds, water vapor, latent heating
and dynamics. During the past 7 years, along with their research groups, Professor
Shouting Gao of the Institute of Atmospheric Physics in Beijing, China and
Dr.Xiaofan Li of NOAA’s National Environmental Satellite, Data, and Information
Service (NESDIS) have made considerable progress with precipitation modeling. In
number of publications they have derived diagnostic equations involving clouds, water
vapor and energy. They applied these equations to enhance our understanding how
water, atmospheric dynamics, cloud processes interact in precipitation systems.
This well-written book by Dr. Xiaofan Li and Professor Shouting Gao updates
and reviews precipitation modeling and quantitative analysis through the effects of
physical processes. Their approach is focused on two-dimensional precipitation
modeling of selected periods during the Tropical Ocean Global Atmosphere Coupled
Ocean-Atmosphere Response Experiment (TOGA COARE), the landfall of severe
tropical storm Bilis (2006), and pre-summer rainfall over southern China in 2008.
This includes the validation of numerical models against observations. They pro-
vide detailed derivations of the salient equations, along with quantitative analyses of
the effects of sea-surface temperature, vertical wind shear, cloud-radiation interac-
tion, and ice clouds on heavy rainfall. They evaluate the sensitivity of the numerical
models to uncertainties in the initial conditions, and describe basic concepts such as
precipitation effi ciency.
viii Foreword
The authors provide a solid foundation for the quantitative analysis of precipitation
processes and lay a basis for future three-dimensional precipitation modeling
pertinent to weather and climate.
Senior Scientist Mitchell Moncrieff
National Center for Atmospheric Research
ix
Introduction
Precipitation is one of the most important quantities in meteorology and hydrology.
Because fl oods resulting from torrential rainfall associated with severe weathers and
storms can cause tremendous economic loss, the accurate measurement and the
quantitative estimate and forecast of precipitation have signifi cant economic and
social implications in rainfall-rich countries. However, accurate estimate of surface
rain rate is diffi cult due to the fact that precipitation processes are nonlinearly asso-
ciated with the dynamic, thermodynamic, cloud microphysical and radiative pro-
cesses. While many previous studies have contributed to the qualitative analysis of
precipitation processes, quantitative analysis of precipitation processes has seldom
been conducted simply because diagnostic precipitation equations associated with
heat and water vapor processes have not been available. Facing this challenge, in
2005, the authors combined water vapor and cloud budget to derive a water-vapor-
related diagnostic precipitation equation for quantitatively identifying dominant
water vapor and cloud processes associated with precipitation. In 2010, the authors
combined heat and cloud budgets to derive a thermal-related precipitation equation
for quantitatively identifying dominant thermal and cloud processes associated with
precipitation. This set of precipitation equations has been widely used to study the
effects of sea surface temperature (SST), vertical wind shear, radiation, and ice
clouds on torrential rainfall and diurnal cycle, precipitation effi ciency; the sensitiv-
ity of precipitation modeling to the uncertainty of initial conditions; and to develop
a new rainfall partitioning scheme.
The material in this book is based on our research work in the last 7 years. This
book starts with precipitation modeling with the two-dimensional version of the
Goddard Cumulus Ensemble Model and an evaluation of modeling with available
observations. The book details the derivation of precipitation equations and covers
many research aspects on the effects of sea surface temperature, vertical wind shear,
radiation, and ice clouds on rainfall in idealized cases without large-scale vertical
velocity, in a tropical rainfall case during the Tropical Ocean Global Atmosphere
Coupled Ocean-Atmosphere Response Experiment (TOGA COARE), and in
torrential rainfall cases associated with severe tropical storm Bilis (2006) and a pre-
summer rainfall event over southern China in 2008. The material in this book has
x Introduction
been used in part of a graduate course at the Graduate School, Chinese Academy of
Sciences, Beijing, China. Therefore, this book can be used as both reference and as
a textbook for graduate students, researchers, operational forecasters and those
whose research interests include precipitation modeling, analysis, and forecasts.
This book is comprised of nine chapters. Chap. 1 presents and evaluates precipi-
tation modeling with available observations. Chap. 2 gives detailed derivations of a
set of precipitation equations and their applications to the analysis of precipitation
processes in idealized rainfall cases and torrential rainfall cases in Bilis and pre-
summer rainfall events. Chap. 3 discusses tropical rainfall processes during TOGA
COARE. The effects of SST, vertical wind shear, ice clouds, and cloud radiative
processes on the development of rainfall are respectively discussed in Chaps. 4 – 7 .
Precipitation effi ciency is analyzed in Chap. 8 , and the sensitivity of precipitation
modeling to uncertainty of initial conditions is studied in Chap. 9 .
We would like to thank Dr. Mitchell W. Moncrieff, the senior scientist of the
National Corporation for Atmospheric Research who read the book draft and wrote
the preface for this book. Our sincere thanks also go to Dr. Wei-Kuo Tao at NASA/
Goddard Space Flight Center (GSFC), Professor Ming-Dah Chou at National
Taiwan University, and Professor Minghua Zhang at the State University of New
York, Stony Brook for providing the two-dimensional Goddard Cumulus Ensemble
(GCE) model, the radiative transfer code used in GCE model, and TOGA COARE
forcing data, respectively. We also thank Dr. Hsiao-Ming Hsu at the National Center
for Atmospheric Research and Prof. Xiaoqing Wu at the Iowa State University for
their comments, Drs. Fan Ping, Xiaopeng Cui, and Yushu Zhou at the Institute of
Atmospheric Physics, Chinese Academy of Sciences, Dr. Donghai Wang at the
China Meteorological Administration, Prof. Xinyong Shen at the Nanjing University
of Information Science and Technology, Dr. Jian-Jian Wang at the Goddard Center
for Earth Science and Technology, University of Maryland, Baltimore County, and
Mr. Yi Wang at the Jiangsu Weather Bureau for effi cient and productive research
collaborations, and Miss Di Li at the University of Pennsylvania Law School,
Philadelphia for editing this book.
We are also indebted to Dr. Robert K. Doe of Springer for his editorial efforts.
This work was supported by the National Key Basic Research and Development
Project of China No.2009CB421505, the National Natural Sciences Foundation of
China under the Grant No.40930950 and 41075043.
Camp Springs, Maryland, USA Xiaofan Li
Beijing, China Shouting Gao
xi
Contents
1 Cloud-Resolving Modeling of Precipitation 1
1.1 Cloud-Resolving Model 2
1.2 Weather Events and Large-Scale Forcing
for Precipitation Modeling 6
1.2.1 Experiment COARE 6
1.2.2 Experiment SCSMEX 6
1.2.3 Experiment BILIS 8
1.2.4 Experiment PSR 9
1.3 Comparison Between Simulations and Observations 9
1.3.1 Temperature and Specifi c Humidity 9
1.3.2 Surface Rain Rate 12
1.3.3 Refl ectivity 15
1.4 Equilibrium Simulations with Zero Large-Scale
Vertical Velocity 20
1.5 Comparison Between 2D and 3D Model Simulations 22
References 23
2 Precipitation Equations and Process Analysis 27
2.1 Precipitation Equations 27
2.2 Equilibrium Model Simulation with Zero Large-Scale
Vertical Velocity 32
2.2.1 Time-Mean Analysis 32
2.2.2 Analysis of Diurnal Variation 35
2.3 Simulation of Rainfall Event During SCSMEX 38
2.4 Simulation of Torrential Rainfall Event During
the Landfall of Severe Tropical Storm Bilis (2006) 40
2.5 Simulation of Pre-summer Heavy Rainfall Event
over Southern China in June 2008 58
References 60
xii Contents
3 Tropical Precipitation Processes 63
3.1 Model Domain Mean Analysis 63
3.1.1 Effects of Mean Hydrometeor Loss/Gain
on Mean Rainfall in the Presence of Mean
Water Vapor Convergence and Mean Local
Atmospheric Drying 64
3.1.2 Effects of Mean Local Atmospheric Drying/
Moistening on Mean Rainfall 71
3.1.3 Effects of Mean Local Atmospheric Drying/Moistening
and Mean Hydrometeor Loss/Gain on Mean Rainfall
in the Presence of the Mean Water Vapor Divergence 73
3.2 Grid-Scale Analysis 74
3.3 Tropical Rainfall Responses to the Large-Scale Forcing 82
3.4 Effects of Time-Dependent Large-Scale Forcing,
Solar Zenith Angle, and Sea Surface Temperature
on Time-Mean Tropical Rainfall Processes 92
3.5 Diurnal Cycle 101
References 108
4 Effects of Sea Surface Temperature 111
4.1 Introduction 111
4.2 Time-Mean Analysis 111
4.3 Analysis of Diurnal Variation 116
References 124
5 Effects of Vertical Wind Shear 125
5.1 Introduction 125
5.2 Effects of Vertical Wind Shear on Severe Tropical Storm Rainfall 126
5.3 Effects of Vertical Wind Shear on Pre-summer Heavy Rainfall 133
References 136
6 Microphysical and Radiative Effects of Ice Clouds 137
6.1 Introduction 137
6.2 Effects of Ice Clouds on Rainfall in the Simulations
with Zero Large-Scale Vertical Velocity 139
6.2.1 Time-Mean Analysis 139
6.2.2 Diurnal Analysis 141
6.2.3 Vertical Structures of Thermal and Water Vapor Budgets 150
6.3 Effects of Ice Clouds on Severe Tropical Storm Rainfall 159
6.4 Effects of Ice Clouds on Pre-summer Heavy Rainfall 166
References 172
7 Cloud Radiative Effects 175
7.1 Introduction 175
7.2 Radiative Effects of Water Clouds on Rainfall in the Simulations
with Zero Large-Scale Vertical Velocity 176
7.2.1 Time-Mean Analysis 176
7.2.2 Analysis of Diurnal Variation 178
xiii
Contents
7.3 Effects of Cloud Radiative Process and Cloud-Radiation
Interaction on Severe Tropical Storm Rainfall 187
7.4 Cloud Radiative Effects on Pre-summer Heavy Rainfall 199
7.4.1 Cloud Radiative Effects 199
7.4.2 Radiative Effects of Water Clouds 201
References 206
8 Precipitation Effi ciency 209
References 218
9 Sensitivity of Precipitation Modeling to Uncertainty
of Initial Conditions 219
9.1 Introduction 219
9.2 Sensitivity of Precipitation Modeling to Uncertainty
of Initial Conditions of Temperature, Water Vapor,
and Clouds 220
9.3 Sensitivity of Precipitation Modeling to Uncertainty
of Vertical Structures of Initial Conditions 225
References 234
Index 237
xv
Abbreviations and Acronyms
2D Two-dimensional
3D Three-dimensional
AIRS Atmospheric Infrared Sounder
AMSU Advanced Microwave Sounding Unit
ARM Atmospheric Radiation Measurement
CAPE Convective available potential energy
CFAD Contoured frequency with altitude diagram
COARE Coupled Ocean-Atmosphere Response Experiment
CMPE Cloud-microphysics precipitation effi ciency
EQ Equator
GCE Goddard cumulus ensemble
GDAS Global Data Assimilation System
GSFC Goddard Space Flight Center
HSB Humidity Sounder for Brazil
IFA Intensive Flux Array
IMET Improved Meteorological
IOP Intensive Observing Period
IR Infrared
IWP Ice Water Path
LFC Level of free convection
LSPE Large-scale precipitation effi ciency
LST Local standard time
LWP Liquid Water Path
MSPPS Microwave Surface and Precipitation Products System
NASA National Aeronautics and Space Administration
NCEP National Centers for Environmental Prediction
xvi Abbreviations and Acronyms
NESDIS National Environmental Satellite, Data, and Information Service
NOAA National Oceanic and Atmospheric Administration
PSU Practical salinity units
PV Potential vorticity
PW Precipitable water
RMPE Rain Microphysics Precipitation Effi ciency
RMS Root-mean-square
SCSMEX
South China Sea Monsoon Experiment
SST Sea surface temperature
TOGA Tropical Ocean Global Atmosphere
TMI TRMM Microwave Imager
TRMM Tropical Rainfall Measuring Mission
1
X. Li and S. Gao, Precipitation Modeling and Quantitative Analysis,
Springer Atmospheric Sciences, DOI 10.1007/978-94-007-2381-8_1,
© Springer Science+Business Media B.V. 2012
Precipitation has important impacts on people’s daily life and torrential precipitation
could bring tremendous losses in economy and cause fatalities. Thus, precipitation
always is one of the top priorities in operational forecast and scientifi c research.
Precipitation is a result of convective development under a favorable environment.
The unstable energy is accumulated with favorable environmental thermodynamic
conditions when the clouds and associated precipitation are absent. The release of
unstable energy drives the growth of clouds that eventually leads to precipitation.
The development of clouds and precipitation has important feedback to the environ-
ment by redistributing temperature, water vapor, and momentum via radiative, cloud
microphysical and dynamic processes. The precipitation processes are determined
by environment thermal and water vapor conditions through cloud microphysical
processes. The analysis of thermal, water vapor, and cloud microphysical budgets
will enhance understanding of precipitation, which is benefi cial to the improvement
of quantitative precipitation forecast. However, important information such as cloud
microphysical processes is not conventionally available, which make observational
analysis rather diffi cult.
The cloud-resolving models provide a practical tool for process studies associated
with surface rainfall processes (e.g., Gao and Li 2008a ) . The model has fi ne horizon-
tal resolution to simulate individual cloud and includes radiative and prognostic cloud
microphysical schemes to simulate cloud-radiation interaction processes (Sect. 1.1 ).
In this chapter, two-dimensional (2D) cloud-resolving model simulations of tropical
convective events during the Tropical Ocean Global Atmosphere Coupled Ocean–
atmosphere Response Experiment (TOGA COARE) (Experiment COARE; Gao and
Li 2008b ) and South China Sea Monsoon Experiment (SCSMEX) (Experiment
SCSMEX; Wang et al. 2007 ) , torrential rainfall event during the landfall of severe
tropical storm Bilis (2006) (Experiment BILIS; Wang et al. 2009 ) , and pre-summer
heavy rainfall event over southern China in June 2008 (Experiment PSR; Wang et al.
2010 ; Shen et al. 2011 ) will be discussed in terms of large-scale forcing (Sect. 1.2 ),
temperature, specifi c humidity, surface rain rate, refl ectivity, and cloud hydrometeor
mixing ratios (Sect. 1.3 ). Equilibrium simulations with zero large-scale vertical
Chapter 1
Cloud-Resolving Modeling of Precipitation
2 1 Cloud-Resolving Modeling of Precipitation
velocity are introduced in Sect. 1.4 . Comparisons between 2D and three-dimensional
(3D) simulations are discussed in Sect. 1.5 .
1.1 Cloud-Resolving Model
The cloud-resolving model was originally developed by Soong and Ogura ( 1980 ) ;
Soong and Tao ( 1980 ) for studying convection at the timescale of shorter than a day.
This model was signifi cantly improved by Tao and Simpson ( 1993 ) at the National
Aeronautics and Space Administration (NASA) Goddard Space Flight Center
(GSFC) and was modifi ed by Sui et al. ( 1994, 1998 ) for studying tropical convec-
tion and associated hydrological cycles at the timescale from weeks to months and
tropical equilibrium states. The model was named the Goddard cumulus ensemble
(GCE) model. The model includes prognostic equations for perturbation zonal ( u )
and vertical ( w ) winds, potential temperature ( q ), specifi c humidity ( q
v
), and fi ve
cloud hydrometeor mixing ratios. The 2D non-hydrostatic governing equations with
anelastic approximation can be expressed by
'1( ')
0,
uw
xz
r
r
∂∂
+=
∂∂
(1.1a)
'1
(2' '') (' ''''')
(')
,
ooo
puu
u
uu uu wu w u wu wu
tx z
cDD
x
r
r
qp
∂∂ ∂
=− + − + + −
∂∂ ∂
∂
−+−
∂
(1.1b)
'1
( ' ' ' ') (2 ' ' ' ' ')
(') '
( 0.61 ) ,
z
''
oo o
pvlww
o
w
uw u w uw ww ww ww
tx z
cgqqDD
r
r
qp q
q
∂∂ ∂
=− + + − + −
∂∂ ∂
∂
−++−+−
∂
(1.1c)
('') ' 1 '
('') '
,
oo
o
oo
cn
R
pp
u
uwww
tx xz zz
Q
Q
uwD
cc x z
q
qqq qq
rq
r
pp
∂∂ ∂ ∂ ∂ ∂
=− − − − −
∂∂ ∂∂ ∂∂
∂∂
++− − +
∂∂
(1.1d)
'''
'
''
'
'
()
1
,
oo
vvv
v
oo
vv
q
vv
vqv
qqq
uww wq
tzzz
Su w D
xz
uq q
xx
r
r
∂∂ ∂ ∂ ∂
∂
=− − − − −
∂∂ ∂∂∂∂
∂∂
−− − +
∂∂
(1.1e)
3
1.1 Cloud-Resolving Model
() ( )
1
,
cc c
qc qc
quq wq
SD
tx z
r
r
∂∂ ∂
=− − + +
∂∂ ∂
(1.1f)
()
1
() ,
rr
Tr r qr qr
quq
wwq S D
txz
r
r
∂∂
∂
=− − − + +
∂∂∂
(1.1g)
() ( )
1
,
ii i
qi qi
quq wq
SD
tx z
r
r
∂∂ ∂
=− − + +
∂∂ ∂
(1.1h)
()
1
() ,
ss
Ts s qs qs
quq
wwq S D
txz
r
r
∂∂
∂
=− − − + +
∂∂∂
(1.1i)
()
1
() ,
gg
Tg g qg qg
quq
wwq S D
txz
r
r
∂∂
∂
=− − − + +
∂∂∂
(1.1j)
where
20
1
,
cn I
I
Q CNP
=
=
∑
(1.2a)
7
1
,
qv I
I
SP
=
=
∑
(1.2b)
9
1
,
qc I
I
SCWP
=
=
∑
(1.2c)
12
1
,
qr I
I
SRP
=
=
∑
(1.2d)
9
1
,
qi I
I
SCIP
=
=
∑
(1.2e)
15
1
,
qs I
I
SSP
=
=
∑
(1.2f)
14
1
,
qg I
I
SGP
=
=
∑
(1.2g)
1
1
(),,(1)(),
(1 ) ( ), ( ), ( ),
(), (), (),
(), (), (),
(),
I v CND v REVP s DEP s SDEP o
s GDEP o s MLTS o s MLTG o
fSACW o fSFW o fGACW o
f IACR o f GACR o f SACR o
fGFR o fR
CNP LP LP LP L P T T
L P TT LP TT LP TT
LP T T LP T T LP T T
LP T T LP T T LP T T
LP T T LP
=− − <
−<−>−>
<< <
<<<
<−
d
d
(), (),
(), ( ) (),
( )),
ACS o f SMLT o
fGMLT o fIHOM oo fIMLT o
fIDW oo o
TT LP TT
LP T T LP T T LP T T
LP T T T
>− >
−> <−>
<<
(1.2h)
4 1 Cloud-Resolving Modeling of Precipitation
11
( , ,(1) ( ),(1) ( ),
,,),
I CND DEP SDEP o GDEP o
REVP MLTG MLTS
PPP P TT P TT
PP P
dd=−<−<
−− −
(1.2i)
(,, ,(), ,
,()
,(),
( )),
I SACW RAUT RACW SFW o GACW
CND IHOM oo IMLT o
IDW oo o
CWP P P P P T T P
PPTTPTT
PT TT
=− − − − < −
−< >
−<<
(1.2j)
(( ),, , ( ),
, ( ), ( ), ( ),
(),(),(),
( )),
I SACW o RAUT RACW GACW o
REVP RACS o IACR o GACR o
SACR o GFR o SMLT o
GMLT o
RP P T T P P P T T
PPTTPTTPTT
PTTPTTPTT
PTT
=> >
−>−<−<
−<−< >
>
(1.2k)
( ( ), ( ), ( ),
()
,(),( ),
( ), ( , )),
I SAUT o SACI o RACI o
SFI o GACI o IHOM oo
IMLT o IDW oo o DEP
CIP P TT P TT P TT
PTT P TTP TT
PTTPTTTP
=− <− <− <
−<− < <
−> <<
(1.2l)
( ( ), ( ), ( ),
(,
(),(),
(), , (),
(),(),(), (),
(), ())
)
,
I SAUT o SACI o SACW o
SFW o SFI o RACI o
RACS o GACS SMLT o
RACS o SACR o SDEP o MLTS o
IACR o WACS o
SP P T T P T T P T T
PTTPTTP TT
PTTP PTT
P TTP TTP TT P TT
PTTP TT
=< < <
<< <
−>−−>
−< < <−>
<− <
(1.2m)
(( ),( ),
()
,(),,
(),(),(),(),
(), (),(), (),
( )).
I RACI o GACI o
GACW o SACW o GACS
IACR o GACR o RACS o GFR o
WACS o GMLT o GDEP o MLTG o
SACR o
GP P T T P T T
PTTPTTP
P TTP TTP TTP TT
PTTP TTPTTP TT
PTT
=< <
<<
<<<<
<− > <− >
<
(1.2n)
and
81
1
1, only if 10 , ,
ci o
qq ggTTd
−−
=+><
(1.2o)
41
2
1, only if 10 , ,
sr o
qq ggTTd
−−
=+<<
(1.2p)
41
3
1, only if 10 , ,
ro
qggTTd
−−
=><
(1.2q)
41 41
4
1, only if 10 , 5 10 ,
sc o
qggq ggTTd
−− −−
=≤>×<
(1.2r)
Here, q
c
, q
r
, q
i
, q
s
, and q
g
, are the mixing ratios of cloud water, raindrops, cloud ice,
snow, and graupel, respectively; p = (p/p
0
)
k
, k = R/c
p
; R is the gas constant; c
p
is the
specifi c heat of dry air at constant pressure p , and p
o
= 1,000 hPa; T is air temperature,
and T
o
= 0°C, T
oo
= −35°C. L
v
, L
s
, and L
f
are latent heat of vaporization, sublimation,
5
1.1 Cloud-Resolving Model
and fusion at 0°C, respectively, and L
s
= L
v
+ L
f
. Q
R
in ( 1.1d ) is the radiative heating
rate due to convergence of the net fl ux of solar and infrared radiative fl uxes calcu-
lated by solar and thermal infrared radiation parameterization schemes (Chou et al.
1991, 1998 ; Chou and Suarez 1994 ) . The cloud microphysical terms in prognostic
cloud Eqs. 1.2h – 1.2n are calculated by single-moment cloud microphysical param-
eterization schemes (Lin et al. 1983 ; Rutledge and Hobbs 1983, 1984 ; Tao et al.
1989 ; Krueger et al. 1995 ) , which are defi ned in Table 1.1 . w
Tr
in ( 1.1g ), w
Ts
in ( 1.1i )
and w
Tg
in ( 1.1j ) are terminal velocities for raindrops, snow, and graupel, respec-
tively; overbar denotes a model domain mean; prime is a perturbation from model
domain mean; and superscript
o
is an imposed observed value. The model uses cyclic
lateral boundaries and has a horizontal domain of 768 km with 33 vertical levels, and
its horizontal and temporal resolutions are 1.5 km and 12 s, respectively. The top
Table 1.1 List of microphysical processes and their parameterization schemes
Notation Description Scheme
P
MLTG
Growth of vapor by evaporation of liquid from graupel surface RH84
P
MLTS
Growth of vapor by evaporation of melting snow RH83
P
REVP
Growth of vapor by evaporation of raindrops RH83
P
IMLT
Growth of cloud water by melting of cloud ice RH83
P
CND
Growth of cloud water by condensation of supersaturated vapor TSM
P
GMLT
Growth of raindrops by melting of graupel RH84
P
SMLT
Growth of raindrops by melting of snow RH83
P
RACI
Growth of raindrops by the accretion of cloud ice RH84
P
RACW
Growth of raindrops by the collection of cloud water RH83
P
RACS
Growth of raindrops by the accretion of snow RH84
P
RAUT
Growth of raindrops by the autoconversion of cloud water LFO
P
IDW
Growth of cloud ice by the deposition of cloud water KFLC
P
IACR
Growth of cloud ice by the accretion of rain RH84
P
IHOM
Growth of cloud ice by the homogeneous freezing of cloud water
P
DEP
Growth of cloud ice by the deposition of supersaturated vapor TSM
P
SAUT
Growth of snow by the conversion of cloud ice RH83
P
SACI
Growth of snow by the collection of cloud ice RH83
P
SACW
Growth of snow by the accretion of cloud water RH83
P
SFW
Growth of snow by the deposition of cloud water KFLC
P
SFI
Depositional growth of snow from cloud ice KFLC
P
SACR
Growth of snow by the accretion of raindrops LFO
P
SDEP
Growth of snow by the deposition of vapor RH83
P
GACI
Growth of graupel by the collection of cloud ice RH84
P
GACR
Growth of graupel by the accretion of raindrops RH84
P
GACS
Growth of graupel by the accretion of snow RH84
P
GACW
Growth of graupel by the accretion of cloud water RH84
P
WACS
Growth of graupel by the riming of snow RH84
P
GDEP
Growth of graupel by the deposition of vapor RH84
P
GFR
Growth of graupel by the freezing of raindrops LFO
The schemes are Lin et al. ( 1983 , LFO), Rutledge and Hobbs ( 1983, 1984 , RH83, RH84); Tao
et al. ( 1989 , TSM), and Krueger et al. ( 1995 , KFLC)
6 1 Cloud-Resolving Modeling of Precipitation
model level is 42 hPa. The vertical grid resolution ranges from about 40–200 m near
the surface to about 1 km near 100 hPa. The observed surface temperature and spe-
cifi c humidity over land and the observed sea surface temperature over ocean are
uniformly imposed on each model grid to calculate surface sensible heat fl ux and
evaporation fl ux. The model details can be found in Gao and Li ( 2008a ) .
1.2 Weather Events and Large-Scale Forcing
for Precipitation Modeling
1.2.1 Experiment COARE
The cloud resolving model in experiment COARE is forced by large-scale vertical
velocity, zonal wind, and horizontal advections derived using 6-hourly TOGA
COARE observations within the Intensive Flux Array (IFA) region from Professor
M. Zhang of the State University of New York at Stony brook and hourly SST at the
Improved Meteorological (IMET) surface mooring buoy (1.75°S, 156°E) from
Weller and Anderson ( 1996 ) , (Gao and Li 2008b ) . The model is integrated from
0400 Local Standard Time (LST) 22 December 1992 to 0400 LST 08 January 1993.
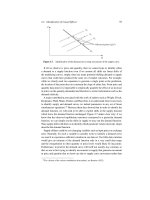
Figure 1.1 shows the time-height cross sections of the large-scale vertical velocity,
zonal wind, and the time series of SST from 0400 LST 22 December 1992 to 0400
LST 8 January 1993, which are imposed in the model. On 22–27 December 1992,
the strong upward motions with a maximum of 8 cm s
−1
are associated with westerly
winds of 10 m s
−1
. From 28 December 1992 to 2 January 1993, the downward
motions of −1 cm s
−1
occur while the westerly winds reach a maximum of 16 m s
−1
.
In the last few days, the moderate upward motions occur as westerly winds weaken.
Except for the last 4 days, the SST has only a weak diurnal variation with a slowly
decreasing trend.
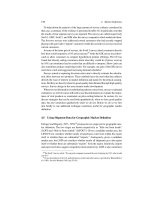
1.2.2 Experiment SCSMEX
The forcing (Fig. 1.2 ) averaged over the area of 16°–23°N, 116°–117°E using
6-hourly observational data from SCSMEX Intensive Observing Period (Johnson
and Ciesielski 2002) and daily-mean SST data (not shown) retrieved from NASA/
Tropical Rainfall Measuring Mission (TRMM) Microwave Imager (TMI) radio meter
with a 10.7 GHz channel (Wentz et al. 2000 ) are imposed in the model in Experiment
SCSMEX (Wang et al. 2007 ) . The model is integrated from 0200 LST 20 May to
1400 LST 24 May 1998. Downward motions occur in early morning of 20 May 1998,
followed by the strong upward motions around early afternoon of 20 May. The
upward motions continue to dominate the rest of the integration period, while they
are briefl y interrupted by a few downward motion events, in particular, in the mid and
lower troposphere. The southerly winds start to diminish with the strengthened
7
1.2 Weather Events and Large-Scale Forcing for Precipitation Modeling
northerly winds, which propagate downward. The southerly winds regain strengths
in the mid and lower troposphere on the last day of the integration period, although
the northerly winds remain strong in the upper troposphere.
Fig. 1.1 Time-height distributions of ( a ) vertical velocity (cm s
−1
) and ( b ) zonal wind (m s
−1
), and
( c ) time series of sea surface temperature (°C) observed and derived from TOGA COARE, which
are used in Experiment COARE as the large-scale forcing. Upward motion in ( a ) and westerly
wind in ( b ) are shaded (After Gao and Li 2008b )
8 1 Cloud-Resolving Modeling of Precipitation
1.2.3 Experiment BILIS
The reanalysis data from National Centers for Environmental Prediction (NCEP)/
Global Data Assimilation System (GDAS) that have a horizontal resolution of 1° × 1°
Fig. 1.2 Temporal and vertical distributions of ( a ) vertical velocity (cm s
−1
) and ( b ) meridional
wind (m s
−1
) during selected SCSMEX period, which are used in Experiment SCSMEX as the
large-scale forcing. Upward motion in ( a ) and southerly wind in ( b ) are shaded . The arrows above
( a ) indicate the analysis period in this study (After Wang et al. 2007 )