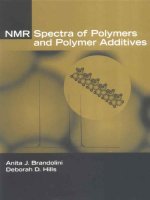
nmr spectra of polymers and polymer additives
Bạn đang xem bản rút gọn của tài liệu. Xem và tải ngay bản đầy đủ của tài liệu tại đây (14.01 MB, 660 trang )
Document
Page i
NMR Spectra of Polymers and Polymer Additives
Anita J. Brandolini
Deborah D. Hills
Mobil Chemical Company
Edison, New Jersey
file:///G|/download/www.netlibrary.com/nlreader/nlreader.dll@bookid=46838&filename=Page_i.html5/11/2006 8:23:10 AM
Document
Page ii
ISBN: 0-8247-8970-9
This book is printed on acid-free paper.
Headquarters
Marcel Dekker, Inc.
270 Madison Avenue, New York, NY 10016
tel: 212-696-9000; fax: 212-685-4540
Eastern Hemisphere Distribution
Marcel Dekker AG
Hutgasse 4, Postfach 812, CH-4001 Basel, Switzerland
tel: 41-61-261-8482; fax: 41-61-261-8896
World Wide Web
The publisher offers discounts on this book when ordered in bulk quantities. For more information,
write to Special Sales/Professional Marketing at the headquarters address above.
Copyright © 2000 by Marcel Dekker, Inc. All Rights Reserved.
Neither this book nor any part may be reproduced or transmitted in any form or by any means,
electronic or mechanical, including photocopying, microfilming, and recording, or by any information
storage and retrieval system, without permission in writing from the publisher.
Current printing (last digit):
10 9 8 7 6 5 4 3 2 1
PRINTED IN THE UNITED STATES OF AMERICA
file:///G|/download/www.netlibrary.com/nlreader/nlReader.dll@BookID=46838&FileName=Page_ii.html5/11/2006 8:23:11 AM
Document
Page iii
Preface
Polymers are all around us. We have grown accustomed to the ubiquity of synthetic materials in our
lives—in packaging, household products, clothing, and medical products, to name a few. When one also
considers the occurrence of natural polymers, such as paper, wood, cotton, and wool, the prevalence of
repetitive macromolecular structures becomes even more apparent. The identification and
characterization of such large molecules has become an important goal for manufacturers of consumer
goods, foods, pharmaceuticals, coatings, adhesives, and other products, as well as for plastics
producers. High-resolution nuclear magnetic resonance (NMR) spectroscopy is one of the chemist's
most versatile tools for characterizing molecular structure, and its application to polymer solutions has
provided unparalleled qualitative and quantitative information about these materials.
While the interpretation of NMR spectra of polymer solutions generally follows the same approach as
for smaller molecules, the characterization of commercial materials can be a more complicated task.
Chemical-shift calculations, spectral editing techniques, and comparison to published data can all be
used to assign the observed resonances, but a full explication of the spectrum often requires an
understanding of materials formulations as well. Many polymers exhibit inherent structural
complexities, such as stereoisomerism and comonomer incorporation, but commercial products are
often blends of two or more polymers and may include additives at relatively high concentrations. One
of our goals in collecting these spectra has been to provide not just a compilation of chemical-shift data
for nearly 300 polymers and polymer additives but also pragmatic advice relevant to acquiring and
interpreting NMR spectra of these materials. We hope that the result will be useful to NMR specialists
who need information about the spectral characteristics of polymers, and to polymer scientists who may
not be familiar with the subtleties of NMR.
In selecting the materials to be included in this compilation, we have striven first and foremost for
utility. They are, for the most part, the commercially significant polymers with the exception of those
that are insoluble, such as thermosetting resins. The data are predominantly
13
C spectra, but, where
useful, spectra of other nuclei (
1
H,
19
F,
29
Si, and
31
P) were recorded as well. With the exception of the
19
F data, all were acquired on our trusty JEOL GX400/Eclipse 400 spectrometer equipped with a 10-
mm broadband probe. Each entry is accompanied by molecular structure(s), peak assignments,
experimental parameters, literature references, and comments that include synonyms, trade names,
likely blend components and additives, important end uses, and other practical background information.
The polymers are grouped according to the chemical structure of the backbone (aliphatic hydrocarbons,
unsaturated hydrocarbons, ethers, esters and amides, and miscellaneous) and by the nature of any
pendant groups (aliphatic hydrocarbons, aromatic hydrocarbons, esters and amides, and miscellaneous).
Each chapter includes an introduction that surveys samples preparation, characteristic spectral features,
and typical analyses for the polymers in that group.
As with any work of this type, there are many people who contributed to our efforts. In particular, we
thank all those friends and colleagues who encouraged (or, in some cases, mercilessly nagged) us over
the years we have worked on this project. We extend our particular gratitude to Dr. Michael Frey of
JEOL USA (Peabody, MA), who recorded the
19
F spectra found in Chapter V. Our coworker, Patricia
Nelson, of Mobil Chemical, recorded the photomicrographs shown in Chapter I. Scientific Polymer
Products (Ontario, NY) donated many of the polyacrylates and methacrylates characterized in Chapter
IV, and Genesee Polymers (Flint, MI) most of the silicone materials in Chapter IX. Samples were
received from many of our
file:///G|/download/www.netlibrary.com/nlreader/nlReader.dll@BookID=46838&FileName=Page_iii.html5/11/2006 8:23:12 AM
Document
Page iv
former colleagues at Mobil Chemical's Edison Research Laboratory—Dr. Ellen Brandes, Dr. Robert
Duttweiler, Dr. Hitesh Fruitwala, Dr. Binnur Gunesin, Dr. Yury Kissin, and Dr. Michael Krause—and
from other associates: Dr. H. N. Cheng (Hercules), Professor Cecil Dybowski (University of Delaware),
Dr. Richard Eckman (formerly of Exxon Chemical), Jackie Morris (Ciba Specialties), Dr. Joe Ray
(formerly of Amoco), Dr. Nitu Sekhon (formerly of Montell), Dr. Mark Stachowski (University of
Connecticut), Dr. Laurie Weddell (DuPont), and Professor Adolfo Zambelli (Universitá di Salerno).
Helpful discussions with Dr. Connie Ace (Ethicon), Professor Frank Blum (University of Missouri–
Rolla), Dr. Laurie Galya (DuPont), and Professor Lon Mathias (University of Southern Mississippi) are
also acknowledged. The support of our management at Mobil Chemical's Edison Research Laboratory,
particularly of Dr. Herbert Spannuth, is greatly appreciated. Finally, we thank Moraima Suarez of
Marcel Dekker, Inc., for her helpful suggestions.
ANITA J. BRANDOLINI
DEBORAH D. HILLS
file:///G|/download/www.netlibrary.com/nlreader/nlReader.dll@BookID=46838&FileName=Page_iv.html5/11/2006 8:23:13 AM
Document
Page v
Contents
Preface iii
I. Introduction
1
II. Aliphatic Backbones: Aliphatic Pendant Groups
23
III. Aliphatic Backbones: Aromatic Pendant Groups
143
IV. Aliphatic Backbones: Carboxylic Acid, Ester, and Amide Pendant Groups
177
V. Aliphatic Backbones: Miscellaneous Pendant Groups
233
VI. Unsaturated Backbones
281
VII. Ether Backbones
317
VIII. Ester and Amide Backbones
361
IX. Miscellaneous Backbones
413
X. Polymer Additives
485
Appendix 1: Major End-Use Applications for Some Commercially Significant
Polymers
603
Appendix 2: Graphic Summary of
13
C Chemical Shifts for Common Polymers
611
Appendix 3: Some Suppliers of Polymers and Polymer Additives
617
Appendix 4: List of Abbreviations
627
Index
629
file:///G|/download/www.netlibrary.com/nlreader/nlReader.dll@BookID=46838&FileName=Page_v.html5/11/2006 8:23:14 AM
Document
Page 1
I—
Introduction
I.A—
Structure-Property Relations in Polymers
Plastic garbage bags, medical implants, textile fibers, bulletproof vests—these are just a few of the
diverse applications of modern polymeric materials [1]. This breadth of applicability is possible because
of the wide range of properties these substances can exhibit. Although the ubiquity of polymers has
largely resulted from the development of synthetic materials, natural macromolecules (cellulose and
derivatives and natural fibers, such as wool and silk) also continue to be important. Polymers, which are
composed of one or more repeating subunits called monomers, belong to a wide variety of chemical
classes: hydrocarbons, esters, amides, ethers, and others. The chemical identity and stereochemical
configuration of the long polymer molecules govern the intra- and interchain interactions that ultimately
lead to the bulk properties that suit the material to a specific use [2,3].
High-resolution nuclear magnetic resonance (NMR) spectroscopy of solutions has proved to be a
powerful aid in the structural characterization of all types of chemical compounds [4–7]. NMR is also
an invaluable tool for the qualitative and quantitative analyses of polymers, enabling description of
subtle molecular details. Spectra of either carbon or hydrogen nuclei are the most generally useful, but,
in appropriate cases, other nuclides (e.g., fluorine, phosphorus, silicon, or nitrogen) can provide
information not available from the more common nuclei [8,9]. The chemical shift is the NMR
parameter most often used for structure determination, although analysis of coupling patterns,
relaxation behavior, or nuclear Overhauser enhancements can supply additional details. The
multidimensional NMR approach [10–12] allows complex chemical structures to be described even
more fully by facilitating correlation of various spectral parameters. The applicability of NMR
spectroscopy extends even beyond chemical characterization, to the investigation of various physical
phenomena: kinetics, dynamics and morphology.
This introductory chapter will overview the application of high-resolution, solution-state NMR
spectroscopy to the study of polymers. Insoluble materials necessitate the use of special techniques,
such as dipolar decoupling and magic-angle spinning, to obtain a solid-state spectrum; these will not be
described here [13–16]. Structure-property relations will be discussed first, because they are a key to
defining the ultimate usefulness of the material. This introduction will show how NMR can help
elucidate these salient details of polymer molecular structure. Neither polymer science nor NMR
spectroscopy can be covered comprehensively in a few pages; the interested reader is referred to other
sources for further information on polymers [1–3], NMR [4–12], or more specifically, NMR of
polymers [17–23].
I.B—
An Overview of Polymer Structures
Commercially important synthetic polymers belong to many different classes of chemical compounds:
hydrocarbons, esters, amides, dienes, and so on. Polymers are products of a controlled chain reaction of
smaller molecules called monomers. Generally speaking, one can form polymers by: (1) opening a
multiple bond or ring; or (2) reacting difunctional monomers. The resulting molecules are long
(molecular weights can exceed 10
6
), and have final properties quite different from those of the
constituent monomers. These properties depend on details of molecular structure, such as
stereochemistry or degree of branching. By manipulating these details, the bulk properties of these
materials can be tailored to fit an intended application.
file:///G|/download/www.netlibrary.com/nlreader/nlReader.dll@BookID=46838&FileName=Page_1.html5/11/2006 8:05:58 AM
Document
Page 2
Figure I.1
Molecular architecture of of polymer
molecules: (A) linear; (B) branched; (C) cross-linked.
The overall molecular architecture of a polymer chain can be linear, branched, or cross-linked, as
shown in Figure I.1. Most linear and slightly branched materials melt and flow; these are called
thermoplastics. The cross-linked, or network, polymers are referred to as thermosets.
I.B.1—
Polymerization Reactions
One commercially important polymer produced by breaking multiple bonds is polyethylene (PE), which
is manufactured from gaseous ethylene:
I.A
This reaction can be initiated by either a free-radical generator (such as a peroxide) or by an
organometallic catalyst [1]. The free-radical process results in a highly branched polymer; catalytic
routes tend to produce a more linear material. Each form of PE has distinct properties that will be
discussed in detail in Section I.B.3. Many other familiar polymers [such polypropylene, polystyrene,
poly(vinyl chloride), and the acrylics] are made from unsaturated monomers in this way (see Chapters
II–V).
Polymers produced from dienes may retain some unsaturation. For example, polymerization of 1,4-
butadiene results in a polymer with residual unsaturation in the backbone (1,4 addition):
I.B
(both cis and trans) or with pendant vinyl groups (1,2 addition):
I.C
file:///G|/download/www.netlibrary.com/nlreader/nlReader.dll@BookID=46838&FileName=Page_2.html5/11/2006 8:06:00 AM
Document
Page 3
Not all dienes behave in this way, however. For example, on polymerization, 1,6-hexadiene forms in-
chain cyclopentyl rings:
I.D
with both cis and trans isomers.
A polymer that results from a ring-opening reaction is polycaprolactam (or, as more commonly known,
Nylon 6):
I.E
Polycaprolactam is classified as a polyamide, after the repeating amide linkage.
Another possible route to polyamides is a condensation reaction between two difunctional monomers,
such as hexamethylenediamine and decanedioic (sebacic) acid, which react to give poly(hexamethylene
decanediamide), or Nylon 6/10:
I.F
Other condensation polymers include polyesters and polyethers (see Chapters VI and VII). The
polymers that result from such reactions are usually linear, but their bulk properties can be varied by
changing the constituent monomers. For example, if hexanedioic (adipic) acid replaces nonanedioic
acid in reaction I.F, poly(hexamethylene hexanediamide), or Nylon 6/6, is produced:
I.G
which has a melting point fully 40°C below that of Nylon 6/10.
file:///G|/download/www.netlibrary.com/nlreader/nlReader.dll@BookID=46838&FileName=Page_3.html5/11/2006 8:06:01 AM
Document
Page 4
If monomers with tri- or higher functionality are used, the resulting polymer is a network, as in a urea–
formaldehyde resin:
I.H
for which the molecular weight is extremely high, approaching infinity. In general, these materials are
polymerized in situ (i.e., the monomers are mixed together where needed and allowed to react). Except at very
low molecular weights (MWs), these materials are insoluble in most solvents. Other examples of network
polymers are epoxies and melamine–formaldehyde resins.
I.B.2—
Chemical Structure of Polymers
The most fundamental molecular structural feature affecting polymer properties is the molecular weight
(MW). In most polymerization processes, termination steps occur somewhat randomly, leading to a statistical
distribution of chain lengths, which can be described by an average molecular weight and by a molecular
weight distribution (MWD) (Fig. I.2). The average MW can be calculated in several ways. The number-
average MW, M
n
, is given by:
where N
i
represents the number fraction of molecules of mass M
i
. The weight-average MW, M
w
, is defined as:
where W
i
is the weight fraction of molecules of mass M
i
. The ratio M
w
/M
n
, the polydispersity index, indicates
the breath of the MW distribution. Some polymerization processes lead to monodisperse distributions (i.e., all
chains are the same length), and for such systems, the polydispersity index is nearly 1.
Figure I.2
Molecular weight distribution curve.
file:///G|/download/www.netlibrary.com/nlreader/nlReader.dll@BookID=46838&FileName=Page_4.html5/11/2006 8:06:02 AM
Document
Page 5
The effect of MW on properties can be easily seen for the case of polyisobutylene (PIB):
I.I
which is a viscous liquid in its low-MW form and an elastomer (rubber) at higher MWs. The liquid
polymers are used as tackifying agents in the production of cling films, whereas the elastomers form the
basis of the butyl rubber used to make, among other things, O-rings and gaskets [1].
It is often the more subtle details of molecular structure, not simply the chemical classification or even
the molecular weight, that ultimately account for a material's bulk properties. For example, branched PE
has properties quite different from the linear form, and the density of branched PE is significantly less
than that of linear (0.90 g/cm
3
versus 0.95 g/cm
3
). In fact, branched PE is commonly called low-density
polyethylene (LDPE); the linear form, high-density polyethylene (HDPE).
Some polymer structures can exhibit either geometric or stereoisomerism, which also affects polymer
properties. For example, polybutadiene (PBd) has two major geometric isomers, the cis:
I.J
and the trans:
I.K
High-cis and high-trans content PBd are strikingly different materials. The high-cis form is a rubber at
room temperature, the high-trans form is crystalline, and a polymer chain containing approximately
equal amounts of both isomers is also elastomeric.
Another type of isomerism that strongly influences a polymer's properties is stereoisomerism, or
tacticity. This effect is especially important in polymers with the general structure:
I.L
where X can be any one of a number of pendant groups, such as a chlorine atom for poly(vinyl
chloride), a methyl group for polypropylene, or a phenyl ring for polystyrene. A simple ball-and-stick
drawing illustrates that a pair of pendant groups (designated by the black circle) may be situated on one
''side" of the polymer backbone in a meso (m) configuration:
file:///G|/download/www.netlibrary.com/nlreader/nlReader.dll@BookID=46838&FileName=Page_5.html5/11/2006 8:06:03 AM
Document
Page 6
I.M
or on alternate ''sides", in a rac meic (r) arrangement:
I.N
A length of the polymer chain may be viewed as a series of pairs, or dyads. Long sequences may be
isotactic (-mmmmmmm-):
I.O
syndiotactic (-rrrrrrr-):
I.P
or atactic (-rmmrrmr-):
I.Q
file:///G|/download/www.netlibrary.com/nlreader/nlReader.dll@BookID=46838&FileName=Page_6.html5/11/2006 8:06:04 AM
Document
Page 7
Polypropylene (PP) is a polymer for which the iso- and syndiotactic forms melt well above room
temperature (160 and 135°C, respectively). In contrast, the atactic form is soft and weak at room
temperature.
Yet another form of isomerism observed in some polymers is regioselectivity [17–21], the directionality
of addition along a polymer chain. Monomers such as vinyl fluoride can add in either a head-to-tail:
I.R
or in a head-to-head fashion:
I.S
In most such systems, the head-to-tail configuration is strongly preferred on steric grounds. The
structures of polymers with many head-to-head inversions are quite complex, because tacticity is
superimposed on regioirregularity, resulting in a myriad of structures: meso head-to-head, racemic head-
to-head, meso head-to-tail, and racemic head-to-tail.
Even more control over polymer characteristics can be achieved by production of copolymers, which
are made by reacting two or more different monomers called comonomers. The resulting polymer
structure may be blocky:
I.T
alternating:
I.U
or random:
I.V
or a second chain can be grafted onto the first:
I.W
Blocky and random copolymers are the most common. In block copolymers, the length of the block
segments can influence properties. In ''random" copolymers, the exact distribution of the comonomers
(called the sequence distribution) is a consequence of the polymerization conditions. The sequences can
be statistically random (Bernoullian), for which the distribution is a function only of the relative amount
of each comonomer, or they can deviate predictably from randomness
file:///G|/download/www.netlibrary.com/nlreader/nlReader.dll@BookID=46838&FileName=Page_7.html5/11/2006 8:06:06 AM
Document
Page 8
(Markovian), in which the identity of the next unit added is influenced by the identity of the
comonomer at the end of the growing chain [18].
I.B.3—
Physical Structure and Properties of Polymers
Although many of the physical properties of polymers are similar to those of lower-MW compounds,
others are unique to macromolecules and arise from their large size. Some polymer molecules
crystallize, others have amorphous structures, and still others possess combination, or ''semicrystalline"
morphologies. Thermal or mechanical treatment can alter these structures. This variety gives rise to
very complex thermodynamic behavior, with many materials exhibiting several different transition
temperatures. The chemical and physical structural features of a material also affect the way it can be
processed into a final product, as well as the mechanical properties that the product will have.
High- and low-density polyethylene (HDPE; LDPE) demonstrate the effect of molecular structure on
polymer morphology. Each is "semicrystalline," with both ordered (crystalline) and disordered
(amorphous) domains (Fig. I.3; 24). The layers (called lamellae) are made up of folded PE chains. The
regions around the lamellae are amorphous, composed of randomly coiled chains. The greater structural
irregularity of LDPE (because of its branches) inhibits crystallization, resulting in a material with a
higher proportion of amorphous chains, and with less perfectly formed crystals (Fig. I.4). Many
materials, such as atactic polystyrene, poly(methyl methacrylate), and polyisobutylene exhibit no
crystalline structure at all. Their chains all adopt the randomly coiled, amorphous conformation.
Polymer morphology gives rise to complex thermal behavior. For example, the more regular crystalline
domains of HDPE melt at 135°C; the less ordered crystallites of LDPE melt at 110°C. This melting
transition does not involve the amorphous regions of the material. Instead, amorphous polymers exhibit
a secondary transition characterized by the glass-transi-
Figure I.3
Electron micrograph of high-density polyethylene, showing well-defined lamellae.
(From Ref. 24.)
file:///G|/download/www.netlibrary.com/nlreader/nlReader.dll@BookID=46838&FileName=Page_8.html5/11/2006 8:06:07 AM
Document
Page 9
Figure I.4
Electron micrograph of low-density polyethylene, showing poorly defined lamellae.
(From Ref. 24.)
tion temperature T
g
. Below T
g
, the material is elastomeric; above T
g
, it is brittle. For example, at room
temperature, polyisoprene (natural rubber) is an elastomer; at liquid nitrogen temperatures, it shatters easily.
Not all T
g
s are subambient. Atactic polystyrene has a T
g
of 160°C; hence, it is brittle at room temperature.
Many different processing techniques are employed to turn polymers into useful products. Much of this
processing is done with the material in a fluid state (higher than T
m
for semicrystalline polymers or higher than
T
g
for glassy polymers). For example, during injection molding, molten polymer is first forced into a mold.
After cooling, the part is removed. Obviously, the polymer must flow easily and crystallize (solidify) rapidly to
be useful as an injection-molding resin. On the other hand, when a fiber is spun from the melt, the material
must not flow too easily, or the fiber's integrity will not be maintained during the spinning process. Because
fibers are also stretched as they are produced to align the molecules for improved strength, crystallization
should not occur too rapidly. These ''rheological" (flow) properties can be tailored by adjusting the molecular
structural parameters, such as molecular weight and MWD, or by incorporating an appropriate comonomer.
Polymeric materials exhibit complex behavior when they are subjected to stress, as shown in Figure I.5, which
displays a typical relation between stress and strain during elongation. Stress, σ, is the applied force/unit area;
strain, ∈, is the resulting change in length, l/l
0
. In the elastic region (A), there is a simple, linear relation
between σ and ∈:
where the proportionality constant E is known as the Young's or elastic modulus. In this part of the σ–∈ curve,
all deformation is recoverable (i.e., if the stress is removed, the material returns to its original length). An
elastomer exhibits this behavior up to the breaking point. On a molecular level, elastic deformation
corresponds to small displacements or conformational changes of chemical bonds. For a thermoplastic
material, such as PE, there is a "knee" in the σ–∈ curve, called the
file:///G|/download/www.netlibrary.com/nlreader/nlReader.dll@BookID=46838&FileName=Page_9.html5/11/2006 8:06:08 AM
Document
Page 10
Figure I.5
Stress–strain curve for a typical polymeric
material: (A)elastic region; (B) yield point;
(C) flow; (D) strain hardening; (E) failure point.
yield point (B), above which elongation requires relatively little additional force (i.e., the material
flows; C.). Above the yield point, morphological changes occur, with the crystalline regions reorienting,
aligning themselves along the stretch axis. This process continues until the stress can no longer be
accommodated by reorientation. The slope of the σ–∈ curve then increases again. The material
becomes more difficult to elongate, and strain-hardening sets in. Ultimately, the material cannot
withstand further stress (D).
The rather complicated behavior illustrated in Fig. I.5 results from a very simple type of uniaxial
applied stress. In real-world applications, polymeric materials undergo even more complex modes of
deformation: impact, bending, twisting, tearing. Tests have been devised to evaluate the effect of these
different types of mechanical stress. For example, polymers intended for applications requiring
toughness, such as appliance housings, are subjected to a dart-drop test to simulate the effect of a
sudden, sharp impact. Materials used in garbage bags, on the other hand, are checked for tear resistance,
by measuring the force required to propagate a small notch.
I.B.4—
Multicomponent Polymer Systems
The foregoing sections have illustrated that a polymer's chemical and physical structures can be very
complex. Many of these details can be manipulated, at least to some extent, to produce a material that
has a desired set of characteristics. Physical blending of two or more resins is yet another strategy for
tailoring polymer properties. Some blends exhibit characteristics of each component; in other blends,
the properties are intermediate. For example, polystyrene homopolymer is very brittle and prone to
sudden failure. When it is blended with polybutadiene, however, the resulting material, called high-
impact polystyrene, is much tougher and more resistant to crack propagation. This blend can be used in
certain applications (e.g., appliance housings) for which pure polystyrene is unsuitable. Sometimes, the
end use may require properties intermediate between those of a low- and a high-cost resin. In such
instances, the higher-cost material may be ''diluted" with the lower-cost. Not all combinations of
polymers mix equally well. Whereas some combine on a molecular level (such as some polyethylenes),
others appear to be uniform, but actually form discrete domains on a microscopic scale (such as high-
impact polystyrene). Still other combinations of polymers do not form stable blends, at some or all
concentrations. Occasionally, this difficulty can be overcome through use of a compatibilizing agent,
which promotes miscibility. These agents are very often block copolymers of the monomers in the each
blend component.
Additives can also be used to confer desired properties. Pure poly(vinyl chloride) (PVC), for example,
is rigid, brittle, and glassy at room temperature. To produce a soft material suitable for waterproof
clothing or furniture covering, the T
g
is lowered by addition of a few percent of a plasticizer, often a
phthalate ester, which turns the base polymer into a more useful, ductile material (1). Other additives
used at relatively high levels aid in processing, or confer either slipperiness or tackiness to the surface.
Many other additives, such as antioxidants and light stabilizers, are blended into the polymer matrix at
file:///G|/download/www.netlibrary.com/nlreader/nlReader.dll@BookID=46838&FileName=Page_10.html5/11/2006 8:06:09 AM
Document
Page 11
parts-per-million (ppm) levels. These stabilizing additives help maintain the material's properties by limiting
processing or environmental damage.
I.C—
NMR Spectroscopy of Polymers
This section will assume a basic understanding of the Fourier-transform NMR experiment, and will deal only
with the application of NMR spectroscopy to polymer structural analysis. For a more complete treatment,
several excellent references are available [4–12]. Most of the discussion will focus on
13
C NMR, although
other nuclei will be mentioned as appropriate.
I.C.1—
The Zeeman Interaction
The source of nuclear magnetic resonance is the Zeeman interaction (i.e., the interaction between the magnetic
moment of a nuclear spin and a static magnetic field):
where ω denotes the resonant (Larmor) frequency, γ is the gyromagnetic ratio, a fundamental property of a
nuclide, and H
0
is the static magnetic field. Only nuclei with nonzero spin are observable by NMR; this
excludes many abundant nuclides, such as
12
C or
16
O. These elements do have NMR-active isotopes, although
they occur naturally only at low concentrations (1.1% for
13
C; 0.04% for
17
O).
The consequence of the simple relation in Eq. (1.4) is that
13
C,
1
H,
31
P, or any other NMR-active nucleus, has
a unique frequency at which it can be observed. Most elements in the periodic table have at least one NMR-
active nucleus [8,9]; Table I.1 summarizes the NMR properties of several commonly studied nuclei. For
organic systems,
13
C and
1
H provide the most useful information. Unfortunately, the NMR properties of many
other potentially interesting nuclei (such as
17
O or
15
N) are not favorable. Furthermore, many nuclides are
quadrupolar (i.e., their spins are > 1/2), which generally leads to relatively broad resonance lines. NMR's
ability to observe only one nuclide, without an interfering background signal from any others, can be useful.
For example, many phosphorus-containing chemicals are used as antioxidants in polymers, typically at levels
of 0.05–0.5 wt%. It can be difficult to identify the additive, or to study its degradation pathways, by other
spectroscopic techniques, because the bands attributable to the additive are lost among those from the base
polymer.
31
P NMR signals, however, arise only from the additive, permitting study of the additives' chemistry
in situ [25].
I.C.2—
Chemical Shift
The greatest strength of NMR is its sensitivity to subtle details of chemical structure. The Larmor equation (Eq
1.27) reveals the approximate resonant frequency for a particular nuclide, but slight variations from that basic
frequency result from differences in chemical structure. The exact resonant position, or chemical shift,
primarily depends on the electronic environment around the nucleus, with effects being observed over several
bond lengths. Electronic deshielding, with resulting higher chemical shifts, occurs in, for example,
halogenated, olefinic, and aromatic species. Because the effect of chemical shift is
TABLE I.1 NMR Properties of Selected Nuclei
Nucleus Spin Natural abundance (%) Larmor frequency (MHz)
1
H
1/2 99.99 100.0
19
F
1/2 100 94.1
31
P
1/2 100 40.5
13
C
1/2 1.11 25.1
29
Si
1/2 4.70 19.9
2
H
1 0.02 15.4
17
O
5/2 0.04 13.6
15
N
1/2 0.37 10.1
file:///G|/download/www.netlibrary.com/nlreader/nlReader.dll@BookID=46838&FileName=Page_11.html5/11/2006 8:06:11 AM
Document
Page 12
TABLE I.2 Chemical Shift Calculations
a
13
C shift = –2.3 + α + β + γ + δ
Substituent
α β γ δ
>C<
9.1 9.4 –2.5 0.3
—O—
49.0 10.1 –6.0 0.3
—N<
28.3 11.3 –5.1 0.3
—S—
11.0 12.0 –5.1 –0.5
—C
6
H
5
22.1 9.3 –2.6 0.3
—F
66.0–70.1 7.8 –6.8 0.0
—C1
31.1–43.0 10.0 –5.1 –0.5
—CN
3.1 2.4 –3.3 –0.5
22.5 3.0 –3.0 0.0
—COOH
20.1 2.0 –2.8 0.0
—COO—
24.5 3.5 –2.5 0.0
—COO—
22.6 2.0 –2.8 0.0
(C-bonded)
—COO—
54.5–62.5 6.5 –6.0 0.0
(O-bonded)
21.5 6.9 –2.1 0.4
a
Some steric corrections are also required.
Source: Ref. 25.
predictable, calculational schemes, based on substituent effects, can estimate shifts for a particular molecule [5,6,26].
This is particularly true for
13
C, the most commonly observed nucleus; one such scheme is summarized in Table I.2.
This approach can be very helpful in a first attempt to assign the peaks in a spectrum. For example, Table I.3 compares
calculated and observed chemical shifts for poly(vinyl acetate):
I.X
TABLE I.3 Comparison of Experimental and Calculated
13
C
Chemical Shifts for Poly(vinyl acetate)
Carbon Experimental Calculated
A
38.2 41.4
B
66.5 66.6
C
20.3 18.1
file:///G|/download/www.netlibrary.com/nlreader/nlReader.dll@BookID=46838&FileName=Page_12.html5/11/2006 8:06:14 AM
Document
Page 13
Although these calculation schemes give approximate shift positions, they do not account for the full
variety of structural features observable by NMR. NMR spectoscopy would still be a useful, if
somewhat limited, tool in polymer analysis if simple structural identification were its only application.
However, it is also an extremely powerful technique for determining the microstructural details of
polymer chemical structure. The NMR spectrum is sensitive to both geometric and stereoisomeric
structure. The presence of both cis- and trans-isomers in PBd (see Structures I.J and I.K) is easily
detected in the spectrum of Figure I.6. Tacticity, which has such a marked effect on a polymer's
physical properties, is clearly observed in the NMR spectrum of Figure I.7, which contrasts the spectra
of isotactic, syndiotactic, and atactic polypropylene.
NMR is also a useful tool in copolymer analysis. In addition to the low- and high-density forms of
polyethylene, there is a third, commercially important type of PE, the linear low-density polyethylenes
(LLDPEs), which are actually copolymers of ethylene and a few mole percent of a 1-olefin, usually 1-
butene, 1-hexene, 1-octene, or 4-methyl-1-pentene [1]. The LLDPEs have a linear backbone, with side
branches, the length of which are determined by the choice of comonomer (ethyl branches result from 1-
butene, butyl branches from 1-hexene, and so on). These materials combine the advantages of the
properties of HDPE with the better impact strength of LDPE. LLDPE products of various densities are
available, and their properties are governed by the branch type, the branching concentration, and the
way in which the branches are distributed along the backbone.
The chemical shifts observed in the
13
C spectrum of an LLDPE fall into a very narrow range (~ 10–40
PPM), as in the spectrum of poly(ethylene-co-1-butene) copolymer (Fig. I.8) [27]:
I.Y
Figure I.6
13
C NMR spectrum of polybutadiene.
file:///G|/download/www.netlibrary.com/nlreader/nlReader.dll@BookID=46838&FileName=Page_13.html5/11/2006 8:06:15 AM
Document
Page 14
Figure I.7
Comparison of
13
C NMR spectra of (a) isotactic, (b) syndiotactic, and (c) atactic polypropylene.
file:///G|/download/www.netlibrary.com/nlreader/nlReader.dll@BookID=46838&FileName=Page_14.html5/11/2006 8:06:17 AM
Document
Page 15
Figure I.7
(continued)
Figure I.8
13
C NMR spectrum of poly(ethylene-co-1-butene).
file:///G|/download/www.netlibrary.com/nlreader/nlReader.dll@BookID=46838&FileName=Page_15.html5/11/2006 8:06:18 AM
Document
Page 16
The main resonance at 30 ppm is due to backbone carbons far from a branch point. The secondary
branch resonances in the spectrum arise from isolated branches (i.e., branches separated by at least two
ethylene units). Because the butene concentration of this LLDPE is low (~3 mol%), most of the
branches are isolated. Spectra of other LLDPEs, such as ethylene-1-hexene [28], ethylene-1-octene
[29,30], and ethylene-4-methyl-1-pentene [30], have similarly distinctive peak patterns. Even under
nonquantitative experimental conditions, these patterns can readily be used to identify the 1-olefin
comonomer in an LLDPE.
Figure I.8 also has resonances that cannot be attributed to isolated branches. Some of them arise from
groups at the ends of polymer chains [27] (from which M
n
can be estimated),
I.Z
whereas others are attributable to nonisolated branches [27] arising from nearby 1-olefin groups. When
spectra of such polymers are recorded under quantitative conditions, it is possible to calculate the
distribution of comonomer sequences and to derive other parameters, such as the average length of
ethylene and 1-olefin runs, n
E
and n
B
[27]. For example, the spectrum of Figure I.8 leads to values of
26.3 for n
E
and 1.04 for n
B
.
Analysis of comonomer sequences and tacticity distributions can provide insight into polymerization
mechanisms. Simple statistical models can be applied to investigate whether Bernoullian (random) or
Markovian (end-effect) statistics [31,32] best reflect the sequence or tacticity distribution. It is not
possible to describe the resulting distributions by such simplistic models for many commercial
polymerization processes. For example, many polymerization catalysts have more than one active site;
hence, the resulting material has two or more components, each of which can be described by its own
characteristic sequence or tacticity distribution [32,33]. Other compositional heterogeneities can arise
from process-related variables (i.e., variation of comonomer levels, feed rate, temperature, or agitation
speed) during the reaction [32]. NMR has been used to study all these effects.
I.C.3—
Dipolar and Scalar Coupling
Interactions among nuclei in a sample induce coupling of their nuclear spins, which results in a
broadening or splitting of the resonances. In NMR spectra of small molecules, these interactions are
averaged to zero by rapid, isotropic tumbling. However, in polymer solutions, molecular motion is slow
enough that these couplings can contribute significantly to the spectrum. This problem is particularly
severe for abundant spins, as in the
1
H spectrum of poly(isobutyl methacrylate)
I.AA
shown in Figure 1.9, illustrates. This broadening can, in fact, obscure other, more complex coupling
patterns. For nuclei with spin > 1/2 (such as
27
Al,
14
N, or
2
H), another source of peak broadening is the
quadrupolar interaction. In general, however, quadrupolar nuclei are not used in polymer analysis.
Scalar, or J, couplings can be homonuclear, such as those among
1
Hs, or heteronuclear, such as those
between
13
Cs and
1
Hs. Homonuclear J couplings can result in very complex splitting patterns, although
these patterns are often obscured by the relatively strong homonuclear dipolar interactions present in
polymer solutions.
13
C—
1
H coupling results in simpler splitting patterns. As shown in Figure I.10 for
the spectrum of poly(isobutyl methacrylate), the observed multiplicity is N + 1, where N is the number
of protons directly bonded to a carbon. This is useful information, but most
13
C signals are recorded
with
1
H decoupling to simplify the spectrum. There are several experimental schemes for recovering
file:///G|/download/www.netlibrary.com/nlreader/nlReader.dll@BookID=46838&FileName=Page_16.html5/11/2006 8:06:20 AM
Document
Page 17
Figure I.9
1
H NMR spectrum of poly(isobutyl methacrylate).
Figure I.10
13
C NMR spectrum of poly(isobutyl methacrylate), recorded without
1
H decoupling,
revealing
13
C–
1
H splitting patterns.
file:///G|/download/www.netlibrary.com/nlreader/nlReader.dll@BookID=46838&FileName=Page_17.html5/11/2006 8:06:21 AM
Document
Page 18
13
C peak multiplicities without overly complicating the spectrum. Adjustment of the decoupling frequency can
reduce the magnitude of the splitting, and other approaches, such as DEPT, INEPT, and APT, have been
devised which selectively invert or null particular multiplicities [4–7].
I.C.4—
Nuclear Relaxation
The behavior of nuclei during the pulsed, or Fourier-transform, NMR experiment is time-dependent. The
equilibrium magnetization is perturbed by the radiofrequency excitation pulse used. After the pulse, relaxation
occurs by various processes, each of which is governed by a characteristic relaxation time. The effect of spin–
spin relaxation, the time constant of which is designated T
2
, is observed in the free-induction decay signal (Fig.
I.11). A more rapid decay implies a shorter T
2
, or faster relaxation, which is reflected by broadened peaks in
the final spectrum. T
2
is related to the rate of molecular reorientations, with a shorter T
2
indicating slower
motion. In general, large polymer molecules move more slowly (and therefore exhibit shorter T
2
s) than small
molecules. T
2
is most sensitive to motions in the kilohertz (kHz) frequency regime, which usually correspond
to short-range segmental reorientations. Although the average rate of polymer chain motion can be increased
by reducing the solution concentration or raising the sample temperature, there is often an inherent limit on the
achievable spectral resolution for polymer solutions.
A second relaxation process is spin–lattice relaxation, characterized by T
1
. The rate of spin–lattice relaxation is
influenced by relatively rapid (MHz regime) motions, such as methyl group rotation. This process governs the
frequency with which the pulsed experiment can be repeated. To ensure that the spin system has returned to
equilibrium, it is necessary to wait many (five to ten) T
1
s between scans. Polymer solutions tend to have short
T
1
s, which means that pulsed experiments can be repeated more rapidly than for most small molecules; this
reduces the total experiment time.
The measurement of relaxation times, such as T
1
and T
2
, is a useful approach for studying the molecular
dynamics of polymer solutions or polymeric liquids. Relaxation times can, for example, be related to
rheological (flow) properties of a material [33].
I.C.5—
Nuclear Overhauser Enhancement
A secondary effect of the use of
1
H irradiation to remove J couplings is the nuclear Overhauser effect (NOE),
which results in altered signal intensities. The maximum enhancement factor attainable through the NOE is
governed by the gyromagnetic ratios of the coupled spins I and S:
For the
13
C–
1
H pair, this value is 2.988, which means that
13
C signals can be enhanced up to threefold. For
nuclei with negative γs, such as
29
Si, the signal can be attenuated, rather than increased.
For
13
C, the extent of NOE observed is generally related to the number of directly bonded
1
H nuclei; that is
I.BB
and is governed by the proportion of spin–lattice (T
1
) relaxation that is due to dipolar effects. As discussed in
Section I.C.3., polymer solutions have strong dipolar interactions, so that a maximal NOE (threefold
enhancement) is realized for most protonated carbons. Nonprotonated carbons, such as carbonyls or
quaternaries, do not exhibit the full effect.
I.C.6—
Multidimensional NMR
Straightforward NMR experiments can provide much detail about polymer structure; however, on occasion,
they cannot provide the necessary answer. More sophisticated experiments, such as multidimensional
spectroscopy, facilitate correlation between two or more different NMR parameters. Table I.4 lists several such
experiments. A discussion of the application of multidimensional NMR to polymer systems is beyond the
scope of this introduction [7–12,34].
file:///G|/download/www.netlibrary.com/nlreader/nlReader.dll@BookID=46838&FileName=Page_18.html5/11/2006 8:06:23 AM
Document
Page 19
Figure I.11
Typical free-induction decays (FIDs) for NMR signal, with (A) long and (B) short T
2
.
file:///G|/download/www.netlibrary.com/nlreader/nlReader.dll@BookID=46838&FileName=Page_19.html5/11/2006 8:06:24 AM