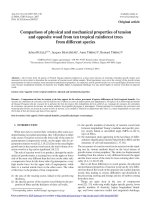
mechanical properties of polymers and composites nielsen pot
Bạn đang xem bản rút gọn của tài liệu. Xem và tải ngay bản đầy đủ của tài liệu tại đây (2.82 MB, 138 trang )
Library of Congress Cataloging-In-Publitation Date
Nielsen. Lawrence E.
Mechanical properties of polymers and composites / Lawrence E.
Nielsen. Robert F. Landel. — 2nd ed., rev. and expanded.
p. cm. — (Mechanical engineering ; 90)
Includes bibliographical references and index.
ISBN 0-8247-8964-4
1. Polymers—Mechanical properties. 2. Polymeric composites—
Mechanical properties. I. Landel. Robert F. II. Title.
III. Series: Mechanical engineering (Marcel Dekker) ; 90.
TA455.P58N48 1994
620.1 '9204292—dc20 93-38084
CIP
The publisher offers discounts on this book when ordered in bulk quan-
tities. For more information, write to Special Sales/Professional Marketing
at the address below.
This hook is printed on acid-free paper.
Copyright C 1994 by Marcel Dekker, Inc. All Rights Reserved.
Neither this book nor any part may he reproduced or transmitted in any
form or by any means, electronic or mechanical, including photocopying,
microfilming, and recording, or by any information storage and retrieval
system, without permission in writing from the publisher.
Current printing (last digit):
PRINTED IN THE UNITED STATES OF AMERICA
MECHANICAL
PROPERTIES
OF POLYMERS
AND
COMPOSITES
SECOND EDITION,REVISED AND EXPANDED
LAWRENCE E.NIELSEN
Monsanto Company
St. Louis. Missouri
F. LANDEL
Jet Propulsion Laboratory
California institute of Technology
Pasadena, California
Marcel Dekker, Inc. New York*Basel«Hong Kong
Contents
III. Stress or Strain Amplitude Effects 1S4
IV. Thermal History 137
V. Effect of MokcLil.ir Weight l&
VI. Effect of Cross-linking 1*7
VII. Effects of Crystallinity and Morphology H5
Vin. Effects of Plasticizcrs and Copolymerization 181
IX. Effect of Molecular Orientation 188
X. Effect of Strength of Intcrmolccular Forced 194
XL Polyblends, Block, and
#
Graft Polymers m
XH. Secondary Damping Peaks ' 282
Summary 212
Problems 3§|
Reference ^
Stress-Strain Behavior and Strength 3353
I. Stress-Strain Tests $3$
A. Introduction ^§
B. Models Hg$
C. T'orm of the stress—strain curve; Multiaxial
response |36
D. Comprcssioii and shear versus tensile tests:
Rigid polymers 249
E. Effect of temperature 253
F. Rale of testing and the failure envelope 256
G. Effect of hydrostatic pressure 2t?3
H. Effect of molecular weight and branching 265
I. Effect of cross-linking 268
J. Relationships and inlcraclJQrtS 277
K. Effect of erysNsllinity 280
U. Hffects of ptusticizHtion and cbpotynteri^ifbti 283
M. Molecular orientation 285
N. Polyblends, block, and graft polymers 292
IJ. Brittle Fracture and Stress Concentrators 295
A. Stress concentrators 295
B. Fracture theory 297
IK. Theories of Yielding and Cold- Drawing 299
IV. Impact Strength and Tearing 307
A. Nature of impact tesfs 307
B. Effect of notched 308
C. Effects of temperature 310
D. Effects of orientation 313:
E. Other factors effecting impacr stren|th HI
Contents
F. Impact strength of poly blends
G. Tearing
Summary
Problems
References
6. Other Mechanical Properties
I. Heat Distortion Temperature
II. Fatigue "*
III. Friction
IV. Abrasion, Wear, and Scratch Resistance-
V. Hardness and Indentation Tests
VI. Stress Cracking and Crazing in Fluids
Summary
Problems
References
% Particulate-Filled Polymers
I. Introduction to Composite Systems
II. Rheology of Suspensions
III. Relation between Viscosity and Shear Modulus
IV. Modulii of Filled Polymers
A- Regular systems
B. Inverted systems and phase inversion
C. Errors in composite moduli
D. Experimental examples
V, Strength and Stress^Strain Behavior
A. Rigid fillers
B. Polyblends, block polymers, and foams
VI. Creep and Stress Relaxation
VII. Dynamic Mechanical Properties
VIII. Other Mechanical Properties
A. Impact strength
8. Heat distortion temperature
C. Hardness, wear, and fatigue life
D. Coefficients of thermal expansion
IX. Composites with Thick Interlayers
X- Syntactic Foums
XI. Structural Foams
Summary
Contents Xltl
Problems 447
References 450
8. Fiber-Filled Composites and Other Composites 461
I. Inlroduction 461
II. Moduli of l-ther-Filled Composites 463
III. Strength of Fiber-Filled Composites 471
A. Uniaxialty oriented fibers
:i
472
B. Strength of randomly oriented fiber
composites and laminates 479
IV. Other Properties 4S3
A. Creep
;
483
B. Fatigue 485
C. Heat distortion tejnperaturp 486
D. Impact strength 488
E. Acoustic emission 491
F. Dynamic mechanical properties 491
G. Coefficients of thermal expansion 492
V. Ribbon-Filled Composites 49S
VI. Other Types of Composites #$
A. Flake-filled polymers <#§
B. Composites with thick interlayers 500
C. Interpenetrating network composites
Summary
Problems
References S0S
Appendixes 515
I. Chemical Structure of Common Polymers 516
II. Conversion Factors for Moduli, Stress, and Viscosity 519
III. Glass Transition Temperatures and Melting Points
of Polymers 520
IV. Relations Between Engineering Moduli and
Tensor Moduli and Tensor Compliances for
Anisotropic Methods 524
V. On Rubberlike Elasticity 528
VI. List of Symbols 533
Index 545
Contents
Preface to the Second Edition it
Preface to the First Edition fg
1. Mechanical Tests and Polymer Transitions I
I. Inlroduction |
II. Mechanical Tests |
A. Creep tests jp
B. Stress-relaxation tests P
C. Stress-strain tests $j
D. Dynamic mechanical test? If
E. Other tests |§
III. Glass Transitions M
A. Chemical structure and T
y
iJ
B. Structural factors affecting T
K
19
IV. Crystallinity 23
A. Melting points 24
Problems 27
References 28
IX
Contents
2. Elastic Moduli
1. Isotropic and Anisotropic Materials
A- houopic materials
if Anisotropic materials
17, Methods of Measuring Moduli
A. Young's modulus
B. Young's and shear moduli from vibration
frequencies
JJI. Relations of Moduli to Molecular Stfyeture
A. Effects of molecular weight
B_ Effect of cross-linking
C. Effect of crystallinity
13. Copolymerrzation and plasticization
E- Block and graft polymers and polyh.lcn4»:
Problems
References
3. Creep and Stress Relaxation
1. Introduction
1L Models
III. Distribution of Relaxation and Retardation
IV. Superposition Principles
'Ui Nonlinear Response
A. Strain dependence of stress relaxation
B. Stress dependence of creep
VI. Effect of Pressure
YLJ. Thermal Treatments
VII). Effect of Molecular Weight: Molecular
IX. Effect of Plasticizcrs on Melt Viscosity
X. Cross-linking
XI. Crystallinity
XII. Copolymers and Plasticization
XHf. Effect of Orientation
XIV. Block Polymers am) PolyblendS-:
Summary
Problems
References
4. Dynamical Mechanical Properties
I- Introduction and Instruments
H. Temperature and Frequency Effects
Mechanical Tests and Polymer Transitions
1. INTRODUCTION
Most plastic materials are used because they have desirable mechanical
properties at an economical cost. For this reason, the mechanical properties
may be considered the most important of all the physical and chemical
properties of high polymers for most applications. Thus everyone working
with such materials needs at least an elementary knowledge of their me-
chanical behavior and how this behavior can be modified by the numerous
structural factors that can be varied in polymers. High polymers, a few of
which have their chemical structure shown in Appendix I, have the widest
variety and range of mechanical properties of all known materials. Poly-
mers vary from liquids and soft rubbers to very hard and rigid solids.
Unfortunately, this virtuosity is sometimes viewed instead as a baffling
complexity. One of the purposes of this book, therefore, is to show that
there is an underlying order and organization that can serve as a logical
framework and guide to this variety and to the interplay between properties
and these structural features. The interplay is important because of the
need to understand how structural modifications made to achieve some
desired property can affect other properties at the same time. There are
a great many structural factors that determine the nature of the mechanical
behavior of such materials. One of the primary aims of this book is to
2 Chapter 1
show how the following structural factors, in addition to the chemical
composition, affect all of the major mechanical properties of polymers:
l_ Molecular weight
2.
Cross-linking and branching
3.
Crystallinity and crystal morphology
4.
Copolymerization (random, block, and .graft)
5.
Plasticization
6.
Molecular orientation
7.
Fillers
8.
Blending
9, Phase separation and orientation in blocks, grafts, and blends
In addition to the structural and molecular factors listed above, the
following environmental or external variables are important in determining
mechanical behavior:
1.
Temperature
2.
Time, frequency, rate of stressing or straining
3.
Pressure
4.
Stress and strain amplitude
5.
Type of deformation (shear, tensile, biaxial, e tc.)
6.
Meat treatments or thermal history
7.
Nature of surrounding atmosphere, especially moisture content
There is a strong dependence on temperature and time of the properties
of polymers compared to those of other materials such as metals. This
strong dependence of properties on temperature and on how fast the ma
terial is deformed ( t i m e scale) is a result of the viscoelastic nature Of
polymers. Viscoelasticity implies behavior similar to both viscous liquids
in which the rate of deformation is proportional to t h e applied force and
to purely ela s tic solids in which the deformation is proportional to the
applied force In viscous systems ;all the work done on The system is dis-
sipated as heat, whereas in ela stic systems all the work is stored as potential
energy, as in a stretched spring. It is this dual nature of polymers that
makes t h e i r behavior so complex and at the same time so interesting. The
great variety of mechanical tests and the numerous factors listed above
would make study of t h e mechanical properties of polymers very complex
if it were not for some general phenomena and principles that underlie all
of these various properties and determine t h e outcome of various test or
use conditions. These principles organize and systematize the study, under-
standing, and prediction or estimation of this complex array of properties,
including interdependences. They do t h i s with just a very few equations
(or functions) and mater ill characteristic parameters.
Mechanical Tests and Polymer Transitions 3
II. MECHANICAL TESTS
There are a bewildering number of mechanical tests and testing instru-
m
ents. Most of these tests are very specialized and have not been officially
recognized as standardized tests. Some of these tests, however, have been
standardized and are described in the publications of the American Society
for Testing and Materials (1 ). Many of the important tests for plastics are
given as ASTM standards in a series of volumes. The important volumes
(parts) covering polymeric materials are listed in Table 1. Although many
tests have been standardized, it must be recognized that a standardized
test may be no better than one that is not considered a standard. One
objective of a standardized test is to bring about simplicity and uniformity
to testing, and such tests are not necessarily the best tor generating the
most basic information or the special type of information required by a
research problem. The tests may not even correlate with practical use tests
in some cases.
Besides the ASTM standard tests, a number of general reference books
have been published on testing and on the mechanical properties of poly-
mers and viscoelastic materials (2-7). Unfortunately, a great variety of
units are used in reporting values of mechanical tests. Stresses, moduli of
elasticity, and other properties are given in such units as MK.S (SI), cgs,
and English units. A table of conversion factors is given in Appendix II.
A. Creep Tests
Creep tests give extremely important practical information and at the same
time give useful data on those interested in the theory of the mechanical
properties of materials. As illustrated in Figure 1, in creep tests one mea-
Table 1 ASTM Standards
Part No.
Materials
covered
15
Paper, packaging
16
Structural sandwich constructions, wood, adhesives
20
Paint: Materials specifications and tests
21
Paint: Tests for formulated materials and applied coatings
24
Textiles: Yarns and fabrics
25
Textiles: Fibers
26
Plastics: Specifications
27
Plastics: Methods of testing
28
Rubbers
29
Electrical insulating materials
4 Chapter 1
CREEP
STRESS
RELAXATION
STRESS-
STRAIN
DYNAMIC
MECHANICAL
Figure 1 Schematic diagrams of various types of tensile tests F, force; e strain or
elongation.
sures over a period of time the deformation brought about by a constant
load or force, or for a true measure of the response, a constant stress.
Creep tests measure the change in length of a specimen by a constant
tensile force or stress, but creep tests in shear, torsion, or compression are
also made. If the material is very stiff and brittle, creep tests often are
made in flexure but in such cases the stress is not constant throughout the
thickness of the .specimen even though the applied load is constant. Figure
2 illustrates the various types of creep tests In a creep test the deformation
increase with lime. If the strain is divided by the applied stress, one obtains a
quantity known as the compliance. The compliance is a time-dependent
reciprocal modulus, and it will be denoted by the symbol J for shear com-
pliance and D for tensile compliance (8).
Mechanical Tests and Polymer Transitions 5
TENSION
CO,PRESSI
ON
Figure 2 Types of creep tests,
If the load is removed from a creep .specimen after some lime, there is a
tendency for the specimen to return to its original length or shape. A
recovery curve is. thus obtained if the deformation is plotted as a function
of time after removal of the load,
B. Stress-Relaxation Tests
fa stress-relaxation tests, the specimen is quickly deformed a given amount,
and the stress required to hold the deformation constant is measured as a
function of time. Such a test is shown schematically in Figure 1. If the
stress is divided by the constant strain, a modulus that decreases with time
is obtained. Stress-relaxation experiments are very important for a theo-
retical understanding of viscoelastic materials. With experimentalists, how-
ever, such tests have not been as popular as creep tests. There are probably
at least two reasons for this: (1) Stress-relaxation experiments, especially
on rigid materials, are more difficult to make than creep tests; and (2)
creep costs are generally more useful to engineers and designers.
S
HEAR TORSION
6 Chapter 1
C. Stress-Strain Tests
Jn stress-strain tests the buildup of force (or stress) is measured as the
specimen is being deformed at a constant rate. This is illustrated in Figure
I. Occasionally, stress-strain tests are modified to measure the deformation
of a specimen as the force is applied at a constant rate, and such tests are
b
ecoming commonplace with the advent of commercially available load-
controlled test machines. Stress-strain tests have traditionally been the most
popular and universally used of alt mechanical tests and are described by
ASTM standard Vests such as D638, D882, and D412. These tests can be
more difficult to interpret than many other tests because the stress can
become nonhomogeneous (i.e., it varies from region to region in the speci-
men as in cold-drawing or necking and in crazing). In addition, several
different processes can come into play (e.g., spherulite and/or lamella
breakup in crystalline polymers in addition to amorphous chain segment
reorientation). Also, since a polymer's properties arc time dependent, the
shape of t h e observed curve will depend on the strain rate and temperature.
Figure 3 illustrates the great variation in stress-strain behavior of polymers
as measured at a constant rate of strain. The scales on these graphs
STRAIN (%)
STRAIN {%)
A B
c
STRAIN (%)
Figure 3 General types of stress-strain curves.
Mechanical Tests and Polymer Transitions ¥
are not exact but arc intended to give an order-of-magnitude indication of
the values encountered. The first graph (A) is for hard, brittle materials-
The second graph (B) is typical of hard, ductile polymers. The top curve
in the ductile polymer graph is for a material that shows uniform extension.
The lower curve in this graph has a yield point and is typical of a material
that cold-draws with necking down of the cross section in a limited area
of the specimen. Curves of the third graph (C) arc typical of elastomeric
materials.
Figure 4 helps illustrate the terminology used for stress-strain testing.
The slope of the initial straight-line portion of the curve is the elastic
modulus of the material, In a tensile test this modulus is Young's modulus,
The maximum in the curve denotes the stress at yield a
v
and the elongation
at yield €
v
. The end of the curve denotes the failure of the material, which
is characterized by the tensile strength a and the ultimate strain or elon
gation to break . These values are determined from a stress-strain curve
while the actual experimental values are generally reported as load-
deformation curves. Thus (he experimental curves require a
transformation of scales to obtain the desired stress-strain curves. This is
accomplished by the following definitions. For tensile tests:
If the cross-sectional area is that of the original undeformed specimen, this
is the engineering stress. If the area is continuously monitored or known
Figure 4 Stress-strain notation.
8 Chapter 1
d
uring the test, this is the true stress For large strains (i.e. Figure3.B and C)
there is a significant difference.
The strain EC can be defined in several ways, as given in Table 2, but for
engineering (and most theoretical) purposes, the strain for rigid materials
is defined as
T
he original length 6f the specimen Is L0 and its stretched length is L. At
very small deformations, all the strain definitions of Table 2 are equivalent,
For shear tests (see Figure 2)
for shear of a rod the strains are not uniform,, but for small angular
displacements .under a torque AT, the maximum stress and Strain occur
Table 2 Definitions of Tensile Strain
Definition . Name
Cauchy (engineering)
kinetic theory of rubberlike
elasticity
Kirchhoff
Murnaghan
seth (n is Variable)
Mechanical Tests and Polymer Transitions 9
a
t the surface and
are given by
shear stress (maximum)
shear strain (maximum)
if Hooke's law holds, the elastic moduli are defined by the
equations
(tensile tests)
.(6)
(shear tests)
(7)
where E is the Young's modulus and G is the shear modulus.
Tensile stress-strain tests give another elastic constant, called Poisson's
ratio, v. Poisson's ratio is defined for very small elongations as the decrease
in width of the specimen per unit initial width divided by the increase in.
length per unit initial length on the application of a tensile load::
In this equation e is the longitudinal strain and e
r
is the strain in the width
(transverse) direction or the direction perpendicular to the applied force
:
It can be shown that when Poisson's ratio is 0.50, the volume of the speci-
men remains constant while being stretched. This condition of constant
volume holds for liquids and ideal rubbers. In general, there is an increase
in volume, which is given by
where AV is the increase in the initial volume V
t>
brought about by straining
the specimen. Note that v is therefore not strictly a constant. For strains
beyond infinitesimal, a more appropriate definition is (9)
Moreover, for deformations other than simple tension the apparent Pojs-
son's ratio -t
r
/€ is a function of the type of deformation.
Poison's ratio is used by engineer's in place of the more fundamental quality desired, the bulk
modulus. The latter is in fact determined by r for linearly elastic systems—h«ncc the widespread use
of v engineering equation for large deformations, however, where the Strain is not prop ortiona l to
the stress, a single value of the hulk modulus may still suffice even when the value of y is
not- constant,
10 Chapter 1
D, Dynamic Mechanical Tests
A fourth type of test is known as a dynamic mechanical test. Dynamic
mechanical tests measure the response of a material to a sinusoidal or other
periodic stress. Since the stress and strain are generally not in phase, two
quantities can be determined: a modulus and a phase angle or a damping
term. There arc many types of dynamic mechanical test instruments. One
type is illustrated schematically in Figure I. The general type of dynamic
mechanical instruments are free vibration, resonance forced vibration, non-
resonance forced vibration, and wave or pulse propagation instruments
(3.4). Although any one instrument has a limited frequency range, the
different types of apparatus arc capable of covering the range from a small .
fraction of a cycle per second up to millions of cycles per second. Most
instruments measure either shear or tensile properties, but instruments
have been built to measure bulk properties.
Dynamic mechanical tests, in general, give more information about a
material than other tests, although theoretically the other types of me-
chanical tests can give the same information. Dynamic tests over a wide
temperature and frequency range are especially sensitive to the chemical
and physical structure, of plastics. Such tests are in many cases the most
sensitive tests known for studying glass transitions and secondary transitions
in polymers as well as the morphology of crystalline polymers.
Dynamic mechanical results are generally given in terms of complex
moduli or compliances (3,4), The notation will be illustrated in terms Of
shear modulus G, but exactly analogous notation holds for Young's mod-
ulus F. The complex moduli are defined by
where G* is the complex shear modulus, G' the real part of the modulus,
G" the imaginary part of the modulus, and i = \/- I. G' is called the
storage modulus and G the loss modulus. The latter is a damping or
energy dissipation term. The angle that reflects the time lag between the
applied stress and strain is landa, and it is defined by a ratio called the
loss tangent or dissipation factor:
Tan landa, a damping term, is a measure of the ratio of energy dissipated
as heat to the maximum energy stored in the material during one cycle of
oscillation. For small to medium amounts of damping. G' is the same as
the shear modulus measured by other methods at comparable time scales.
The loss modulus G" is directly proportional to the heat H dissipated per
where gama(0) is the maximum value of the shear strain during a cycle.
Other dynamic mechanical terms expressed by complex notation include the
com plex compliance /* and the complex viscosity eta.
and w
is the frequency of the oscillations in radians per second. Note that
the real part of the complex viscosity is an energy-dissipation term, just as
is.the imaginary part of the complex modulus.
Damping is often expressed in terms of quantities conveniently obtained
with the type of instrument used. Since there are so many kinds of instru-
ments, there are many damping terms in common use, such as the loga-
rithmic decrement A, the half-width of a resonance peak, the half-power
width of a resonance peak, the Q factor, specific damping capacity i|<, the
resilience R, and decibels of damping dB.
The logarithmic decrement A is a convenient damping term for free-
vibration instruments such as the torsion pendulum illustrated in Figure 5
for measuring shear modulus and damping. Here the weight of the upper
sample
champ
and the inertia bar are supported by a compliant torsion wire
suspension or a magnetic suspension (10) to prevent creep of the specimen
if it had to support them. As shown in the bottom of this figure, the
successive amplitudes A, decrease because of the gradual dissipation of the
clastic energy into heat. The logarithmic decrement is defined by
Mechanical Tests and Polymer Transitions
11
cycle as given by
Some of the interrelationships between the complex quantities are
1
2 Chapter 1
Figure 5 Schematic diagram of a torsion pendulum and a typical damped oscil-
lation curve. |Modified from L. E. Nielsen,
Mechanical Testss and Polymer Transitions 13
It is related to the dissipation factor approximately by
This equation is Faccurate at low damping (A < 1), but the error becomes
large at high damping. More exact equations have been discussed by Struik
(II) and Nielsen (4). The standard ASTM test is D2236-69.
Damping may be obtained from forced resonance vibration instruments
from plots of amplitude of vibration versus frequency through the reso-
nance peak. Figure 6 illustrates such a plot of a resonance peak. Using the
notation shown in this figure, the damping may be expressed, as
FREQUENCY
Figure 6 Typical amplitude-frequency curve obtained with a vibrating reed ap-
paraius. [From L. E. Nielsen,
VIBRATING SYSTEM
SPECIMEN
(EDGE VIEW)
AMPLITUDE
z
<
i
>
LL
0
(
LU
Q
<
14 Chapter 1
form the half-height width or
form the root mean square (rms) height peat, width. The damping is
expressed in t h i s caseby E.''/E' rather than as G"/G' since in the case illustrated.
Young's modulus is determined instead of the shear monlulus Other common
damping terms may be expressed in terms of th e dis-sipation factor in the
following parameters and equations:
reciprocal Q
loss dB
sometimes it is desirable to be able to estimate damping values in shear form
measurements made in tension, or vice versa, As a first approximation,
v e r y appropriate to rubbery. incompressible materials.
show that G''/G' is equal to or slightly greater than E"/E'. (l2,I3). in equa
tion (29). K is the bulk modulus.
More exact equations. such as
Mechanieal Tests and Polymer Transitions 15 Other Tests
There are many other type's of mechanical tests in common use. One of
the most import tant of these tests is the impact strength of materials. Impact
tests measure resistance to breakage under specified conditions when the
lest specimen is struck at high v e l o c i t y - Such tests are some measurement
of the toughness of the polymer. They are very important practical tests,
especially where an experience base has been built up over time, However,
as usually done, they are difficult to define and analyze in scientific terms,
and hence it has been difficult to emp!oy the results direc tly in designs.
However, instrumental impact testers are mow commercially available to-
gether with g r e a t l y improved a nal ysi s techniques ( 1 4 ) . and the sit uat ion is
improving rapidly. The three most wide l y used impact testers are the falling
ball or dart testers (4 5.15). lzod t est e r { 16.18), and charpy tester (16), high-
speed tensile stress-strain testers (19.20) may also be considered as impact
or toughness testers.
For a quantitative measure of toughness, which can be used to relate the
apparent toughness values observed in the different practical tests or incon-
ducting a stress analysis of functional parts, the fracture toughness lest is used
(14,21 - 2 3 ) . fracture toughness is a measure of the ability of a material to
resist extension of a pre-existing crack, despite the stress concentration that
is built up there. In these t est s , the ends of a precracked specimen are pulled
apart in a direction perpendicular to the plane of the crack (called a mode I
test), or parallel but transverse t o the plane of the crack (mode II). In a third
mode, the plane of the crack is sheared by a sliding motion in the direction
of the crack. ASTM E399-83 gives sample dimensions and procedures.
In contrast to the impact tests, these can be analysed; toughness is
reported as the c ritical energy release rate (7, or the stress concentration
factor K Values may tange from 5000 J.'nr' f o r a tough nylon or poly-
carbonate down to 350 .J/m' lor buttle unmodified polystyrene. The values
can be sensitive to rale and temprature
Except for a lew thermoset materials, most pl astics soften at some
temperatures, At the softening or heat distortion temperature, plastics
become easily deformahle and tend to lose thei r shape and deform
quickly under a Load. Above the heat distortion temperature. rigid
amorphous plastics become useless as structural m a t e rial s . Thus the heat
distortion test, which defines The approximate upper temperature at which
the material can be Safely used, is an important t e s t (4,5.7.24). As
expected, lor amorphous materials the heat distortion temperature is
closely related to the glass transition temperature, hut tor highly
crystalline polymers the heat distortion temperature is generally
considerably higher than the glass transition temperature. Fillers also often
raise the heat distortion test well above
16 Chapter 1
the glass transition temperature. Other common mechanical tests include
hardness, scratch resistance, friction, abrasion, tear, and fatigue tests (1,4.5).
III. GLASS TRANSITIONS
Most polymers are either completely amorphous or have an amorphouslike
component even if they arc crystalline. Such materials are hard, rigid glasses
below a fairly sharply defined temperature known as the glass transitio n
temperature Tg,. At temperatures above the glass transition temperature, at
least at slow to moderate rates of deformation, the amorphous polymer is
soft and flexible and is either an elastomer or a very viscous liq uid,
Mechanical properties show profound changes in the region of the glass
transition. For example, the elastic modulus may decrease by a factor of
over 1000 times as the temperature is raised through the glass transition
region. For t his reuson, Tg can be considered the most important matciial
characteristic of a polymer as far as mechanical properties are concerned.
Many other physical properties change rapidly with temperature in the
glass transition region. These properties include coefficients of thermal
expansion (25.26). heat capacity (25,27), refractive index (2S), mechanical
damping (4), nuclear magnetic (29) and electron spin resonance behavior
(30,31"). electrical properties (32-35), and tensile strength and ultimate
elongation in elastomers (36,37). In view of the great practical importance
of the glass transition temperature, a table of Tg values for many common
polymers is given in Appendix I I I . An extensive compilation is given in
Ref. 38. l-Elastomeric; or rubbery materials have a Tg, or softening tem
ptrature value, below room temperature. Brittle, rigid polymers have a 7',
value above room temperature. Glass transitions vary from - 143°C for
pnly(diethyl siloxane) rubber (39) to 1OO°C for polystyrene and on up to
above 300°C or above the decomposition temperature for highly cross-
linked phenol -formaldehyde resins and polyclectrolytes (40,41).
In addition to its practical importance, T
g
has important theoretical
implications for the understanding of the molecular origin of polymer me-
chanical behavior (3,4,6,35,42-45) and plays a central role in establishing
the framework, mentioned above, which relates the properties of different
polymers to each other (3;46.47).
The glass transition temperature is generally measured- by experiments
that correspond to a time scale of seconds or minutes. If the experiments;
are done more rapidly, so that the time scale is shortened, the apparent
Tg value is raised. If the time scale is lengthened to hours or days, the
apparent Tg value is lowered. Thus, as generally measured, Tg is not a true
constant but shifts with the time scale of the experiment or observation.
Moreover, Tg is masked by experimental difficulties, compounded by mul-
tip le and often inaccurate definitions of Tg in the literature. The least
Mechanical Tests and Polymer Transitions 17
ambiguous and soundest one is that temperature at which the volumetric
thermal expansion coefficient undergoes a step change at heating and cool-
ing rates of 1 C/min.t Increasing the time scale by a factor of 10 will shift
the apparent Tg by roughly 3
n
C [volumetric measurements (3)] to 7°C
(maximum in tan landa plot) for a typical polymer.
The explicit nature of the glass transition is not clear, and many theories,
some conflicting, have been proposed (25,42-45,48-53). It represents an
interrupted approach 10 a hypothetical thermodynamic state of zero config-
unitional ent ropy and close-ordered segmental packing. This state cannot be
reached because the molecular motions that permit rearrangement to better
packing and lower entropy become exponentially slower with decreasing tem-
perature Finally, at some rather small temperature range, Tg, the rate of
further change exceeds the time scale of measurement. The hypothetical glass
temperature is the polymeric equivalent of 0 K. for an ideal gas and lies roughly
50 K below the volumetric T
K
, Thus Tg is an operational reference temperature
for the onset of segmental rearrangements, The volume required for re-
arrangements is called the free volume, Although the theoretical nature of
the glass transition is subject to debate, the practical importance of Tg cannot
be disputed.
A. Chemical Structure and T
g
Several factors related to chemical structure are known to affect the glass
transition tempera lure. The most important factor is chain stiffness or
flexibility of the polymer. Main-chain aliphatic groups, ether linkages, and
dimethylsiloxane groups build flexibility into a polymer and lower Tg
Aliphatic side chains also lower Tg, (he effect of the length of aliphatic
groups is illustrated by the methacrylate series (4,38):
Methyl ester
Ethyl n-Propyl
n-Butyl
n-Octyl
+Thus dclmiiiims (fT"T
s
" l>;isfd (MI mt'chiiiiiL-iil propertici such av [he maximum in Ian h are
no! only sensitive u-i the Ir^c^tency U\L-I.[ (whu-i should always be staled) I'ui also to extraneous
features such as the degree nl rnis>-linkinp, ihc am<nini of filler present, ;ind the presence
of a sccund phase ( c .y . <,ryM:iMiiiny). all ot winch cjin significiinily cliaiigc the v;ilue of (he
temperature ;il whifh lan Fi,,,,, is nhserveit. t-vfii when Die dilatomotric T
f
, which is insensitive
to Such feature's, remain* uiifharifietl, Jl cnec sineh itiediiinitjil proven)f-hiisi:d values oJ T
K
arc often nut rcJisihte,