ivanciuc applications of support vector machines in chemistry
Bạn đang xem bản rút gọn của tài liệu. Xem và tải ngay bản đầy đủ của tài liệu tại đây (1.16 MB, 110 trang )
CHAPTER 6
Applications of Support Vector
Machines in Chemistry
Ovidiu Ivanciuc
Sealy Center for Structural Biology,
Department of Biochemistry and Molecular Biology,
University of Texas Medical Branch, Galveston, Texas
INTRODUCTION
Kernel-based techniques (such as support vector machines, Bayes point
machines, kernel principal component analysis, and Gaussian processes) repre-
sent a major development in machine learning algorithms. Support vector
machines (SVM) are a group of supervised learning methods that can be
applied to classification or regression. In a short period of time, SVM found
numerous applications in chemistry, such as in drug design (discriminating
between ligands and nonligands, inhibitors and noninhibitors, etc.), quantita-
tive structure-activity relationships (QSAR, where SVM regression is used to
predict various physical, chemical, or biological properties), chemometrics
(optimization of chromatographic separation or compound concentration pre-
diction from spectral data as examples), sensors (for qualitative and quantita-
tive prediction from sensor data), chemical engineering (fault detection and
modeling of industrial processes), and text mining (automatic recognition of
scientific information).
Support vector machines represent an extension to nonlinear models of the
generalized portrait algorithm developed by Vapnik and Lerner.
1
The SVM algo-
rithm is based on the statistical learning theory and the Vapnik–Chervonenkis
Reviews in Computational Chemistry, Volume 23
edited by Kenny B. Lipkowitz and Thomas R. Cundari
Copyright ß 2007 Wiley-VCH, John Wiley & Sons, Inc.
291
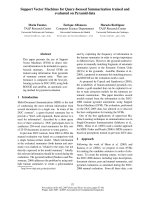
Ovidiu Ivanciuc. Applications of Support Vector Machines in Chemistry. In:
Reviews in Computational Chemistry, Volume 23, Eds.: K. B. Lipkowitz and
T. R. Cundari. Wiley-VCH, Weinheim, 2007, pp. 291–400.
(VC) dimension.
2
The statistical learning theory, which describes the properties
of learningmachines that allow them togivereliablepredictions, was reviewed by
Vapnik in three books: Estimation of Dependencies Based on Empirical Data,
3
The Nature of Statistical Learning Theory,
4
and Statistical Learning Theory.
5
In
the current formulation, the SVM algorithm was developed at AT&T Bell
Laboratories by Vapnik et al.
6–12
SVM developed into a very active research area, and numerous books are
available for an in-depth overview of the theoretical basis of these algorithms,
including Advances in Kernel Methods: Support Vector Learning by Scho
¨
lkopf
et al.,
13
An Introduction to Support Vector Machines by Cristianini and
Shawe–Taylor,
14
Advances in Large Margin Classifiers by Smola et al.,
15
Learn-
ing and Soft Computing by Kecman,
16
Learning with Kernels by Scho
¨
lkopf and
Smola,
17
Learning to Classify Text Using Support Vector Machines: Methods,
Theory, and Algorithms by Joachims,
18
Learning Kernel Classifiers by Her-
brich,
19
Least Squares Support Vector Machines by Suykens et al.,
20
and Kernel
Methods for Pattern Analysis by Shawe-Taylor and Cristianini.
21
Several author-
itative reviews and tutorials are highly recommended, namely those authored by
Scho
¨
lkopf et al.,
7
Smola and Scho
¨
lkopf,
22
Burges,
23
Scho
¨
lkopf et al.,
24
Suykens,
25
Scho
¨
lkopf et al.,
26
Campbell,
27
Scho
¨
lkopf and Smola,
28
and Sanchez.
29
In this chapter, we present an overview of SVM applications in chemistry.
We start with a nonmathematical introduction to SVM, which will give a
flavor of the basic principles of the method and its possible applications in che-
mistry. Next we introduce the field of pattern recognition, followed by a brief
overview of the statistical learning theory and of the Vapnik–Chervonenkis
dimension. A presentation of linear SVM followed by its extension to
nonlinear SVM and SVM regression is then provided to give the basic math-
ematical details of the theory, accompanied by numerous examples. Several
detailed examples of SVM classification (SVMC) and SVM regression
(SVMR) are then presented, for various structure-activity relationships
(SAR) and quantitative structure-activity relationships (QSAR) problems.
Chemical applications of SVM are reviewed, with examples from drug design,
QSAR, chemometrics, chemical engineering, and automatic recognition of
scientific information in text. Finally, SVM resources on the Web and free
SVM software are reviewed.
A NONMATHEMATICAL INTRODUCTION TO SVM
The principal characteristics of the SVM models are presented here in a
nonmathematical way and examples of SVM applications to classification and
regression problems are given in this section. The mathematical basis of SVM
will be presented in subsequent sections of this tutorial/review chapter.
SVM models were originally defined for the classification of linearly
separable classes of objects. Such an example is presented in Figure 1. For
292 Applications of Support Vector Machines in Chemistry
these two-dimensional objects that belong to two classes (class þ1 and class
1), it is easy to find a line that separates them perfectly.
For any particular set of two-class objects, an SVM finds the unique
hyperplane having the maximum margin (denoted with d in Figure 1). The
hyperplane H
1
defines the border with class þ1 objects, whereas the hyper-
plane H
2
defines the border with class 1 objects. Two objects from class
þ1define the hyperplane H
1
, and three objects from class 1define the hyper-
plane H
2
. These objects, represented inside circles in Figure 1, are called sup-
port vectors. A special characteristic of SVM is that the solution to a
classification problem is represented by the support vectors that determine
the maximum margin hyperplane.
SVM can also be used to separate classes that cannot be separated with a
linear classifier (Figure 2, left). In such cases, the coordinates of the objects are
mapped into a feature space using nonlinear functions called feature functions
f. The feature space is a high-dimensional space in which the two classes can
be separated with a linear classifier (Figure 2, right).
As presented in Figures 2 and 3, the nonlinear feature function f com-
bines the input space (the original coordinates of the objects) into the feature
space, which can even have an infinite dimension. Because the feature space
is high dimensional, it is not practical to use directly feature functions f in
+1
+1
+1
+1
+1
+1
−1
−1
−1
−1
−1
−1
δ
H
1
H
2
−1
−1
−1
+1
+1
Figure 1 Maximum separation hyperplane.
H
+1
+1
+1
+1
+1
+1
−1
−1
−1
−1
−1
−1
−1
−1
−1
−1
+1
+1
+1
+1
+1
+1
−1
−1
−1
−1
−1
−1
−1
−1
−1
−1
φ
Input space Feature space
Figure 2 Linear separation in feature space.
A Nonmathematical Introduction to SVM 293
computing the classification hyperplane. Instead, the nonlinear mapping
induced by the feature functions is computed with special nonlinear functions
called kernels. Kernels have the advantage of operating in the input space,
where the solution of the classification problem is a weighted sum of kernel
functions evaluated at the support vectors.
To illustrate the SVM capability of training nonlinear classifiers, consider
the patterns from Table 1. This is a synthetic dataset of two-dimensional patterns,
designed to investigate the properties of the SVM classification algorithm. All
figures from this chapter presenting SVM models for various datasets were
prepared with a slightly modified version of Gunn’s MATLAB toolbox,
In all figures, class þ1 pat-
terns are represented by þ, whereas class 1 patterns are represented by black
dots. The SVM hyperplane is drawn with a continuous line, whereas the mar-
gins of the SVM hyperplane are represented by dotted lines. Support vectors
from the class þ1 are represented as þinside a circle, whereas support vectors
from the class 1 are represented as a black dot inside a circle.
Input space
Feature s
p
ace
Output space
Figure 3 Support vector machines map the input space into a high-dimensional feature
space.
Table 1 Linearly Nonseparable Patterns Used for the
SVM Classification Models in Figures 4–6
Pattern x
1
x
2
Class
1 2 4.5 1
2 2.5 2.9 1
3 3 1.5 1
4 3.6 0.5 1
5 4.2 2 1
6 3.9 4 1
7 51 1
8 0.6 1 1
9 1 4.2 1
10 1.5 2.5 1
11 1.75 0.6 1
12 3 5.6 1
13 4.5 5 1
14 541
15 5.5 2 1
294 Applications of Support Vector Machines in Chemistry
Partitioning of the dataset from Table 1 with a linear kernel is shown in
Figure 4a. It is obvious that a linear function is not adequate for this dataset,
because the classifier is not able to discriminate the two types of patterns; all
patterns are support vectors. A perfect separation of the two classes can be
achieved with a degree 2 polynomial kernel (Figure 4b). This SVM model
has six support vectors, namely three from class þ1 and three from class
1. These six patterns define the SVM model and can be used to predict the
class membership for new patterns. The four patterns from class þ1 situated in
the space region bordered by the þ1 margin and the five patterns from class
1 situated in the space region delimited by the 1 margin are not important
in defining the SVM model, and they can be eliminated from the training set
without changing the SVM solution.
The use of nonlinear kernels provides the SVM with the ability to model
complicated separation hyperplanes in this example. However, because there
is no theoretical tool to predict which kernel will give the best results for a
given dataset, experimenting with different kernels is the only way to identify
the best function. An alternative solution to discriminate the patterns from
Table 1 is offered by a degree 3 polynomial kernel (Figure 5a) that has seven
support vectors, namely three from class þ1 and four from class 1. The
separation hyperplane becomes even more convoluted when a degree 10 poly-
nomial kernel is used (Figure 5b). It is clear that this SVM model, with 10 sup-
port vectors (4 from class þ1 and 6 from class 1), is not an optimal model for
the dataset from Table 1.
The next two experiments were performed with the B spline kernel
(Figure 6a) and the exponential radial basis function (RBF) kernel (Figure 6b).
Both SVM models define elaborate hyperplanes, with a large number of sup-
port vectors (11 for spline, 14 for RBF). The SVM models obtained with the
exponential RBF kernel acts almost like a look-up table, with all but one
Figure 4 SVM classification models for the dataset from Table 1: (a) dot kernel (linear),
Eq. [64]; (b) polynomial kernel, degree 2, Eq. [65].
A Nonmathematical Introduction to SVM 295
pattern used as support vectors. By comparing the SVM models from
Figures 4–6, it is clear that the best one is obtained with the degree 2 polyno-
mial kernel, the simplest function that separates the two classes with the low-
est number of support vectors. This principle of minimum complexity of the
kernel function should serve as a guide for the comparative evaluation and
selection of the best kernel. Like all other multivariate algorithms, SVM can
overfit the data used in training, a problem that is more likely to happen
when complex kernels are used to generate the SVM model.
Support vector machines were extended by Vapnik for regression
4
by
using an e-insensitive loss function (Figure 7). The learning set of patterns is
used to obtain a regression model that can be represented as a tube with radius
e fitted to the data. In the ideal case, SVM regression finds a function that maps
Figure 5 SVM classification models obtained with the polynomial kernel (Eq. [65]) for
the dataset from Table 1: (a) polynomial of degree 3; (b) polynomial of degree 10.
Figure 6 SVM classification models for the dataset from Table 1: (a) B spline kernel,
degree 1, Eq. [72]; (b) exponential radial basis function kernel, s ¼ 1, Eq. [67].
296 Applications of Support Vector Machines in Chemistry
all input data with a maximum deviation e from the target (experimental)
values. In this case, all training points are located inside the regression tube.
However, for datasets affected by errors, it is not possible to fit all the patterns
inside the tube and still have a meaningful model. For the general case, SVM
regression considers that the error for patterns inside the tube is zero, whereas
patterns situated outside the regression tube have an error that increases when
the distance to the tube margin increases (Figure 7).
30
The SVM regression approach is illustrated with a QSAR for angiotensin
II antagonists (Table 2) from a review by Hansch et al.
31
This QSAR, model-
ing the IC
50
for angiotensin II determined in rabbit aorta rings, is a nonlinear
equation based on the hydrophobicity parameter ClogP:
log1=IC
50
¼5:27ð1:0Þþ0:50ð0:19ÞClogP3:0ð0:83Þlogðb10
ClogP
þ1Þ
n ¼16 r
2
cal
¼0:849 s
cal
¼0:178 q
2
LOO
¼0:793 opt:ClogP ¼6:42
We will use this dataset later to demonstrate the kernel influence on the SVM
regression, as well as the effect of modifying the tube radius e. However, we
will not present QSAR statistics for the SVM model. Comparative QSAR
models are shown in the section on SVM applications in chemistry.
A linear function is clearly inadequate for the dataset from Table 2, so
we will not present the SVMR model for the linear kernel. All SVM regression
figures were prepared with the Gunn’s MATLAB toolbox. Patterns are repre-
sented by þ, and support vectors are represented as þinside a circle. The SVM
hyperplane is drawn with a continuous line, whereas the margins of the SVM
regression tube are represented by dotted lines. Several experiments with dif-
ferent kernels showed that the degree 2 polynomial kernel offers a good model
for this dataset, and we decided to demonstrate the influence of the tube radius
e for this kernel (Figures 8 and 9). When the e parameter is too small, the dia-
meter of the tube is also small forcing all patterns to be situated outside the
SVMR tube. In this case, all patterns are penalized with a value that increases
when the distance from the tube’s margin increases. This situation is demon-
strated in Figure 8a generated with e ¼ 0:05, when all patterns are support
+ε
−ε
0
Figure 7 Support vector machines regression determines a tube with radius e fitted to the
data.
A Nonmathematical Introduction to SVM 297
vectors. As e increases to 0.1, the diameter of the tube increases and the num-
ber of support vector decreases to 12 (Figure 8b), whereas the remaining pat-
terns are situated inside the tube and have zero error.
A further increase of e to 0.3 results in a dramatic change in the number
of support vectors, which decreases to 4 (Figure 9a), whereas an e of 0.5, with
two support vectors, gives an SVMR model with a decreased curvature
Table 2 Data for the Angiotensin II Antagonists QSAR
31
and for the
SVM Regression Models from Figures 8–11
N
N
N
C
4
H
9
O
N
NHN
N
X
No Substituent X ClogP log 1/IC
50
1 H 4.50 7.38
2 C
2
H
5
4.69 7.66
3 (CH
2
)
2
CH
3
5.22 7.82
4 (CH
2
)
3
CH
3
5.74 8.29
5 (CH
2
)
4
CH
3
6.27 8.25
6 (CH
2
)
5
CH
3
6.80 8.06
7 (CH
2
)
7
CH
3
7.86 6.77
8 CHMe
2
5.00 7.70
9 CHMeCH
2
CH
3
5.52 8.00
10 CH
2
CHMeCH
2
CMe
3
7.47 7.46
11 CH
2
-cy-C
3
H
5
5.13 7.82
12 CH
2
CH
2
-cy-C
6
H
11
7.34 7.75
13 CH
2
COOCH
2
CH
3
4.90 8.05
14 CH
2
CO
2
CMe
3
5.83 7.80
15 (CH
2
)
5
COOCH
2
CH
3
5.76 8.01
16 CH
2
CH
2
C
6
H
5
6.25 8.51
Figure 8 SVM regression models with a degree 2 polynomial kernel (Eq. [65]) for the
dataset from Table 2: (a) e ¼ 0:05; (b) e ¼ 0:1.
298 Applications of Support Vector Machines in Chemistry
(Figure 9b). These experiments illustrate the importance of the e parameter on
the SVMR model. Selection of the optimum value for e should be determined
by comparing the prediction statistics in cross-validation. The optimum value
of e depends on the experimental errors of the modeled property. A low e
should be used for low levels of noise, whereas higher values for e are appro-
priate for large experimental errors. Note that a low e results in SVMR models
with a large number of support vectors, whereas sparse models are obtained
with higher values for e.
We will explore the possibility of overfitting in SVM regression when
complex kernels are used to model the data, but first we must consider the
limitations of the dataset in Table 2. This is important because those data
might prevent us from obtaining a high-quality QSAR. First, the biological
data are affected by experimental errors and we want to avoid modeling those
errors (overfitting the model). Second, the influence of the substituent X is
characterized with only its hydrophobicity parameter ClogP. Although hydro-
phobicity is important, as demonstrated in the QSAR model, it might be that
other structural descriptors (electronic or steric) actually control the biological
activity of this series of compounds. However, the small number of com-
pounds and the limited diversity of the substituents in this dataset might not
reveal the importance of those structural descriptors. Nonetheless, it follows
that a predictive model should capture the nonlinear dependence between
ClogP and log 1/IC
50
, and it should have a low degree of complexity to avoid
modeling of the errors. The next two experiments were performed with the
degree 10 polynomial kernel (Figure 10a; 12 support vectors) and the expo-
nential RBF kernel with s ¼ 1 (Figure 10b; 11 support vectors). Both
SVMR models, obtained with e ¼ 0:1, follow the data too closely and fail
to recognize the general relationship between ClogP and log 1/IC
50
. The over-
fitting is more pronounced for the exponential RBF kernel, which therefore is
not a good choice for this QSAR dataset.
Interesting results are also obtained with the spline kernel (Figure 11a)
and the degree 1 B spline kernel (Figure 11b). The spline kernel offers an
Figure 9 SVM regression models with a degree 2 polynomial kernel (Eq. [65]) for the
dataset from Table 2: (a) e ¼ 0:3; (b) e ¼ 0:5.
A Nonmathematical Introduction to SVM 299
interesting alternative to the SVMR model obtained with the degree 2 polyno-
mial kernel. The tube is smooth, with a noticeable asymmetry, which might be
supported by the experimental data, as one can deduce after a visual inspec-
tion. Together with the degree 2 polynomial kernel model, this spline kernel
represents a viable QSAR model for this dataset. Of course, only detailed
cross-validation and parameter tuning can decide which kernel is best. In con-
trast with the spline kernel, the degree 1 B spline kernel displays clear signs of
overfitting, indicated by the complex regression tube. The hyperplane closely
follows every pattern and is not able to extract a broad and simple relationship
between ClogP and log 1/IC
50
.
The SVMR experiments that we have just carried out using the QSAR
dataset from Table 2 offer convincing proof for the SVM ability to model
nonlinear relationships but also their overfitting capabilities. This dataset
was presented only for demonstrative purposes, and we do not recommend
the use of SVM for QSAR models with such a low number of compounds
and descriptors.
Figure 10 SVM regression models with e ¼ 0:1 for the dataset of Table 2:
(a) polynomial kernel, degree 10, Eq. [65]; (b) exponential radial basis function kernel,
s ¼ 1, Eq. [67].
Figure 11 SVM regression models with e ¼ 0:1 for the dataset of Table 2: (a) spline
kernel, Eq. [71]; (b) B spline kernel, degree 1, Eq. [72].
300 Applications of Support Vector Machines in Chemistry
PATTERN CLASSIFICATION
Research in pattern recognition involves development and application of
algorithms that can recognize patterns in data.
32
These techniques have impor-
tant applications in character recognition, speech analysis, image analysis,
clinical diagnostics, person identification, machine diagnostics, and industrial
process supervision as examples. Many chemistry problems can also be solved
with pattern recognition techniques, such as recognizing the provenance of
agricultural products (olive oil, wine, potatoes, honey, etc.) based on compo-
sition or spectra, structural elucidation from spectra, identifying mutagens or
carcinogens from molecular structure, classification of aqueous pollu-
tants based on their mechanism of action, discriminating chemical compounds
based on their odor, and classification of chemicals in inhibitors and noninhi-
bitors for a certain drug target.
We now introduce some basic notions of pattern recognition. A pattern
(object) is any item (chemical compound, material, spectrum, physical object,
chemical reaction, industrial process) whose important characteristics form a
set of descriptors. A descriptor is a variable (usually numerical) that charac-
terizes an object. Note that in pattern recognition, descriptors are usually
called ‘‘features’’, but in SVM, ‘‘features’’ have another meaning, so we
must make a clear distinction here between ‘‘descriptors’’ and ‘‘features’’.A
descriptor can be any experimentally measured or theoretically computed
quantity that describes the structure of a pattern, including, for example, spec-
tra and composition for chemicals, agricultural products, materials, biological
samples; graph descriptors
33
and topological indices;
34
indices derived from
the molecular geometry and quantum calculations;
35,36
industrial process
parameters; chemical reaction variables; microarray gene expression data;
and mass spectrometry data for proteomics.
Each pattern (object) has associated with it a property value. A property
is an attribute of a pattern that is difficult, expensive, or time-consuming to
measure, or not even directly measurable. Examples of such properties include
concentration of a compound in a biological sample, material, or agricultural
product; various physical, chemical, or biological properties of chemical com-
pounds; biological toxicity, mutagenicity, or carcinogenicity; ligand/nonligand
for different biological receptors; and fault identification in industrial
processes.
The major hypothesis used in pattern recognition is that the descriptors
capture some important characteristics of the pattern, and then a mathemati-
cal function (e.g., machine learning algorithm) can generate a mapping (rela-
tionship) between the descriptor space and the property. Another hypothesis is
that similar objects (objects that are close in the descriptor space) have similar
properties. A wide range of pattern recognition algorithms are currently being
used to solve chemical problems. These methods include linear discriminant
analysis, principal component analysis, partial least squares (PLS),
37
artificial
Pattern Classification 301
neural networks,
38
multiple linear regression (MLR), principal component
regression, k-nearest neighbors (k-NN), evolutionary algorithms embedded
into machine learning procedures,
39
and large margin classifiers including,
of course, support vector machines.
A simple example of a classification problem is presented in Figure 12.
The learning set consists of 24 patterns, 10 in class þ1 and 14 in class 1.
In the learning (training) phase, the algorithm extracts classification rules
using the information available in the learning set. In the prediction phase,
the classification rules are applied to new patterns, with unknown class
membership, and each new pattern is assigned to a class, either þ1or1.
In Figure 12, the prediction pattern is indicated with ‘‘?’’.
We consider first a k-NN classifier, with k ¼ 1. This algorithm computes
the distance between the new pattern and all patterns in the training set, and
then it identifies the k patterns closest to the new pattern. The new pattern is
assigned to the majority class of the k nearest neighbors. Obviously, k should
be odd to avoid undecided situations. The k-NN classifier assigns the new pat-
tern to class þ1 (Figure 13) because its closest pattern belongs to this class.
The predicted class of a new pattern can change by changing the parameter k.
The optimal value for k is usually determined by cross-validation.
The second classifier considered here is a hyperplane H that defines two
regions, one for patterns þ1 and the other for patterns 1. New patterns are
assigned to class þ1 if they are situated in the space region corresponding to
the class þ1, but to class 1 if they are situated in the region corresponding to
class 1. For example, the hyperplane H in Figure 14 assigns the new pattern
to class 1. The approach of these two algorithms is very different: although
the k-NN classifier memorizes all patterns, the hyperplane classifier is defined
by the equation of a plane in the pattern space. The hyperplane can be used
only for linearly separable classes, whereas k-NN is a nonlinear classifier
and can be used for classes that cannot be separated with a linear hypersurface.
+1
−1
+1
−1
−1
−1
−1
−1
−1
−1
−1
−1
+1
+1
+1
+1
+1
+1
+1
−1
−1
−1
−1
+1
?
Figure 12 Example of a classification problem.
302 Applications of Support Vector Machines in Chemistry
An n-dimensional pattern (object) x has n coordinates, x ¼ðx
1
; x
2
; ; x
n
Þ,
where each x
i
is arealnumber, x
i
2 Rfor i ¼ 1, 2, , n. Each patternx
j
belongs to
aclassy
j
2f1; þ1g. Consider a training set T of m patterns together with their
classes, T ¼fðx
1
; y
1
Þ; ðx
2
; y
2
Þ; ; ðx
m
; y
m
Þg. Consider a dot product space S,in
which the patterns x are embedded, x
1
, x
2
, , x
m
2 S. Any hyperplane in the
space S can be written as
fx 2 Sjw x þ b ¼ 0g; w 2 S; b 2 R ½1
The dot product w x is defined by
w x ¼
X
n
i¼1
w
i
x
i
½2
H
+1
−1
+1
−1
−1
−1
−1
−1
−1
−1
−1
−1
+1
+1
+1
+1
+1
+1
+1
−1
−1
−1
−1
+1
−1
Figure 14 Using the linear classifier defined by the hyperplane H, the pattern . is
predicted to belong to the class 1.
+1
−1
+1
−1
−1
−1
−1
−1
−1
−1
−1
−1
+1
+1
+1
+1
+1
+1
+1
−1
−1
−1
−1
+1
+1
Figure 13 Using the k-NN classifier (k ¼ 1), the pattern . is predicted to belong to the
class þ1.
Pattern Classification 303
A hyperplane w x þ b ¼ 0 can be denoted as a pair (w, b). A training set
of patterns is linearly separable if at least one linear classifier exists defined by
the pair (w, b), which correctly classifies all training patterns (see Figure 15).
All patterns from class þ1 are located in the space region defined by
w x þ b > 0, and all patterns from class 1 are located in the space region
defined by w x þ b < 0. Using the linear classifier defined by the pair (w,
b), the class of a pattern x
k
is determined with
classðx
k
Þ¼
þ1ifw x
k
þ b > 0
1ifw x
k
þ b < 0
&
½3
The distance from a point x to the hyperplane defined by (w, b)is
dðx; w; bÞ¼
jw x þ bj
jjwjj
½4
where jjwjj is the norm of the vector w.
Of all the points on the hyperplane, one has the minimum distance d
min
to the origin (Figure 16):
d
min
¼
jbj
jjwjj
½5
In Figure 16, we show a linear classifier (hyperplane H defined by w x þb ¼ 0),
the space region for class þ1 patterns (defined by w x þ b > 0), the space region
for class 1 patterns (defined by w x þ b < 0), and the distance between origin
and the hyperplane H (jbj=jjwjj).
Consider a group of linear classifiers (hyperplanes) defined by a set of pairs
(w, b) that satisfy the following inequalities for any pattern x
i
in the training set:
w x
i
þ b > 0ify
i
¼þ1
w x
i
þ b < 0ify
i
¼1
&
½6
H
+1
−1
−1
−1
−1
−1
−1
+1
+1
+1
+1
−1
−1
−1
+1
w·x
i
+b=0
w·x
i
+b>0
w·x
i
+b<0
Class +1
Class −1
Figure 15 The classification hyperplane defines a region for class þ1 and another region
for class 1.
304 Applications of Support Vector Machines in Chemistry
This group of (w, b) pairs defines a set of classifiers that are able to make a
complete separation between two classes of patterns. This situation is illu-
strated in Figure 17.
In general, for each linearly separable training set, one can find an infinite
number of hyperplanes that discriminate the two classes of patterns. Although
all these linear classifiers can perfectly separate the learning patterns, they are
not all identical. Indeed, their prediction capabilities are different. A hyper-
plane situated in the proximity of the border þ1 patterns will predict as 1
all new þ1 patterns that are situated close to the separation hyperplane but
in the 1 region (w x þb < 0). Conversely, a hyperplane situated in the
proximity of the border 1 patterns will predict as þ1 all new 1 patterns situ-
ated close to the separation hyperplane but in the þ1 region (w x þ b > 0). It
is clear that such classifiers have little prediction success, which led to the idea
+1
−1
+1
−1
−1
−1
−1
−1
−1
−1
−1
−1
+1
+1
+1
+1
+1
+1
+1
−1
−1
−1
−1
+1
Figure 17 Several hyperplanes that correctly classify the two classes of patterns.
H
w
Hyperplane: w·x
i
+b=0
w·x
i
+b>0
w·x
i
+b<0
Class +1
Class −1
|b| /||w||
Figure 16 The distance from the hyperplane to the origin.
Pattern Classification 305
of wide margin classifiers, i.e., a hyperplane with a buffer toward the þ1 and
1 space regions (Figure 18).
For some linearly separable classification problems having a finite num-
ber of patterns, it is generally possible to define a large number of wide margin
classifiers (Figure 18). Chemometrics and pattern recognition applications sug-
gest that an optimum prediction could be obtained with a linear classifier that
has a maximum margin (separation between the two classes), and with the
separation hyperplane being equidistant from the two classes. In the next sec-
tion, we introduce elements of statistical learning theory that form the basis of
support vector machines, followed by a section on linear support vector
machines in which the mathematical basis for computing a maximum margin
classifier with SVM is presented.
THE VAPNIK–CHERVONENKIS DIMENSION
Support vector machines are based on the structural risk minimization
(SRM), derived from statistical learning theory.
4,5,10
This theory is the basis
for finding bounds for the classification performance of machine learning
algorithms. Another important result from statistical learning theory is
the performance estimation of finite set classifiers and the convergence of
their classification performance toward that of a classifier with an infinite
number of learning samples. Consider a learning set of m patterns. Each
pattern consists of a vector of characteristics x
i
2 R
n
andanassociatedclass
membership y
i
. The task of the machine learning algorithm is to find the
rules of the mapping x
i
! y
i
. The machine model is a possible mapping
x
i
! fðx
i
; p), where each model is defined by a set of parameters p. Training
a machine learning algorithm results in finding an optimum set of para-
meters p. The machine algorithm is considered to be deterministic; i.e.,
for a given input vector x
i
and a set of parameters p, the output will be
always f ðx
i
; p). The expectation for the test error of a machine trained
+1
+1
+1
+1
+1
+1
+1
+1
−1
−1
−1
−1
−1
−1
−1
−1
−1
Figure 18 Examples of margin hyperplane classifiers.
306 Applications of Support Vector Machines in Chemistry
with an infinite number of samples is denoted by e(p) (called expected risk
or expected error). The empirical risk e
emp
(p) is the measured error for a
finite number of patterns in the training set:
e
emp
ðpÞ¼
1
2m
X
m
i¼1
jy
i
fðx
i
; pÞj ½7
The quantity ½jy
i
fðx
i
; pÞj is called the loss, and for a two-class classifica-
tion, it can take only the values 0 and 1. Choose a value Z such that
0 Z 1. For losses taking these values, with probability 1 Z, the follow-
ing bound exists for the expected risk:
eðpÞe
emp
ðpÞþ
ffiffiffiffiffiffiffiffiffiffiffiffiffiffiffiffiffiffiffiffiffiffiffiffiffiffiffiffiffiffiffiffiffiffiffiffiffiffiffiffiffiffiffiffiffiffiffiffiffiffiffiffiffiffiffiffiffiffiffiffiffiffiffiffiffiffiffiffiffiffiffi
d
VC
ðlogð2m=d
VC
Þþ1ÞlogðZ=4Þ
m
r
½8
where d
VC
is a non-negative integer, called the Vapnik–Chervonenkis (VC)
dimension of a classifier, that measures the capacity of a classifier. The
right-hand side of this equation defines the risk bound. The second term in
the right-hand side of the equation is called VC confidence.
We consider the case of two-class pattern recognition, when the function
f ðx
i
; p) can take only two values, e.g., þ1 and 1. Consider a set of m points
and all their two-class labelings. If for each of the 2
m
labelings one can find a
classifier f(p) that correctly separates class þ1 points from class 1 points,
then that set of points is separated by that set of functions. The VC dimension
for a set of functions ff ðpÞg is defined as the maximum number of points that
can be separated by ffðpÞg. In two dimensions, three samples can be separated
with a line for each of the six possible combinations (Figure 19, top panels). In
the case of four training points in a plane, there are two cases that cannot be
separated with a line (Figure 19, bottom panels). These two cases require a
classifier of higher complexity, with a higher VC dimension. The example
·
°
·
·
°
°
°
·
·
°
°
·
°
°
·
°
°
·
°
°
·
·
°
·
°
°
°°
·
°
°
°
°
°
°
·
··
·
··
·
Figure 19 In a plane, all combinations of three points from two classes can be separated
with a line. Four points cannot be separated with a linear classifier.
The Vapnik–Chervonenkis Dimension 307
from Figure 19 shows that the VC dimension of a set of lines in R
2
is three.
A family of classifiers has an infinite VC dimension if it can separate m points,
with m being arbitrarily large.
The VC confidence term in Eq. [8] depends on the chosen class of funct-
ions, whereas the empirical risk and the actual risk depend on the particular
function obtained from the training algorithm.
23
It is important to find a sub-
set of the selected set of functions such that the risk bound for that subset is
minimized. A structure is introduced by classifying the whole class of functions
into nested subsets (Figure 20), with the property d
VC;1
< d
VC;2
< d
VC;3
. For
each subset of functions, it is either possible to compute d
VC
or to get a bound
on the VC dimension. Structural risk minimization consists of finding the sub-
set of functions that minimizes the bound on the actual risk. This is done by
training for each subset a machine model. For each model the goal is to mini-
mize the empirical risk. Subsequently, one selects the machine model whose
sum of empirical risk and VC confidence is minimal.
PATTERN CLASSIFICATION WITH LINEAR
SUPPORT VECTOR MACHINES
To apply the results from the statistical learning theory to pattern classi-
fication one has to (1) choose a classifier with the smallest empirical risk and
(2) choose a classifier from a family that has the smallest VC dimension. For a
linearly separable case condition, (1) is satisfied by selecting any classifier that
completely separates both classes (for example, any classifier from Figure 17),
whereas condition (2) is satisfied for the classifier with the largest margin.
SVM Classification for Linearly Separable Data
The optimum separation hyperplane (OSH) is the hyperplane with the
maximum margin for a given finite set of learning patterns. The OSH compu-
tation with a linear support vector machine is presented in this section.
The Optimization Problem
Based on the notations from Figure 21, we will now establish the condi-
tions necessary to determine the maximum separation hyperplane. Consider a
d
VC,1
d
VC,2
d
VC,3
Figure 20 Nested subsets of function, ordered by VC dimension.
308 Applications of Support Vector Machines in Chemistry
linear classifier characterized by the set of pairs (w, b) that satisfy the follow-
ing inequalities for any pattern x
i
in the training set:
w x
i
þ b > þ1ify
i
¼þ1
w x
i
þ b < 1ify
i
¼1
&
½9
These equations can be expressed in compact form as
y
i
ðw x
i
þ bÞþ1 ½10
or
y
i
ðw x
i
þ bÞ1 0 ½11
Because we have considered the case of linearly separable classes, each
such hyperplane (w, b) is a classifier that correctly separates all patterns
from the training set:
classðx
i
Þ¼
þ1ifw x
i
þ b > 0
1ifw x
i
þ b < 0
&
½12
For the hyperplane H that defines the linear classifier (i.e., where
w x þ b ¼ 0), the distance between the origin and the hyperplane H is
jbj=jjwjj. We consider the patterns from the class 1 that satisfy the equality
w x þ b ¼1 and that determine the hyperplane H
1
; the distance between
the origin and the hyperplane H
1
is equal to j1 bj=jjwjj. Similarly, the pat-
terns from the class þ1 satisfy the equality w x þ b ¼þ1 and that determine
H
1
H
2
H
+1
−1 +1
−1
−1
−1
−1
−1
+1
+1
+1
+1
+1
+1
−1
−1
−1
+1
2/|| w ||
w
w·x
i
+b>+1
w·x
i
+b=+1
w·x
i
+b= −1
w·x
i
+b=0
w·x
i
+b<−1
Figure 21 The separating hyperplane.
Pattern Classification with Linear Support Vector Machines 309
the hyperplane H
2
; the distance between the origin and the hyperplane H
2
is
equal to jþ1 bj=jjwjj. Of course, hyperplanes H, H
1
, and H
2
are parallel
and no training patterns are located between hyperplanes H
1
and H
2
. Based
on the above considerations, the margin of the linear classifier H (the distance
between hyperplanes H
1
and H
2
)is2=jjwjj.
We now present an alternative method to determine the distance
between hyperplanes H
1
and H
2
. Consider a point x
0
located on the hyper-
plane H and a point x
1
located on the hyperplane H
1
, selected in such a
way that (x
0
x
1
) is orthogonal to the two hyperplanes. These points satisfy
the following two equalities:
w x
0
þ b ¼ 0
w x
1
þ b ¼1
&
½13
By subtracting the second equality from the first equality, we obtain
w ðx
0
x
1
Þ¼1 ½14
Because (x
0
x
1
) is orthogonal to the hyperplane H, and w is also orthogonal
to H, then (x
0
x
1
)andw are parallel, and the dot product satisfies
jw ðx
0
x
1
Þj ¼ jjwjj jjx
0
x
1
jj ½15
From Eqs. [14] and [15], we obtain the distance between hyperplanes H and
H
1
:
jjx
0
x
1
jj ¼
1
jjwjj
½16
Similarly, a point x
0
located on the hyperplane H and a point x
2
located on the
hyperplane H
2
, selected in such a way that (x
0
x
2
) is orthogonal to the two
hyperplanes, will satisfy the equalities:
w x
0
þ b ¼ 0
w x
2
þ b ¼þ1
&
½17
Consequently, the distance between hyperplanes H and H
2
is
jjx
0
x
2
jj ¼
1
jjwjj
½18
Therefore, the margin of the linear classifier defined by (w, b)is2=jjwjj. The
wider the margin, the smaller is d
VC
, the VC dimension of the classifier. From
310 Applications of Support Vector Machines in Chemistry
these considerations, it follows that the optimum separation hyperplane is
obtained by maximizing 2=jjwjj, which is equivalent to minimizing jjwjj
2
=2.
The problem of finding the optimum separation hyperplane is repre-
sented by the identification of the linear classifier (w, b), which satisfies
w x
i
þ b þ1ify
i
¼þ1
w x
i
þ b 1ify
i
¼1
&
½19
for which ||w|| has the minimum value.
Computing the Optimum Separation Hyperplane
Based on the considerations presented above, the OSH conditions from
Eq. [19] can be formulated into the following expression that represents a
linear SVM:
minimize f ðxÞ¼
jjwjj
2
2
with the constraints g
i
ðxÞ¼y
i
ðw x
i
þ bÞ1 0; i ¼ 1; ; m
½20
The optimization problem from Eq. [20] represents the minimization of a
quadratic function under linear constraints (quadratic programming), a
problem studied extensively in optimization theory. Details on quadratic pro-
gramming can be found in almost any textbook on numerical optimization,
and efficient implementations exist in many software libraries. However,
Eq. [20] does not represent the actual optimization problem that is solved to
determine the OSH. Based on the use of a Lagrange function, Eq. [20] is trans-
formed into its dual formulation. All SVM models (linear and nonlinear, clas-
sification and regression) are solved for the dual formulation, which has
important advantages over the primal formulation (Eq. [20]). The dual pro-
blem can be easily generalized to linearly nonseparable learning data and to
nonlinear support vector machines.
A convenient way to solve constrained minimization problems is by
using a Lagrangian function of the problem defined in Eq. [20]:
L
P
ðw; b; LÞ¼f ðxÞþ
X
m
i¼0
l
i
g
i
ðxÞ¼
1
2
kwk
2
X
m
i¼1
l
i
ðy
i
ðw x
i
þ bÞ1Þ
¼
1
2
kwk
2
X
m
i¼1
l
i
y
i
ðw x
i
þ bÞþ
X
m
i¼1
l
i
¼
1
2
kwk
2
X
m
i¼1
l
i
y
i
w x
i
X
m
i¼1
l
i
y
i
b þ
X
m
i¼1
l
i
½21
Here L ¼ðl
1
; l
2
; ; l
m
) is the set of Lagrange multipliers of the training
(calibration) patterns with l
i
0, and P in L
P
indicates the primal
Pattern Classification with Linear Support Vector Machines 311
formulation of the problem. The Lagrangian function L
P
must be minimized
with respect to w and b, and maximized with respect to l
i
, subject to the con-
straints l
i
0. This is equivalent to solving the Wolfe dual problem,
40
namely
to maximize L
P
subject to the constraints that the gradient of L
P
with respect
to w and b is zero, and subject to the constraints l
i
0.
The Karuch–Kuhn–Tucker (KKT)
40
conditions for the primal problem
are as follows:
Gradient Conditions
qL
P
ðw; b;LÞ
qw
¼ w
X
m
i¼1
l
i
y
i
x
i
¼ 0; where
qL
P
ðw; b;LÞ
qw
¼
qL
qw
1
;
qL
qw
2
; ;
qL
qw
n
½22
qL
P
ðw; b;LÞ
qb
¼
X
m
i¼1
l
i
y
i
¼ 0 ½23
qL
P
ðw; b;LÞ
ql
i
¼ g
i
ðxÞ¼0 ½24
Orthogonality Condition
l
i
g
i
ðxÞ¼l
i
½y
i
ðw x
i
þ bÞ1¼0; i ¼ 1; ; m ½25
Feasibility Condition
y
i
ðw x
i
þ bÞ1 0; i ¼ 1; ; m ½26
Non-negativity Condition
l
i
0; i ¼ 1; ; m ½27
Solving the SVM problem is equivalent to finding a solution to the KKT
conditions. We are now ready to formulate the dual problem L
D
:
maximize L
D
ðw; b; LÞ¼
X
m
i¼1
l
i
1
2
X
m
i¼1
X
m
j¼1
l
i
l
j
y
i
y
j
x
i
x
j
subject to l
i
0; i ¼ 1; ; m
and
X
m
i¼1
l
i
y
i
¼ 0
½28
Both the primal L
P
and the dual L
D
Lagrangian functions are derived from the
same objective functions but with different constraints, and the solution is
312 Applications of Support Vector Machines in Chemistry
found by minimizing L
P
or by maximizing L
D
. The most popular algorithm
for solving the optimization problem is the sequential minimal optimization
(SMO) proposed by Platt.
41
When we introduced the Lagrange function we assigned a Lagrange
multiplier l
i
to each training pattern via the constraints g
i
(x) (see Eq. [20]).
The training patterns from the SVM solution that have l
i
> 0 represent the
support vectors. The training patterns that have l
i
¼ 0 are not important in
obtaining the SVM model, and they can be removed from training without
any effect on the SVM solution. As we will see below, any SVM model is com-
pletely defined by the set of support vectors and the corresponding Lagrange
multipliers.
The vector w that defines the OSH (Eq. [29]) is obtained by using Eq. [22]:
w ¼
X
m
i¼1
l
i
y
i
x
i
½29
To compute the threshold b of the OSH, we consider the KKT condition
of Eq. [25] coupled with the expression for w from Eq. [29] and the condition
l
j
> 0, which leads to
X
m
i¼1
l
i
y
i
x
i
x
j
þ b ¼ y
j
½30
Therefore, the threshold b can be obtained by averaging the b values obtained
for all support vector patterns, i.e., the patterns with l
j
> 0:
b ¼ y
j
X
m
i¼1
l
i
y
i
x
i
x
j
½31
Prediction for New Patterns
In the previous section, we presented the SVM algorithm for training a
linear classifier. The result of this training is an optimum separation hyper-
plane defined by (w, b) (Eqs. [29] and [31]). After training, the classifier is
ready to predict the class membership for new patterns, different from those
used in training. The class of a pattern x
k
is determined with
classðx
k
Þ¼
þ1ifw x
k
þ b > 0
1ifw x
k
þ b < 0
&
½32
Therefore, the classification of new patterns depends only on the sign of the
expression w x þb. However, Eq. [29] offers the possibility to predict new
Pattern Classification with Linear Support Vector Machines 313
patterns without computing the vector w explicitly. In this case, we will use for
classification the support vectors from the training set and the corresponding
values of the Lagrange multipliers l
i
:
classðx
k
Þ¼sign
X
m
i¼1
l
i
y
i
x
i
x
k
þ b
!
½33
Patterns that are not support vectors (l
i
¼ 0) do not influence the classification
of new patterns. The use of Eq. [33] has an important advantage over using
Eq. [32]: to classify a new pattern x
k
, it is only necessary to compute the
dot product between x
k
and every support vector. This results in a significant
saving of computational time whenever the number of support vectors is small
compared with the total number of patterns in the training set. Also, Eq. [33]
can be easily adapted for nonlinear classifiers that use kernels, as we will show
later.
For a particular SVM problem (training set, kernel, kernel parameters),
the optimum separation hyperplane is determined only by the support vectors
(Figure 22a). By eliminating from training those patterns that are not support
vectors (l
i
¼ 0), the SVM solution does not change (Figure 22b). This property
suggests a possible approach for accelerating the SVM learning phase, in
which patterns that cannot be support vectors are eliminated from learning.
Example of SVM Classification for Linearly Separable Data
We now present several SVM classification experiments for a dataset
that is linearly separable (Table 3). This exercise is meant to compare the lin-
ear kernel with nonlinear kernels and to compare different topologies for the
separating hyperplanes. All models used an infinite value for the capacity
parameter C (no tolerance for misclassified patterns; see Eq. [39]).
H
(a) (b)
1
H
2
H
+1
−1
+1
−1
−1
−1
−1
−1
−1
−1
−1
−1
+1
+1
+1
+1
+1
+1
+1
−1
−1
−1
−1
+1
H
1
H
2
H
+1
+1
−1
−1
−1
Figure 22 The optimal hyperplane classifier obtained with all training patterns (a) is
identical with the one computed with only the support vector patterns (b).
314 Applications of Support Vector Machines in Chemistry
As expected, a linear kernel offers a complete separation of the two
classes (Figure 23a), with only three support vectors, namely one from class
þ1andtwofromclass1. The hyperplane has the maximum width and
provides both a sparse solution and a good prediction model for new pat-
terns. Note that, according to the constraints imposed in generating this
SVMC model, no patterns are allowed inside the margins of the classifier
(margins defined by the two bordering hyperplanes represented with dotted
lines). To predict the class attribution for new patterns, one uses Eq. [33]
applied to the three support vectors. The next experiment uses a degree 2
polynomial kernel (Figure 23b), which gives a solution with five support
vectors, namely two from class þ1 and three from class 1. The model is
not optimal for this dataset, but it still provides an acceptable hyperplane
Figure 23 SVM classification models for the dataset from Table 3: (a) dot kernel
(linear), Eq. [64]; (b) polynomial kernel, degree 2, Eq. [65].
Table 3 Linearly Separable Patterns Used for the SVM
Classification Models in Figures 23–25
Pattern x
1
x
2
Class
1 1 5.5 1
2 2.25 5 1
3 3.25 4.25 1
4 4 5.2 1
5 5.25 2.25 1
6 5.5 4 1
7 0.5 3.5 1
8 121
9 1.5 1 1
10 2.25 2.7 1
11 3 0.8 1
12 3.75 1.25 1
13 5 0.6 1
Pattern Classification with Linear Support Vector Machines 315