Predictive maintenance as a means to increase the availability of positive displacement pumps at Ekurhuleni Base Metals
Bạn đang xem bản rút gọn của tài liệu. Xem và tải ngay bản đầy đủ của tài liệu tại đây (1.65 MB, 115 trang )
COPYRIGHT AND CITATION CONSIDERATIONS FOR THIS THESIS/ DISSERTATION
o Attribution — You must give appropriate credit, provide a link to the license, and indicate if
changes were made. You may do so in any reasonable manner, but not in any way that
suggests the licensor endorses you or your use.
o NonCommercial — You may not use the material for commercial purposes.
o ShareAlike — If you remix, transform, or build upon the material, you must distribute your
contributions under the same license as the original.
How to cite this thesis
Surname, Initial(s). (2012) Title of the thesis or dissertation. PhD. (Chemistry)/ M.Sc. (Physics)/
M.A. (Philosophy)/M.Com. (Finance) etc. [Unpublished]: University of Johannesburg. Retrieved
from:
I
R
O
(Accessed:
Date).
›Predictive maintenance as a means to increase the availability of positive displacement
pumps at Ekurhuleni Base Metals
A minor dissertation submitted in partial fulfilment of the requirements for the degree
in
MAGISTER OF PHILOSOPHIAE
in
ENGINEERING MANAGEMENT
at the
FACULTY OF ENGINEERING AND THE BUILT ENVIRONMENT
of the
UNIVERSITY of JOHANNESBURG
MOTLALEPULA LAWRENCE KAU
NOVEMBER 2016
SUPERVISOR: DR ARIE WESSELS
CO-SUPERVISOR: PROF JAN-HARM PRETORIUS
DECLARATION
I, Motlalepula Lawrence Kau declare that this research is my own work, and it has never been
submitted to any university worldwide for examination purposes. This research is submitted
to the University of Johannesburg in Gauteng, South Africa, for the Master’s degree in
Engineering Management.
Signed ………………………………
Date ……………………………
ii
ACKNOWLEDGEMENTS
I extend special thanks to my two study leaders, Dr Arie Wessels and Prof Jan-Harm
Pretorius, for their advice and support during my research.
I would also like to thank Dr Michael Moolman, General Manager of Ekurhuleni Base
Metals, and his team; my colleague Dr Surajit Bag, and Mr William Chabant, sales manager
at Flowrox, for their support and guidance during my research.
I extend gratitude also to my grandparents in heaven, Richard and Lydia Kau, for
encouraging me to further my studies. My family, especially my daughter Reitumetse Kau
has always encouraged and supported me throughout my master’s degree programme.
iii
ABSTRACT
Condition monitoring is a maintenance technique used to monitor parameters like vibration,
overheating, overcurrent of the system or machinery at an early stage of failure; to forecast on
the need for maintenance before a catastrophic failure; or to estimate system conditions. It
can be achieved through visual inspection or the use of a sophisticated intelligent diagnosis
system.
Predictive maintenance helps the organisation to predict failure before a catastrophic failure.
It is a technique to help the user plan the job that needs to be done on the equipment to
prevent an unexpected failure. This technique is central to our research question. This study
investigated whether predictive maintenance is the best maintenance strategy to minimise
maintenance costs.
In predictive maintenance, decisions are made based on the data collected through condition
monitoring. Condition monitoring has three steps: data acquisition, data processing and
maintenance decision-making. Condition monitoring helps to prevent equipment failure. It
also helps to avoid unplanned breakdowns and to optimise maintenance resources by
planning maintenance or shutdown as required based on the data collected.
Peristaltic pumps, such as LPPT 65 (DN65), are commonly used for pumping slurry.
Ekurhuleni Base Metals uses it to pump slurry. Due to several failures, the pumps are not
operating at their peak efficiency point. Before the implementation of predictive
maintenance, the pumps did not receive regular maintenance. In the past, the organisation did
reactive maintenance, and maintenance costs were escalating.
Root Cause Failure Analysis (RCFA) helps to understand the root cause of equipment failure,
and is commonly used to reduce costs, mean time to failure (MTTF) and mean down time
(MDT). If implemented successfully, the organisation benefits significantly in terms of cost
savings and/or total elimination of failure.
Organisations benefit considerably from implementing Reliability Centred Maintenance
(RCM). It aims to identify routine maintenance that preserves the system in such a way that
costs are acceptable. If preventive maintenance costs are higher than those of operational
losses and repair, maintenance will not be beneficial, unless it relates to regulatory, safety or
environmental requirements.
iv
Total Productive Maintenance (TPM) is a known method to improve and enhance an
organisation’s productivity. The main objective of TPM is to improve Original Equipment
Effectiveness (OEE).
v
TABLE OF CONTENTS
DECLARATION......................................................................................................................ii
ACKNOWLEDGEMENTS .................................................................................................. iii
ABSTRACT ............................................................................................................................. iv
LIST OF FIGURES ................................................................................................................ ix
LIST OT TABLES .................................................................................................................. xi
ACRONYMS ..........................................................................................................................xii
CHAPTER 1. INTRODUCTION ........................................................................................... 1
1.1 Dissertation Outline .................................................................................................... 1
1.2 Background of Ekurhuleni Base Metals ................................................................... 1
1.2.1 Plant decommissioning and dismantling of plant equipment ................................. 1
1.2.2 Reprocessing of old Zincor residue ....................................................................... 1
1.2.3 Treatment of contaminated water .......................................................................... 2
1.2.4 Reclamation of gold tailings .................................................................................. 2
1.2.5 Removal of miscellaneous waste and clean up of surrounding areas.................... 2
1.3 Environmental Impact ................................................................................................ 2
1.4 Applicable Legislation ................................................................................................ 2
1.5 Problem Statement ...................................................................................................... 3
1.5.1 Breakdown of failures ........................................................................................... 4
1.5.2 Current maintenance strategy at EBM.................................................................... 5
1.6 Research Objectives .................................................................................................... 6
1.7 Research Questions ..................................................................................................... 6
1.8 Research Methods ...................................................................................................... 6
1.9 Chapter Summary ...................................................................................................... 6
CHAPTER 2. LITERATURE REVIEW ............................................................................... 7
2.1 Introduction ................................................................................................................. 7
2.2 Peristaltic Pumps ....................................................................................................... 11
2.2.1 Basic operation of peristaltic pump ...................................................................... 11
2.2.2 Types of peristaltic pumps .................................................................................... 11
2.2.3 Factors that influence pump availability .............................................................. 16
2.2.4 Bathtub curve ........................................................................................................ 16
2.2.5 Maintenance strategies ......................................................................................... 17
2.2.6 RCM and FMECA ................................................................................................ 18
2.2.7 Predictive maintenance ......................................................................................... 20
2.2.8 Preventive maintenance ........................................................................................ 21
2.2.9 Root Cause Failure Analysis ................................................................................ 22
2.2.10Fault tree analysis ................................................................................................... 22
2.2.11FRACAS ................................................................................................................. 23
2.2.12Total productive maintenance ................................................................................ 25
2.2.13Condition monitoring techniques ........................................................................... 28
2.2.14Vibration analysis ................................................................................................... 28
vi
C.33.44.55.54.78.65.5.43.22.2.4..22.Tai lieu. Luan 66.55.77.99. van. Luan an.77.99.44.45.67.22.55.77.C.37.99.44.45.67.22.55.77.C.37.99.44.45.67.22.55.77.C.37.99.44.45.67.22.55.77.C.33.44.55.54.78.655.43.22.2.4.55.22. Do an.Tai lieu. Luan van. Luan an. Do an.Tai lieu. Luan van. Luan an. Do an
2.2.15Oil analysis ............................................................................................................. 29
2.2.16Noise analysis ......................................................................................................... 29
2.2.17Visual inspection .................................................................................................... 30
2.2.18Temperature monitoring ......................................................................................... 30
2.3 Conclusion .................................................................................................................. 31
CHAPTER 3. RESEARCH METHOD ............................................................................... 32
3.1 Introduction .............................................................................................................. 32
3.2 Research Method ...................................................................................................... 32
3.3 Survey ........................................................................................................................ 32
3.4 Questionnaire design ................................................................................................ 32
3.5 Documentary Sources .............................................................................................. 33
3.6 Justification of Research Method ........................................................................... 33
3.7 Study Matrix ............................................................................................................. 34
3.8 Data Collection ......................................................................................................... 35
3.9 Data Analysis and Data Interpretation .................................................................. 35
3.10 Conclusion ............................................................................................................... 35
CHAPTER 4. RESULTS AND FINDINGS OF THE RESEARCH INTERVIEWS AND
FIELD DATA ......................................................................................................................... 36
4.1 Introduction ............................................................................................................... 36
4.2 Response to Questionnaires ..................................................................................... 36
4.3 Discussion and Graphs ............................................................................................ 36
4.3.1 Maintenance personnel ......................................................................................... 36
4.3.2 Maintenance superintendent ................................................................................. 45
4.3.3 Procurement manager ........................................................................................... 46
4.3.4 Control room operators ......................................................................................... 46
4.3.5 Production manager .............................................................................................. 47
4.3.6 Sales manager from Flowrox ................................................................................ 48
4.4 Field Data and Results .............................................................................................. 49
4.5 Classification of Failures ......................................................................................... 49
4.6 Total Downtime and Maintenance.......................................................................... 50
4.7 Total Downtime Failures ......................................................................................... 50
4.8 Predictive Maintenance Implementation ............................................................... 51
4.8.1 Methods used in electric motor condition monitoring......................................... 51
4.9 Stator Current Analysis ............................................................................................ 53
4.9.1 Stator.................................................................................................................... 54
4.9.2 Bearing................................................................................................................. 55
4.9.3 Rotor .................................................................................................................... 56
4.10 Results of Predictive Maintenance......................................................................... 56
4.11 Conclusion ................................................................................................................ 58
CHAPTER 5. RESEARCH DISCUSSION RESULTS ...................................................... 59
5.1 Introduction ............................................................................................................... 59
5.2 Research Question No 1: Will predictive maintenance increase the availability of
positive displacement pumps? ........................................................................................... 59
5.3 Research Question No 2: What are the parameters that must be controlled and
monitored in predictive maintenance? ............................................................................. 61
@edu.gmail.com.vn.bkc19134.hmu.edu.vn
vii
C.33.44.55.54.78.65.5.43.22.2.4..22.Tai lieu. Luan 66.55.77.99. van. Luan an.77.99.44.45.67.22.55.77.C.37.99.44.45.67.22.55.77.C.37.99.44.45.67.22.55.77.C.37.99.44.45.67.22.55.77.C.33.44.55.54.78.655.43.22.2.4.55.22. Do an.Tai lieu. Luan van. Luan an. Do an.Tai lieu. Luan van. Luan an. Do an
5.3.1 Pump installation ................................................................................................. 64
5.3 Benefits of Predictive Maintenance ........................................................................ 65
5.4 Conclusion ................................................................................................................. 66
CHAPTER 6. CONCLUSION .............................................................................................. 67
6.1 Conclusion to the Research questions .................................................................... 67
6.1.1 Does predictive maintenance increase the availability of positive displacement
pumps? ………………………………………………………………………………….67
6.1.2 What are the parameters that must be controlled and monitored in predictive
maintenance? .................................................................................................................... 67
6.2 Conclusion and Research Objectives ..................................................................... 67
6.3 Recommendations .................................................................................................... 68
6.4 Future Research ....................................................................................................... 69
REFERENCES ....................................................................................................................... 70
APPENDIX 1: QUESTIONNAIRES………………………………………………………76
APPENDIX 2: MAINTENANCE AND DOWNTIME BEFORE PREDICTIVE
MAINTENANCE APPLIED ................................................................................................ 95
APPENDIX 3: PUMP FAILURE RATES........................................................................... 97
@edu.gmail.com.vn.bkc19134.hmu.edu.vn
viii
C.33.44.55.54.78.65.5.43.22.2.4..22.Tai lieu. Luan 66.55.77.99. van. Luan an.77.99.44.45.67.22.55.77.C.37.99.44.45.67.22.55.77.C.37.99.44.45.67.22.55.77.C.37.99.44.45.67.22.55.77.C.33.44.55.54.78.655.43.22.2.4.55.22. Do an.Tai lieu. Luan van. Luan an. Do an.Tai lieu. Luan van. Luan an. Do an
LIST OF FIGURES
Figure 1: 11kW Peristaltic Pump on Site, LPPT 65 (DN65)
Figure 2: Pump Performance as per OEM
Figure 3: The Structure of Pump LCC
Figure 4: Schematic of Peristaltic Pump Flow
Figure 5: Main Components of LPP65T (DN65)
Figure 6: Types of drive units for positive displacement pump
Figure 7: Pump Performance Curve
Figure 8: Bathtub Curve
Figure 9: Overview of different maintenance types
Figure 10: Components of RCM
Figure 11: Different approaches of condition monitoring
Figure 12: Fishbone Diagram
Figure13: Fault Tree Analysis
Figure 14: Closed Loop Corrective Action Process
Figure 15: Typical FRACAS Process
Figure 16: Eight-Pillar Approach to TPM
Figure 17: The OEE formulation and the six losses
Figure 18: Computerised Maintenance Management System
Figure 19: Condition Monitoring System Design
Figure 20: Slurry Pump Vibration Analysis
Figure 21: Statistics Related to Motor Failure
Figure 22: Time plot of a stator current measurement
@edu.gmail.com.vn.bkc19134.hmu.edu.vn
ix
C.33.44.55.54.78.65.5.43.22.2.4..22.Tai lieu. Luan 66.55.77.99. van. Luan an.77.99.44.45.67.22.55.77.C.37.99.44.45.67.22.55.77.C.37.99.44.45.67.22.55.77.C.37.99.44.45.67.22.55.77.C.33.44.55.54.78.655.43.22.2.4.55.22. Do an.Tai lieu. Luan van. Luan an. Do an.Tai lieu. Luan van. Luan an. Do an
Figure 23: Frequency spectrum of the stator current measurements
@edu.gmail.com.vn.bkc19134.hmu.edu.vn
x
C.33.44.55.54.78.65.5.43.22.2.4..22.Tai lieu. Luan 66.55.77.99. van. Luan an.77.99.44.45.67.22.55.77.C.37.99.44.45.67.22.55.77.C.37.99.44.45.67.22.55.77.C.37.99.44.45.67.22.55.77.C.33.44.55.54.78.655.43.22.2.4.55.22. Do an.Tai lieu. Luan van. Luan an. Do an.Tai lieu. Luan van. Luan an. Do an
LIST OT TABLES
Table1: Historic Pumps Failures
Table2: Essentials of RCM activities
Table 3: Questionnaires Distribution
Table 4: Response from Participants
Table 5: Data for classification of failures
Table 6: Summary of Total Downtime Costs and Hours
Table 7: Motor CM Various Techniques Comparisons
Table 8: Bearing Vibrations Features
Table 9: Failure Rate of Each Pump
Table 10: Minimum Distance Around the Pump
Table 11: Foundation Bolts and Tightening Torque
@edu.gmail.com.vn.bkc19134.hmu.edu.vn
xi
C.33.44.55.54.78.65.5.43.22.2.4..22.Tai lieu. Luan 66.55.77.99. van. Luan an.77.99.44.45.67.22.55.77.C.37.99.44.45.67.22.55.77.C.37.99.44.45.67.22.55.77.C.37.99.44.45.67.22.55.77.C.33.44.55.54.78.655.43.22.2.4.55.22. Do an.Tai lieu. Luan van. Luan an. Do an.Tai lieu. Luan van. Luan an. Do an
ACRONYMS
APPA Atmospheric Pollution Prevention Act of 1965 Constitution of the Republic of South
Africa, 1996
BHP
Brake Horse Power
CBM Condition Based Maintenance
CM
Condition Monitoring
CMMS Computerized Maintenance Management System
DAQ Data Acquisition
ECA Environment Conversation Act 73 of 1989
EBM
Ekurhuleni Base Metals
FMECA Failure Mode, Effects and Criticality Analysis
FRACAS Failure Reporting Analysis and Corrective Analysis
FTA
Fault Tree Analysis
HSA Hazardous Substance Act 15 of 1973, and Regulations
LCC
Life Cycle Cost
MDT Maintenance Down Time
MTBF Mean Time Between Failures
MTBM Mean Time Between Maintenance
MTTR Mean Time To Repair
NEMA National Environment Management Act 107 of 1998, and Regulations
NEMAQA National Environment Management Air Quality Act 9 of 2004
NWA National Water Act 36 of 1968, and Regulations
NWMWA National Environment Management Waste Act 59 of 2008, and Regulations
OEE Overall Equipment Efficiency
@edu.gmail.com.vn.bkc19134.hmu.edu.vn
xii
C.33.44.55.54.78.65.5.43.22.2.4..22.Tai lieu. Luan 66.55.77.99. van. Luan an.77.99.44.45.67.22.55.77.C.37.99.44.45.67.22.55.77.C.37.99.44.45.67.22.55.77.C.37.99.44.45.67.22.55.77.C.33.44.55.54.78.655.43.22.2.4.55.22. Do an.Tai lieu. Luan van. Luan an. Do an.Tai lieu. Luan van. Luan an. Do an
OEM Original Equipment Manufacturer
PDM Predictive Maintenance
RCFA Root Cause Failure Analysis
RCM Reliability Cantered Maintenance
RM Reactive Maintenance
RMS Root Mean Square
SPR Strategic Petroleum Reserve
TAAF Test, Analyse and Fix
TBM Time Based Maintenance
TPM Total Productive Maintenance
@edu.gmail.com.vn.bkc19134.hmu.edu.vn
xiii
C.33.44.55.54.78.65.5.43.22.2.4..22.Tai lieu. Luan 66.55.77.99. van. Luan an.77.99.44.45.67.22.55.77.C.37.99.44.45.67.22.55.77.C.37.99.44.45.67.22.55.77.C.37.99.44.45.67.22.55.77.C.33.44.55.54.78.655.43.22.2.4.55.22. Do an.Tai lieu. Luan van. Luan an. Do an.Tai lieu. Luan van. Luan an. Do an
CHAPTER 1. INTRODUCTION
This dissertation researched predictive maintenance of positive displacement pumps at
Ekurhuleni Base Metals (EBM) in Springs, Gauteng, South Africa. The study investigated
predictive maintenance techniques that can be applied to these pumps to improve availability
and reduce maintenance costs.
1.1
Dissertation Outline
Chapter1 introduces the study, background of EBM, problem statement, research objectives,
research questions, research method and conclusion. Chapter 2 reviews the literature used to
answer the research questions and investigates EBM’s current maintenance strategy. Chapter
3 explains the methodology used to answer the research questions. Chapter 4 explains the
data collection process, and chapter 5 analyses the data. Chapter 6 presents the research
conclusions and makes recommendations as well as suggestions for future research.
1.2
Background of Ekurhuleni Base Metals
In 1967 Gold Fields converted the closed Vogelstruisbult uranium plant into an electrolytic
zinc plant. In 1999, the majority of shares were sold to Iscor, which later unbundled, and
Zincor became part of the base-metals division of Kumba Resources. In November 2006,
Kumba Resources once again unbundled to form Kumba Iron Ore and Exxaro Resources.
Zincor is now a division of Exxaro Base Metals. Later in 2011, Exxaro decided to close the
refinery plant for market reasons. In early 2012, Ekurhuleni Base Metals (EBM) took over
Zincor. EBM is the rehabilitation project, which will exist for approximately 40 years. The
project takes back deposits of lead, silver, iron residue and neutral leach from slime dams.
The rehabilitation project at EBM is divided into five categories, namely:
1.2.1 Plant decommissioning and dismantling of plant equipment
For this project, EBM is breaking down parts of the plant that are no longer in use. The scrap
metal is cleaned onsite and sold to the scrap companies, and the waste thereof is disposed of
as hazardous waste.
1.2.2 Reprocessing of old Zincor residue
This project is divided into three phases: lead silver, neutral leach and iron residue. These
three residues will be re-mined at different phases to extract metal (for example, gold, silver,
@edu.gmail.com.vn.bkc19134.hmu.edu.vn
1
C.33.44.55.54.78.65.5.43.22.2.4..22.Tai lieu. Luan 66.55.77.99. van. Luan an.77.99.44.45.67.22.55.77.C.37.99.44.45.67.22.55.77.C.37.99.44.45.67.22.55.77.C.37.99.44.45.67.22.55.77.C.33.44.55.54.78.655.43.22.2.4.55.22. Do an.Tai lieu. Luan van. Luan an. Do an.Tai lieu. Luan van. Luan an. Do an
zinc, iron, etc.) that is left in the residue. The metal and gypsum (from neutral leach) will be
sold to different companies.
1.2.3 Treatment of contaminated water
This EBM project is currently abstracting groundwater from several boreholes that are
located on the southern side of the operation. The contaminated groundwater is treated in the
effluent treatment plant and then discharged at dam 7L4.
1.2.4 Reclamation of gold tailings
This project has not yet commenced. After the EBM is done with Zincor residue, this project
will re-mine the gold tailings to extract gold.
1.2.5 Removal of miscellaneous waste and clean-up of surrounding areas
This project will remove miscellaneous waste in and around the plant and dispose of it in a
hazardous waste landfill site. It will then clean up the affected sites.
1.3
Environmental Impact
The projects have the following environmental impact:
•
Mining consumes a lot of water, which is a scarce natural resource.
•
Furthermore, the process pollutes clean water.
•
Groundwater abstraction, although the contaminated groundwater is treated, can lead
to groundwater depletion and lowering out of water tables.
•
The breaking down of the plant has an aesthetic impact on the Struisbult community,
as a result of air pollution due to the dust, and soil pollution and degradation due to
the toxic/hazardous substances that may be accidentally released onto the ground.
•
Reclamation of gold tailing has the potential to cause acid mine drainage and severe
dust.
1.4
Applicable Legislation
The following legislation is applicable to the projects:
•
Atmospheric Pollution Prevention Act 45 of 1965(APPA)Constitution of the Republic
of South Africa, 1996
•
Environment Conservation Act 73 of 1989 (ECA)
•
Hazardous Substances Act 15 Of 1973, and Regulations (HSA)
@edu.gmail.com.vn.bkc19134.hmu.edu.vn
2
C.33.44.55.54.78.65.5.43.22.2.4..22.Tai lieu. Luan 66.55.77.99. van. Luan an.77.99.44.45.67.22.55.77.C.37.99.44.45.67.22.55.77.C.37.99.44.45.67.22.55.77.C.37.99.44.45.67.22.55.77.C.33.44.55.54.78.655.43.22.2.4.55.22. Do an.Tai lieu. Luan van. Luan an. Do an.Tai lieu. Luan van. Luan an. Do an
•
National Environmental Management Act 107 of 1998, and Regulations (NEMA)
•
National Environmental Management Air Quality Act 39 of 2004 (NEMAQA)
•
National Environmental Management Waste Act 59 of 2008, and Regulations
(NEMWA)
•
National Water Act 36 of 1998,and Regulations (NWA)
•
Mineral and Petroleum Resources Development Act28 of 2002 (MPRDA) –only be
applicable once EBM starts with gold tailings
•
Ekurhuleni Metropolitan Municipality by-laws
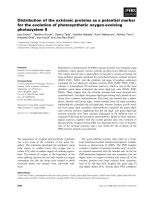
Figure 1: 11kW Peristaltic Pump on Site, LPPT 65 (DN65)
1.5
Problem Statement
EBM uses positive displacement pumps on underflow thickeners to transfer the solution.
These pumps must be reliable so that they can pump solution from thickener to the presses.
Currently EBM is doing reactive maintenance. The cost of maintenance and downtime is
escalating. Appendix 2 explains and discusses the figures of these costs and downtime.
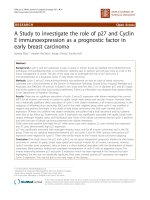
Currently the pumps are not delivering the required flow as per OEM (Original Equipment
Manufacturer).The user is getting between 13 m3/h and 17 m3/h. The pump model LPPT 65
@edu.gmail.com.vn.bkc19134.hmu.edu.vn
3
C.33.44.55.54.78.65.5.43.22.2.4..22.Tai lieu. Luan 66.55.77.99. van. Luan an.77.99.44.45.67.22.55.77.C.37.99.44.45.67.22.55.77.C.37.99.44.45.67.22.55.77.C.37.99.44.45.67.22.55.77.C.33.44.55.54.78.655.43.22.2.4.55.22. Do an.Tai lieu. Luan van. Luan an. Do an.Tai lieu. Luan van. Luan an. Do an
(DN65) is designed to deliver a flow of 20m3/h. The figure below explains pump
performance.
Figure 2: Pump Performance as per OEM [31]
This research aims to determine how predictive maintenance can maximise or increase the
availability of positive displacement pumps that are already in operation. It will focus on
minimizing downtime and maintenance costs.
1.5.1 Breakdown of failures
Failures are categories as follows:
A> Electrical failures
B> Wear and tear on the hose
C> Mechanical failures on pipes and Larox pinch valves
Category
Year 1
Year 2
Year 3
A
3
5
6
B
2
1
2
C
1
2
2
Total
6
8
10
Table1: Historic Pumps Failures
@edu.gmail.com.vn.bkc19134.hmu.edu.vn
4
C.33.44.55.54.78.65.5.43.22.2.4..22.Tai lieu. Luan 66.55.77.99. van. Luan an.77.99.44.45.67.22.55.77.C.37.99.44.45.67.22.55.77.C.37.99.44.45.67.22.55.77.C.37.99.44.45.67.22.55.77.C.33.44.55.54.78.655.43.22.2.4.55.22. Do an.Tai lieu. Luan van. Luan an. Do an.Tai lieu. Luan van. Luan an. Do an
1.5.2 Current maintenance strategy at EBM
Maintenance strategy is regarded as the major part of total costs in most manufacturing and
production plants. Selection of the best maintenance strategy plays an important role in the
success of an organization.
Reaction maintenance or run to failure is the strategy whereby equipment is repaired every
time it fails; no action is taken to detect or to prevent the failure in future. For this type of
maintenance strategy, the cost of maintenance is high but the maintenance is effective [60].
CBM is applied in critical components of the machinery to predict failure of the machinery.
Decision is made after gathering data from monitoring systems like ultrasonic and condition
monitoring.
When organization selects the best maintenance strategy, firstly the maintenance goals that
are set, and must be compared. The goals of maintenance are divided into four aspects and
they are as follows:
•
•
•
•
Safety
Costs
Value added
Feasibility
Also maintenance has two different aspects:
•
•
Tangible goals
Intangible goals
Tangible goals can be measured by using different tools like, maintenance costs and
reliability. Intangible cannot be measured, but it can be estimated by using tools like labors
and enhance competitiveness [16].
Currently, EBM run pumps until they fail, using a reactive maintenance strategy.
Maintenance costs are very high and most of the time artisans are idling. Reactive
maintenance is a fire-fighting approach to maintenance. Machinery is run until failure. Then
the machinery is replaced or repaired. In reactive maintenance, repairs are made in order to
get the machinery back into operation, with permanent repairs put off until a later time. In
reactive maintenance, organisations minimise resources and spent less money to keep the
machinery running. The disadvantages of reactive maintenance include unpredictability,
fluctuation of production capacity and an increase in maintenance costs to repair catastrophic
failures of machinery.
The study of the breakdown of failures revealed the following:
•
>55% reactive
•
31% preventive
@edu.gmail.com.vn.bkc19134.hmu.edu.vn
5
C.33.44.55.54.78.65.5.43.22.2.4..22.Tai lieu. Luan 66.55.77.99. van. Luan an.77.99.44.45.67.22.55.77.C.37.99.44.45.67.22.55.77.C.37.99.44.45.67.22.55.77.C.37.99.44.45.67.22.55.77.C.33.44.55.54.78.655.43.22.2.4.55.22. Do an.Tai lieu. Luan van. Luan an. Do an.Tai lieu. Luan van. Luan an. Do an
•
12% predictive
•
2% other [6][32]
1.6
Research Objectives
•
This study’s main objective is to increase or maximize the availability of positive
displacement pumps. The amount of downtime is increasing every year as per Table 1
•
This study aims to determine if a predictive maintenance strategy is the best strategy
to maximise the availability of positive displacement pumps.
•
It will answer the following research questions: Is predictive maintenance costeffective, and will it reduce maintenance costs and downtime?
1.7
Research Questions
The following research questions will be answered to determine whether a predictive
maintenance strategy can be used to increase the availability of positive displacement pumps:
•
Will predictive maintenance increase the availability of positive displacement pumps?
•
What parameters must be controlled and monitored in predictive maintenance? [65]
1.8
Research Methods
This research used the following methods:
•
Quantitative method – This method contains all the information required to answer
the research questions.
•
Descriptive method – The researcher administered questionnaires.
Chapter 3 will explain the research methods.
1.9
Chapter Summary
This chapter introduced the study. It described the background of EBM, its current
maintenance practices and problem areas. It presented the research objectives, questions and
methods. The following chapter will review the literature used to answer the research
questions.
@edu.gmail.com.vn.bkc19134.hmu.edu.vn
6
C.33.44.55.54.78.65.5.43.22.2.4..22.Tai lieu. Luan 66.55.77.99. van. Luan an.77.99.44.45.67.22.55.77.C.37.99.44.45.67.22.55.77.C.37.99.44.45.67.22.55.77.C.37.99.44.45.67.22.55.77.C.33.44.55.54.78.655.43.22.2.4.55.22. Do an.Tai lieu. Luan van. Luan an. Do an.Tai lieu. Luan van. Luan an. Do an
CHAPTER 2. LITERATURE REVIEW
This chapter presents a review of the literature, as follows:
2.1
•
Introduction
•
Peristaltic pump
•
Basic operation of peristaltic pump
•
Types of peristaltic pumps
•
Factors that influence availability
•
Bathtub curve
•
Maintenance strategies
•
Condition monitoring techniques
Introduction
Pumps are classified into two groups, namely positive and non-positive displacement pumps.
A positive displacement pump delivers a constant volume for every revolution. When the
internal displacement volume of the pump is variable, the pump is called a variable positive
displacement pump. The most common non-positive displacement pumps are centrifugal
pumps and turbines. In non-positive displacement pumps, when the impeller rotates, it creates
centrifugal force that pushes the liquid through the system, rather than capturing it, exiting
with a fixed volume per stroke. When the outlet is closed, the impeller continues to rotate
harmlessly. Non-positive displacement pumps are not required to have a relief valve. Flow
rates range from a couple of litres per minute up to 2 500 litres per minute, and pressure
ranges from 3 MPa to 100 MPa. Pressure and flow rates are crucial when choosing a pump to
be installed [57][61].
Maintenance is a very important activity because downtime is the most costly condition in a
manufacturing or process plant. For example, in industries and international markets, such as
aircraft, submarine, and nuclear power plants, maintenance policies increase company profits
and safety [91]. Maintenance is performed to extend the pump’s lifetime or at least maintain
it until the next failure [40].
One of the keys to the cash flow of every organisation is to maximise profits. It allows top
management, including engineers, to determine the optimal maintenance plan to implement
for the system [62].
@edu.gmail.com.vn.bkc19134.hmu.edu.vn
7
C.33.44.55.54.78.65.5.43.22.2.4..22.Tai lieu. Luan 66.55.77.99. van. Luan an.77.99.44.45.67.22.55.77.C.37.99.44.45.67.22.55.77.C.37.99.44.45.67.22.55.77.C.37.99.44.45.67.22.55.77.C.33.44.55.54.78.655.43.22.2.4.55.22. Do an.Tai lieu. Luan van. Luan an. Do an.Tai lieu. Luan van. Luan an. Do an
Asset management is performed to maximize machinery performance, as well as to minimise
the costs of failure and repair. Asset management is defined as a tool that is used to manage
resources and financial investments, and also increases the reliability of the machinery to
meet client expectations [73].
South Africa spends almost R578 million on imported pumps, and R564 million on locally
manufactured pumps. The typical life cycle of a pump is 5% capital, 5-25% on maintenance,
70-79% of power. This implies that South Africa spend R500 million to R2.5 billion per year
on maintenance alone [68].
LCC (Life Cycle Cost) is the total cost of a system or equipment during its lifetime. This cost
includes planning, purchase, operation and maintenance and disposal [10].
The life cycle cost of a pump is comprised of the pump’s performance, efficiency, operation,
and reliability costs. The life cycle cost of a pump is divided into the following:
• Initial costs:10%
• Energy costs: 40%
• Maintenance costs: 23%
• Operating costs: 10%
• Environmental costs: 5%
• Installation costs: 7%
• Costs associated when the pump is not in use: 3% [92].
It is also helpful to compare different types of pumps. For example, in two pumps with the
same capacity and material specifications, differences of LCC will be minor. When the LCC
of different pumps is compared, assumptions of values such as inflation and interest rates
must be made. Pump failures causing production loss may be high, but it is very difficult to
determine in this context. Elements like installation and commissioning, decommissioning
and disposal/retirement can be ignored for comparison purposes depending on the availability
of costs or previous experience of pump LCC [34].
@edu.gmail.com.vn.bkc19134.hmu.edu.vn
8
C.33.44.55.54.78.65.5.43.22.2.4..22.Tai lieu. Luan 66.55.77.99. van. Luan an.77.99.44.45.67.22.55.77.C.37.99.44.45.67.22.55.77.C.37.99.44.45.67.22.55.77.C.37.99.44.45.67.22.55.77.C.33.44.55.54.78.655.43.22.2.4.55.22. Do an.Tai lieu. Luan van. Luan an. Do an.Tai lieu. Luan van. Luan an. Do an
Figure 3: The Structure of Pump LCC [91]
Costs that are incurred in ensuring the health of machinery must be evaluated so that the cost
effective maintenance strategy can be selected. Cost Benefit Analysis is a commonly used
tool to estimate the reduction of costs incurred during machinery repairs [52].
MTBF (Mean Time Between Failures) is defined as the average time when the system
performed its intended function between failures.
MTTR (Mean Time To Repair) is defined as the average time taken to repair the equipment
and getting it back into service. Inherent availability is defined as MTBF divided by MTBF
plus MTTR.
In the pump industry, metrics that are used to define reliability are MTBF, MTTR,
availability, reliability and time [38].
Large industries practice maintenance strategies like TBM (Time Based Maintenance), PDM
(Predictive Maintenance) and RM (Reactive Maintenance) to meet maintenance
requirements. In PDM, the machinery is monitored using techniques like vibration
@edu.gmail.com.vn.bkc19134.hmu.edu.vn
9
C.33.44.55.54.78.65.5.43.22.2.4..22.Tai lieu. Luan 66.55.77.99. van. Luan an.77.99.44.45.67.22.55.77.C.37.99.44.45.67.22.55.77.C.37.99.44.45.67.22.55.77.C.37.99.44.45.67.22.55.77.C.33.44.55.54.78.655.43.22.2.4.55.22. Do an.Tai lieu. Luan van. Luan an. Do an.Tai lieu. Luan van. Luan an. Do an
monitoring, thermal monitoring and bearing shock-pulse. In industries practicing RCM
(Reliability Centred Maintenance), the PDM requirements of critical machinery are normally
based on FMECA (Failure Mode, Effects and Criticality Analysis) as well as decision logic.
The above-mentioned philosophies will be used in the maintenance of positive displacement
pumps [5][42].
When RCM is implemented, it is recommended that all maintenance tasks carried out must
be documented. Maintenance data can be divided into failure history, condition monitoring
data and domain language [66].
RCM determines the appropriate maintenance strategy for the equipment. It ensures that the
system has a full range of maintenance tasks to avoid excessive costs, reducing system failure
caused by poor maintenance in order to improve the reliability of the equipment [71][17].
Total Productive Maintenance (TPM) is used in most industries to apply a comprehensive,
life cycle approach to machinery to minimise machinery stoppages. Its objective is to
maximise availability and simultaneously to prevent degradation of the machinery to achieve
high effectiveness [8]. Effectiveness and efficiency of machinery are very critical in
industries to determine the performance of the organisation output function and the level of
success in an organisation [29].
Reliability growth requirements are measured in MTBF. In order for reliability growth to take
place, the causes of systematic failures must be minimised so that the failure mode is
eliminated or its occurrence is significantly reduced. Mitigation of the systematic failure
modes of a product results in reliability improvement.
Test, analyse and fix (TAAF) is a test approach commonly used in reliability growth testing.
It is referred as to as accelerated testing where products are tested for failure, fixed and tested
again. Testing is performed to evaluate whether the design does what is supposed to do.
Essentially, tests are used to disclose product design deficiencies and institute design
improvements before making a commitment [87][15].
In order to design for reliability one needs to design failure modes under the use conditions
within useful product life. Step 1: Operating conditions and environmental conditions of the
product must be known. The aim is to identify stresses that are not relevant for the product. In
some cases the product itself can create temperature cycles from different load conditions.
Step 2: Component specifications happen during the design phase. Step 3: Potential
@edu.gmail.com.vn.bkc19134.hmu.edu.vn
10
C.33.44.55.54.78.65.5.43.22.2.4..22.Tai lieu. Luan 66.55.77.99. van. Luan an.77.99.44.45.67.22.55.77.C.37.99.44.45.67.22.55.77.C.37.99.44.45.67.22.55.77.C.37.99.44.45.67.22.55.77.C.33.44.55.54.78.655.43.22.2.4.55.22. Do an.Tai lieu. Luan van. Luan an. Do an.Tai lieu. Luan van. Luan an. Do an
component failures are normally based on Step 1 & 2. Step 4: Failure consequences and the
relevant failure modes must be combined together with operating conditions. For example, it
is crucial to take interactions between all stress types into account, like mechanical loads that
can cause cracks on a shaft. This must be covered by making stress types and failure design
based on FMEA [67].
2.2
Peristaltic Pumps
A peristaltic pump is a positive displacement pump that is used to pump different liquids. It is
used in many applications such as in the medical sector, R&D laboratories, pharmaceutical
companies, the food industry and chemical plants.
2.2.1 Basic operation of peristaltic pump
When the pump starts, the inlet tubing becomes closed, and its roller moves forward and
pushes the pump segment to the manifold. The fluid inside the tube is pushed in a forward
direction, and a pressure wave is generated. Before it reaches the outlet, the roller closes the
tube inlet to prevent backflow. When the first roller leaves the outlet, the second roller
generates the next pressure wave.
Figure 4: Schematic of Peristaltic Pump Flow [3]
2.2.2 Types of peristaltic pumps
Peristaltic pumps are classified in two types, as follows:
•
Tube pumps
•
Hose pumps
The only difference between the two types is that the hose pump contains a pump segment,
which is a reinforced tube called hose. The advantage of the hose pump type is that it can
operate at higher pressure than tube pumps, up to a working pressure of 16 bars. A peristaltic
@edu.gmail.com.vn.bkc19134.hmu.edu.vn
11